Suzuki Statistics By Sales, Growth And Insights (2026)
Updated · Apr 10, 2026

Table of Contents
Introduction
Suzuki Statistics: The period from 2025 to 2026 marks a time when Suzuki Motor Corporation will establish itself as a worldwide leader in automotive technology and mobility services because markets in developing countries, especially India, provide strong growth opportunities, and the company maintains the steady expansion of its two-wheeler business.
The company achieved operational stability through continuous revenue growth and increasing international sales, although it faced challenges from macroeconomic factors, supply chain interruptions, and currency market fluctuations. The company succeeded in outperforming its competitors through its strategic decision to concentrate on developing small vehicles that maximize cost savings and produce vehicle parts from local sources.
This article will present the Suzuki statistics for sustainable development goals by increasing its investment in hybrid and electric vehicle technologies while sustaining its market leadership in budget-friendly product segments.
Editor’s Choice
- Suzuki Motor Corporation’s March 2026 total sales reached 225251 units, which marked a 16.7% increase compared to the previous year.
- Domestic sales grew 11.4% from the previous year, while exports increased by approximately 42.7% from the previous year.
- The company sold 166219 passenger vehicles, representing a 10.3% increase from the previous year.
- The compact segment was responsible for 71789 units, accounting for 43% of total passenger vehicle sales.
- The utility vehicle segment reached 71356 units, representing a 16.8% increase from the previous year.
- The company achieved total sales of 2.42 million units during the fiscal year 2025 to 2026, which marked an 8.4% growth from the previous year.
- The company exported 447774 units, which represented a 34.6% increase from the previous year.
- Global production reached 320617 units in February 2026, which represented a 12.3% increase from the previous year.
- The company produced 75% of its total output through its overseas facilitiesexperienced 17.6% annual growth.
- India produced 223441 units, which represented a 19.2% annual increase from the previous year and accounted for approximately 93% of total overseas production.
- The total production volume in Japan decreased by 1.1% to 80463 units compared to the previous year.
- ¥45166 billion in revenue for the fiscal year 2025 to date, showed a 5% increase from the previous year; however, its operating profit decreased by 11%.
- The automotive segment generated ¥41002 billion, accounting for approximately 90% of total revenue while achieving a 9.1% profit margin.
- Global sales reached 2418 million units, which represented a 2.3% increase from the previous year, and India contributed approximately 56% of total sales.
- Dividend per share increased to ¥46 (FY2025E) from ¥8 in FY2015 (~6x growth, ~19–20% CAGR).
Suzuki Unit Sales
(Source: marutistoragenew.blob.core.windows.net)
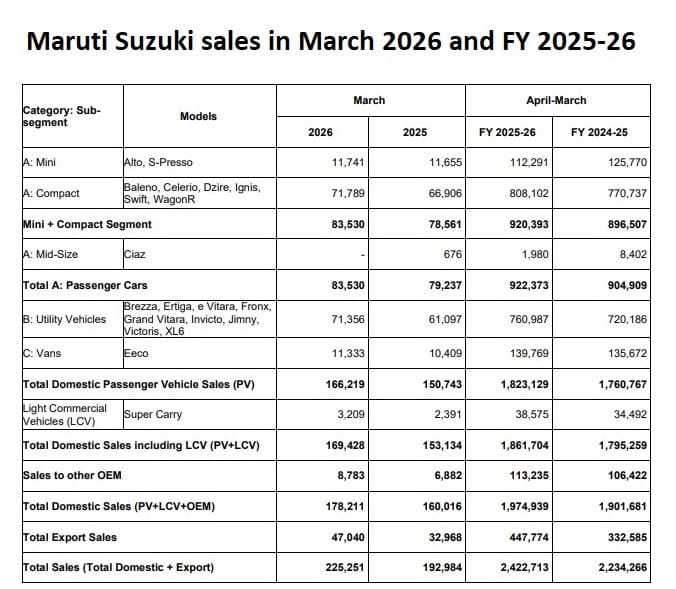
- The Maruti Suzuki Corporate report shows that the company achieved impressive sales results through its strategic approach, which resulted in strong demand for passenger vehicles, utility vehicles, and export operations.
- The numbers show both the monthly growth pattern from March to the present and the fiscal development from FY2024-25 to FY2025-26.
- The total sales for March 2026 reached 225251 units, which represented a 167 % increase in year-over-year sales because of the 192984 units sold during March 2025.
- The domestic sales experienced strong growth of 114% while export sales reached an outstanding growth of approximately 427%, which demonstrates the increasing international market demand and better supply chain management.
- The total passenger vehicle market in March 2026 reached 166219 units, which shows a 10.3 % year-over-year increase from the 150743 units sold.
- The compact segment, which includes Baleno, Swift, and Dzire, maintains its market leadership position through 71789 unit sales, which account for more than 43 % of total PV sales.
- The mini segment, which includes Alto and S-Presso, maintains its position without major changes, while its sales increase only slightly because customers now prefer to buy higher-quality products instead of entry-level vehicles.
- The utility vehicle UV segment achieved market leadership through 71356 units sold in March 2026, which represents a 16.8 % growth compared to the previous year.
- The Brezza Fronx and Grand Vitara models drive the sales increase, which works with the Indian SUV market expansion that results in higher UV market penetration.
- The total sales for FY2025-26 reached 2.42 million units because the company sold 2.23 million units during FY2024-25, which resulted in an annual growth rate of 8.4 %.
- The company achieved domestic PV sales of 1.82 million units, while its export business experienced a 34.6 % growth rate to reach 447,774 units, which demonstrates Suzuki’s success in building international market presence through its export-based growth strategy.
- The company achieved revenue growth through the consistent sales increases from light commercial vehicles (LCV) and OEM products, which provided additional income streams to its operations.
- The introduction of LCV and OEM sales channels brought total domestic sales to 1.97 million units, which demonstrated the effectiveness of the company’s multi-channel distribution approach.
- Maruti Suzuki drives its business through three main growth areas, which include SUV development, export market expansion, and premium product offerings, while the company maintains its competitive edge through strong volume growth and market leadership in specific segments of the automotive industry.
Suzuki Production
(Source: globalsuzuki.com)
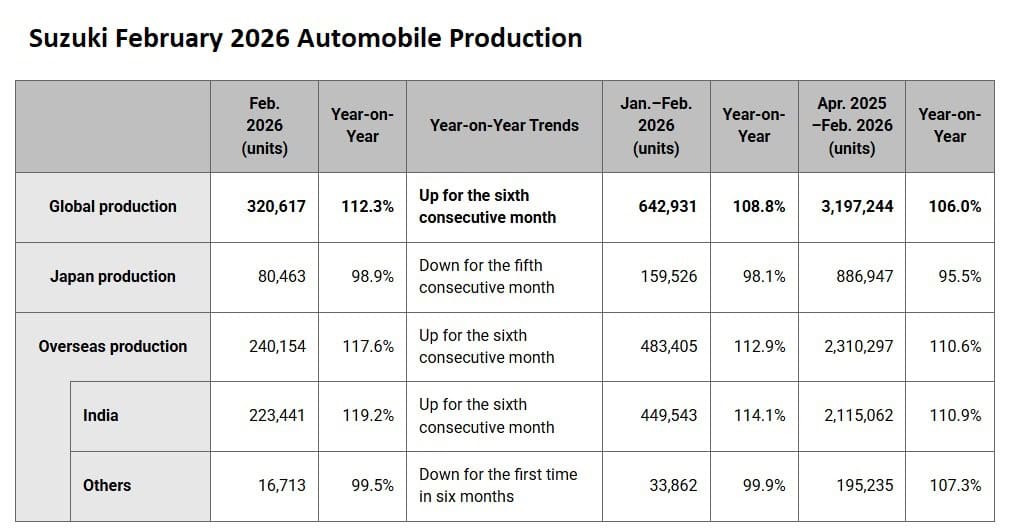
- The production data of Suzuki Motor Corporation shows that the company pursues a strong manufacturing expansion plan, which depends mainly on international markets, while Japanese production facilities experience ongoing operational difficulties.
- Suzuki achieved a global production total of 320617 units in February 2026 to show a strong 123 % year over year growth, which continued for its sixth month straight.
- The ongoing upward trend demonstrates that the supply chain has recovered, capacity utilization has improved, and global automotive demand remains steady.
- The regional distribution of key insights produces important information. Japanese production decreased to 80463 units, which represents an 11 YoY decrease and marks the fifth consecutive month of production decline.
- The domestic manufacturing base shows signs of permanent decline because production expenses increase while market demand reaches its peak and companies implement international production strategies.
- The overseas production reached 240154 units, which provided a strong 176 YoY increase that continued for the sixth consecutive month.
- The segment now represents almost 75 of total worldwide production, which supports Suzuki’s international expansion approach and focus on developing markets.
- India leads development in international markets because it produced 223441 units, which represents a 192 YoY increase.
- The manufacturing base which exists in India serves as a hub to produce and distribute products, which accounts for over 93 of total international output.
- The strong performance shows how domestic demand increases while the SUV and compact car markets grow, and the business environment stays positive.
- Production levels in other areas stayed almost unchanged at 16713 units, which showed a decline of 05 YoY because of specific difficulties in certain areas, while demand returned to normal levels.
- The period from April 2025 to February 2026 saw global production reach 3.19 million units, which resulted in a 6.0% year-over-year growth rate that stemmed from increased international production, which grew by 10.6%.
- Suzuki has established a strategic direction that leads to high-growth international markets by expanding its operations in India, which helps the company to compete in the global automobile manufacturing industry.
Suzuki Motor Corporation Financial Performance Insights

(Source: globalsuzuki.com)
- The fiscal year 2023 to fiscal year 2025 period shows Suzuki’s revenue and operating profit performance, which demonstrates the company building its financial stability through market challenges.
- From the beginning of fiscal year 2023, Suzuki showed regular revenue growth began at ¥1204.4 billion for the first quarter and reached ¥1523.4 billion for the fourth quarter, according to their quarterly growth pattern.
- The operating profit margins experienced fluctuations, which reached their highest point at ¥140.2 billion during the second quarter and decreased to ¥122.7 billion during the fourth quarter because of cost-related challenges or planned expenditures for future growth.
- The company experienced a minor decrease in profitability during the third quarter, but the fourth quarter recovery demonstrated its ability to manage costs effectively and sustain business operations.
- Suzuki maintains its growth path throughout the 2025 fiscal year.
- The third quarter revenue exceeded ¥1652.4 billion, which became the highest amount in the entire dataset, while the year-over-year growth rate surpassed 8 % when compared to the third quarter of 2024.
- The operating profit maintains its constant range between ¥143 billion and ¥153 billion, which indicates stable earnings before interest and taxes despite the impact of economic market fluctuations.
- The performance of Suzuki demonstrates a combination of revenue growth and controlled profit management.
- The data shows that the company achieves operational efficiency through its size, which creates an attractive investment option for people who want stability and controlled business development in the competitive automotive market.
Suzuki Motor Corporation Segment Performance
(Source: globalsuzuki.com)
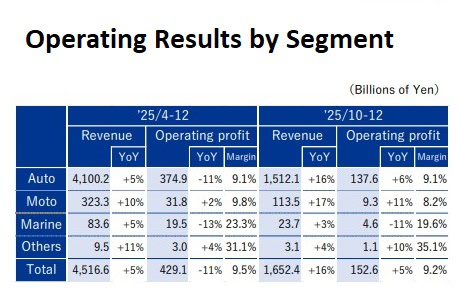
- Suzuki’s segment-wise performance for FY2025 highlights a compelling story of revenue growth, segment diversification, and margin stability, which helps the company to establish its dominance in the international automotive and mobility sector.
- The total revenue for the April–December (’25/4–12) period reached ¥4,516.6 billion, which showed a positive growth of 5% compared to the previous year.
- Operating profit declined by 11% YoY to ¥429.1 billion, bringing the operating margin to 9.5%. The disparity between revenue growth and profit decline indicates that increasing input expenses or corporate strategic choices are affecting short-term profit performance.
- The Auto segment serves as the main driver of company growth, generating 90% of total revenue through its ¥4,100.2 billion revenue stream, which shows a 5% annual growth rate.
- The company experienced an 11% decline in operating profit while maintaining 9.1% profit margins, which resulted from market competition and rising operational costs despite achieving high production volume.
- The Moto segment achieved double-digit revenue growth at a rate of 10% YoY, which resulted in a 2% increase in operating profit and a 9.8% margin, which demonstrates strong market demand and effective expense control.
- The Marine segment, although it operates at a smaller size, achieves a remarkable operating margin of 23.3%, which shows its premium market position despite the current economic downturns.
- The Others segment maintains its status as a small market, but it generates exceptional profits with a 31.1% margin, which represents the highest profit margin among all market segments.
- Suzuki achieved revenue growth of 16%, which brought their total revenue to ¥1,652.4 billion, while their operating profit increased by 5% to maintain a 9.2% profit margin during the October to December period of 2025.
- The Auto and Moto segments both achieved strong double-digit revenue growth, which reached 16% and 17%, respectively, because customers showed strong demand recovery.
- Suzuki operates a balanced strategy because it expands its main automotive business while using high-profit specialized markets to achieve sustainable development throughout its operations.
Suzuki Regional Sales

(Source: globalsuzuki.com)
- Suzuki’s fiscal year 2025 third-quarter global sales data demonstrates how the company operates across different regions while succeeding in emerging markets and facing specific challenges in certain areas.
- The company achieved total global sales of 2.418 million units, which resulted in a 2.3 % year-on-year (YoY) increase that demonstrates stable growth in a competitive automotive market.
- Suzuki achieves its business success through India, which operates as the company’s most effective growth market that accounts for 1.35 million units.
- India drives volume expansion through its 3.8 % YoY growth, which results from strong domestic demand and the company’s positive market image.
- The broader Asia (excluding India) region achieved healthy growth with a 10.4 % YoY increase, which shows that developing markets experience increasing demand.
- The market segment shows two distinct trends as Pakistan achieved rapid growth through its 24.4 % YoY increase, while Indonesia showed no growth due to its economic challenges.
- European sales dropped by 18.1 % YoY, resulting in 135 thousand unit sales for the market. The market experienced a significant decline because customers now prefer electric vehicles, while the market reached its full capacity, and regulatory requirements became more difficult for Suzuki to handle.
- The Japanese domestic market showed stability, with 528 thousand units sold (+2.2% YoY), reinforcing a steady home-market base.
- The category “Others”, which includes Latin America, Africa, the Middle East, and Oceania, produced different outcomes. Africa (+18.9% YoY) emerged as a strong growth frontier, while Oceania (-24.3%) experienced the steepest decline, pointing to demand volatility.
- Suzuki’s sales strategy reflects a clear emphasis on high-growth emerging markets, balancing mature market stagnation with volume expansion elsewhere. This diversified footprint enhances resilience, though regional imbalances and declining developed market share remain critical areas to watch for sustained global competitiveness.
Suzuki Motor Corporation Quarterly Cash Flow Trends

(Source: globalsuzuki.com)
- The cash flow pattern, which Suzuki established for fiscal years 2024 through 2025, indicates unstable financial results that the company controls through its strategic financial management practices.
- The research shows four essential metrics, which include Operating Cash Flow, Investing Cash Flow, Financing Cash Flow, and Free Cash Flow, as essential primary keywords that organizations use to assess their financial liquidity and investment distribution.
- In FY2024, Suzuki demonstrated robust operating efficiency, with OCF peaking at ¥236.9 billion, signaling strong core business profitability and healthy revenue conversion.
- The negative investing cash flow, which reached -¥110.5 billion because of high capital expenditure CHAPEX for electrification research and development and the global expansion projects, caused the company to lose some of its strength.
- The Free Cash Flow, which showed brief periods of negative cash flow, reached -¥105.6 billion during one quarter because the company used its cash reserves to support long-term growth projects.
- The company demonstrates better cash flow management practices, which result in cash flow stability as it enters FY2025.
- OCF maintains a solid performance range that extends from ¥64.0 billion to ¥201.3 billion, strengthening the company’s ability to maintain its business operations.
- The ICF maintains its negative status, which reaches its lowest point at -¥96.6 billion, while displaying reduced stability; changes show better capital allocation methods.
- The Free Cash Flow shows initial growth during the early quarters, reaching its highest point at ¥104.7 billion before falling to -¥13.5 billion, which shows that the company maintains proper investment methods instead of wasting cash resources.
- The financial strategy of Suzuki shows that the company prioritizes long-term value creation instead of immediate cash generation, which represents a typical characteristic of automotive companies that focus on growth during their transition to electric vehicles.
- The company operates a cash generation model that produces more than ¥180B in cash and operates through planned cycles of reinvestment, which enables Suzuki to achieve sustainable growth.
- Investors should interpret the negative Free Cash Flow phases not as weaknesses, but as signals of strategic reinvestment and future earnings potential.
Suzuki Motor Corporation Dividend Growth

(Source: globalsuzuki.com)
- Suzuki’s dividend record from FY2015 until FY2025 demonstrates a steady and developing dividend system that the company maintains through its ongoing earnings growth and its commitment to returning capital to shareholders.
- The company’s annual dividend per share has increased nearly 6x, from ¥8 in FY2015 to ¥46 (forecast) in FY2025, which results in a compound annual growth rate (CAGR) of approximately 19–20%, demonstrating that the company creates value for investors over the long term.
- The main element that defines this story is Dividend on Equity (DOE), which serves as the key term that shows the %age of dividends paid to shareholders in relation to their total equity.
- Suzuki’s DOE has steadily improved from 1.4% in FY2015 to a projected 3.0% in FY2025, peaking at 3.1% in FY2024.
- The company shows better capital efficiency through its upward trajectory of profits, which management plans to distribute while keeping its balance sheet intact.
- The 5-year average DOE of ~2.5% further indicates stability and predictability in payout behavior.
- The chart shows that the organization uses a “progressive dividend” system, which maintains or raises dividends at regular intervals to decrease price fluctuations for shareholders.
- Suzuki maintained its dividend growth strategy during the period of limited DOE changes from FY2018 to FY2021, which experienced a 2.4 to 2.5% range, thus showing investors that the company would continue to earn money.
- The company aims to achieve a targeted DOE rate of 3.0% by FY2025, which will help establish its competitive position in the global automotive industry, where stable payout ratios determine company valuation.
- The dividend policy of Suzuki achieves optimal results because it maintains equal distribution between corporate growth and dividends to shareholders, making the investment opportunity appealing to investors who need regular income, value their principal investment, and require ongoing financial management.
Conclusion
Suzuki Statistics: The performance of Suzuki Motor Corporation shows that its business model achieves resilience while delivering growth through its operations in developing markets such as India. The company demonstrates its success in global business expansion through strong international sales growth and increased foreign manufacturing capacity. The company experiences continuous revenue growth while its profit margins decrease because of higher operating expenses and ongoing investments in developing new transportation solutions.
The auto segment maintains its position as the leading business area, which allows the company to distribute increasing dividends that provide both financial security and shareholder trust. The company faces two major challenges, which include uneven market distribution and poor results in advanced economies. The company successfully established itself for future expansion through its methods of producing affordable goods and expanding into emerging automotive markets.
FAQ.
The company sold 2.42 million units, representing an 8.4% increase from the previous year.
Exports increased by 34.6% compared to the previous year, reaching 447774 units.
India contributes approximately 56% of global sales and serves as the main factor driving business expansion.
The production volume reached 320617 units in February 2026, representing a 12.3% yearly increase driven by international operational expansion.
The dividend increased from ¥8 in fiscal year 2015 to ¥46 in fiscal year 2025, which represents approximately six times the increase.

I hold an MBA in Finance and Marketing, bringing a unique blend of business acumen and creative communication skills. With experience as a content in crafting statistical and research-backed content across multiple domains, including education, technology, product reviews, and company website analytics, I specialize in producing engaging, informative, and SEO-optimized content tailored to diverse audiences. My work bridges technical accuracy with compelling storytelling, helping brands educate, inform, and connect with their target markets.