Table of Contents
- Introduction
- Editor’s Choice
- Starbucks Operated Stores
- Starbucks Retail Sales Mix By Product Type
- Starrucks Total Return To Shareholders
- Starbucks Total Revenue
- Quality Of Starrucks Reviews
- Starbucks Operating Expenses
- Starbucks Inventories
- Starbucks Employee Benefit
- Starbucks Credit Facility
- Starbucks Cash Flow
- Starbucks Earnings Per Share
- Conclusion
Introduction
Starbucks Statistics: Starbucks, the global coffee leader associated with lattes, frappuccinos, and third-place social spaces, enters 2025 at a critical point in its business development. The business has grown from its first Seattle store establishment in 1971 to its current status as one of the most recognized brands worldwide because it operates stores in almost every major international market. The year 2025 has shown mixed results because the company has gone through organizational changes and strategic transformation under its new management team.
In this article, we present statistics on Starbucks that reflect multiple aspects of financial performance, store growth, major business alliances, consumer preferences, rising inflation, and intense competition in the international coffee industry.
Editor’s Choice
- Starbucks operated 21,514 company-run stores globally in fiscal 2025, a net increase of 496 stores year over year despite significant closures.
- The U.S. store base declined by 111 locations to 10,047, reflecting deliberate consolidation in a mature market.
- The company’s net revenues increased by 2.8% compared with the previous year, reaching USD 37.18 billion in fiscal 2025.
- Business-operated locations generated USD 30.74 billion in revenue, representing 83% of total revenue and an increase of 3.3% from the prior year.
- Revenue from licensed stores decreased by 3.4% to USD 4.35 billion, indicating that the company chose to work with specific partners.
- Starbucks generated 73% of its total revenue from beverages, indicating that its primary product model yields consistent financial performance.
- The company’s operating expenses reached USD 34.50 billion, resulting in a 92.8% revenue allocation that severely constrained profit margins.
- Operating income decreased to USD 2.94 billion, resulting in an operating margin of 7.9% in fiscal 2024, down from 15.0%.
- The company experienced a 23% increase in inventory, which reached USD 2.19 billion, due to high prices for green and roasted coffee products.
- The company’s operating cash flow declined by 23%, resulting in a total of USD 4.7 billion, due to decreased earnings and increased working capital needs.
- Starbucks established a USD 3.0 billion undrawn revolving credit facility, which will remain active until 2030 to strengthen its liquidity position.
- Net earnings decreased by 50.6%, resulting in total earnings of USD 1.86 billion and indicating a temporary downturn in profitability.
- Starbucks gathered 5.6 million customer reviews from its 16,475 U.S. stores, with 70.2% of locations reaching high statistical reliability thresholds.
Starbucks Operated Stores
(Source: q4cdn.com)
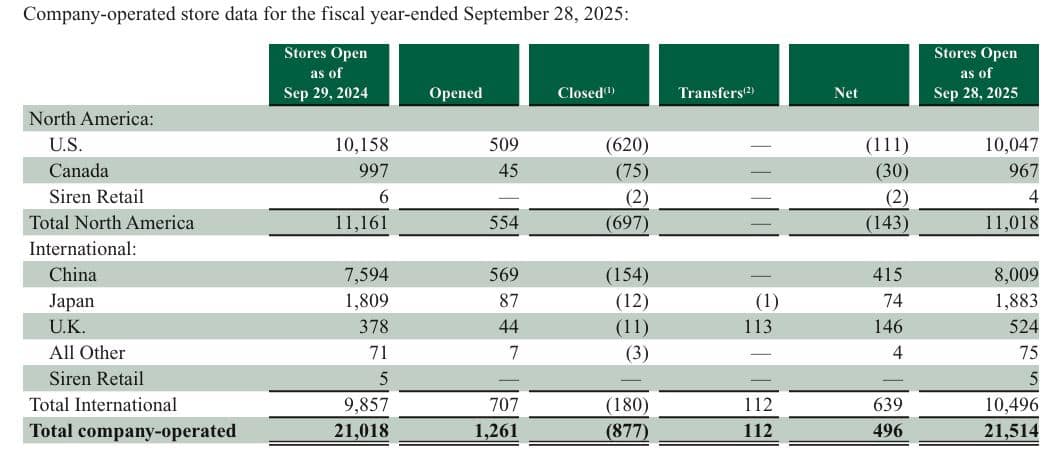
- Starbucks’ statistics indicate disciplined expansion and controlled growth, as reflected in its operational data. Starbucks maintained 21,018 company-operated locations worldwide as of September 29, 2024.
- The total number of stores increased to 21514 by September 28 2025, including 496 new stores that opened and 877 existing stores that closed, indicating that the company actively manages its store network rather than allowing it to grow uncontrollably.
- The U.S. experienced 509 new store openings and 620 existing stores closed, resulting in a net store loss of 111 and a store count of 10047. Canada experienced a similar trend, resulting in a net decrease of 30 stores.
- Starbucks considers China its second most critical growth market outside the U.S., as the country added 415 stores to reach 8,009 total locations.
- Japan and the U.K. both experienced substantial store expansions, which produced net increases of 74 and 146 stores, respectively.
Starbucks Retail Sales Mix By Product Type
(Source: q4cdn.com)
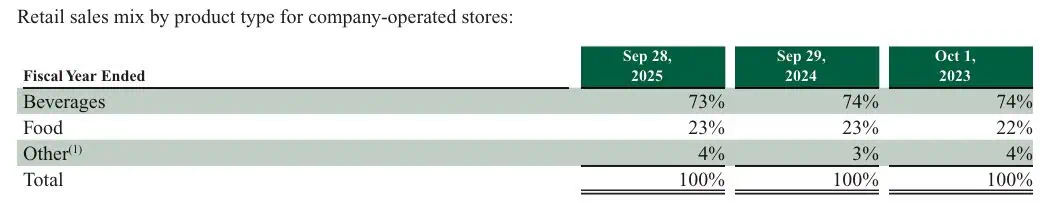
- The table demonstrates how Starbucks maintains consistent statistical performance throughout fiscal years 2023 to 2025.
- Beverages remain the economic backbone of the business, accounting for 73% of total revenue in fiscal 2025, only marginally down from 74% in 2023 and 2024. This stability enables Starbucks to maintain its pricing authority because customers continue to purchase its main espresso drinks and cold beverages despite inflation costs.
- Food sales account for 23% of revenue in both 2024 and 2025, up from 22% in 2023, as the company gradually expands its product line and increases customer purchase rates.
- The “Other” category, which comprises packaged products and ready-to-drink offerings, increased from 3% in 2024 to 4% in 2025, driven by modest growth in adjacent revenue streams.
(Source: q4cdn.com)
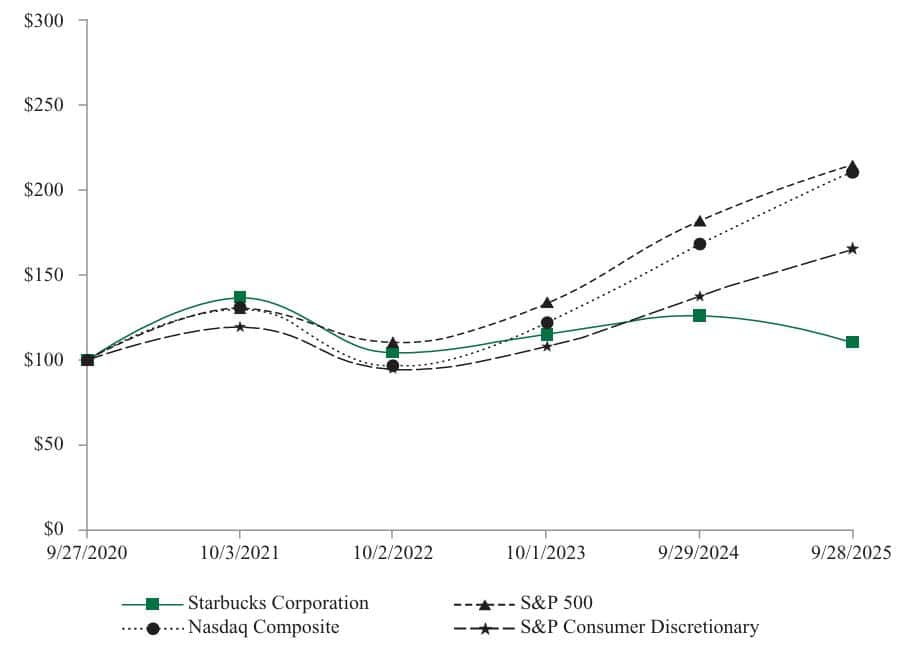
- The chart above shows that Starbucks shareholder returns diverged from general equity benchmarks over the five-year period.
- Starbucks total returns reached 110.47 in September 2025, after starting at 100 in September 2020, resulting in approximately 10% cumulative gains.
- The S&P 500 index increased to 214.30 during that period, resulting in a twofold increase in investors’ wealth, while the Nasdaq Composite index reached 210.64 through strong technology-driven growth.
- The S&P Consumer Discretionary Index outperformed Starbucks, reaching 165.21, indicating that it is a stronger competitor group for Starbucks.
- Starbucks demonstrates stable dividend payments and economic stability, yet its growth potential remains limited due to margin pressures, store efficiency challenges, and economic uncertainty.
Starbucks Total Revenue
(Source: q4cdn.com)
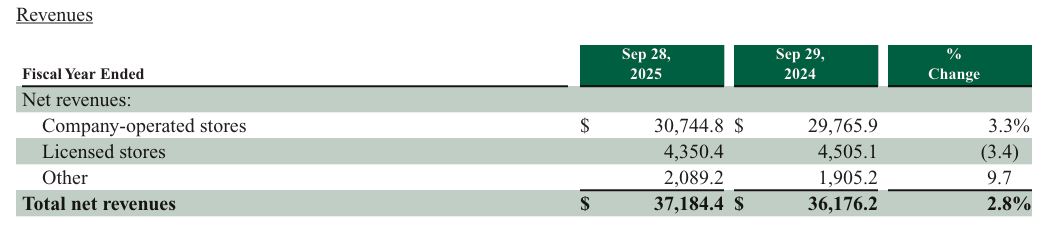
- The revenue data indicate that Starbucks maintains a relatively constant yet fluctuating revenue pattern across its global operations.
- Total net revenues for fiscal year 2025 reached USD 37.18 billion, a 2.8% increase from the previous year.
- The company’s main revenue growth comes from its company-operated stores, which generated USD 30.74 billion in revenue and grew 3.3% from the previous year.
- The business case for direct ownership demonstrates that it provides stronger control over pricing and generates additional revenue through increased customer traffic, a pattern observed consistently in Starbucks’s sales data.
- Licensed store revenue declined 3.4%, resulting in total earnings of USD 4.35 billion, indicating that partner-led activities failed to deliver expected results due to store mix changes in specific regions.
- The “Other” revenue stream increased by 9.7% to USD 2.09 billion, driven by growth in ready-to-drink beverage sales and additional brand product lines.
- Starbucks statistics indicate that the company relies on its company-operated stores to drive growth, while making controlled changes to its licensed business operations.
- The method enables operational flexibility, strengthening business resilience, while highlighting operational efficiency, which is a key factor in future margin growth.
Quality Of Starrucks Reviews
(Source: cafely.com)
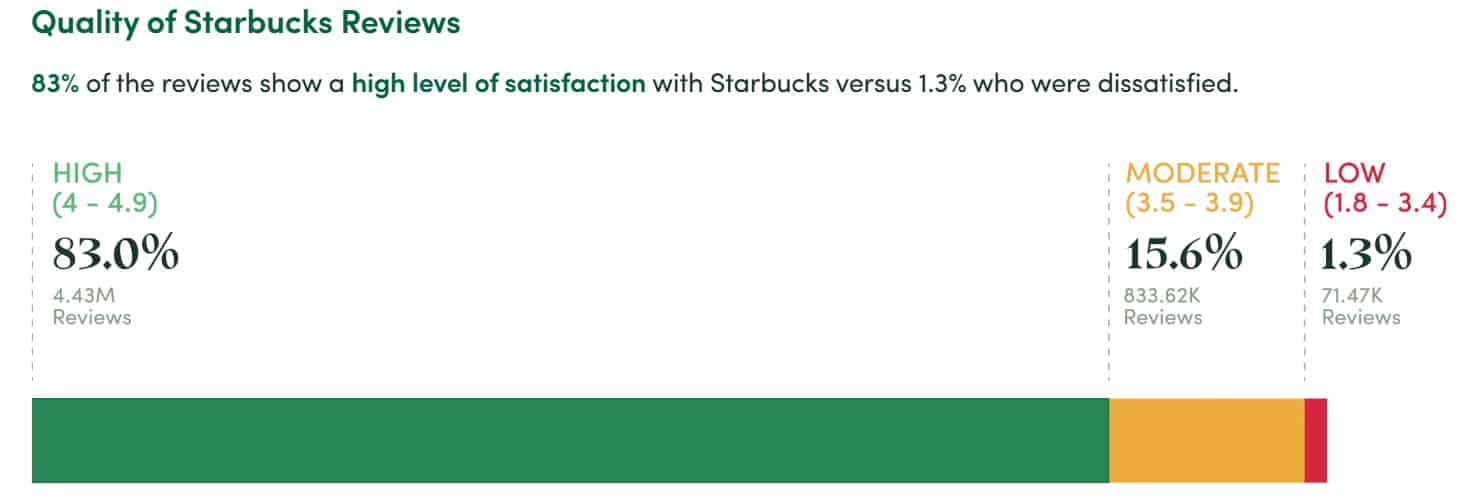
- The review data underscores the depth and reliability of customer feedback embedded within Starbucks statistics.
- Starbucks maintains a collection of 5.6 million reviews covering 16,475 U.S. stores, establishing one of the largest consumer sentiment datasets in the retail food sector.
- The evaluation process began with 16,355 stores, of which 120 were eliminated after regional analysis excluded locations with no reviews.
- The analysis found that a few stores achieved perfect five-star ratings, while another group of stores received the lowest rating of one star; however, these extreme cases occurred because review counts were low, which made them less useful for analysis.
- Improvements in statistical accuracy depend on combining dataset elements, which restricts the analysis to stores with 100 or more customer evaluations.
- The study acquired a substantial dataset comprising 11,549 locations, representing 70.2% of all U.S. Starbucks stores.
- The Starbucks statistics demonstrate a robust feedback system that enables frequent customer assessments to yield accurate results, owing to its high review volume.
- Starbucks achieves its competitive advantage through its extensive operational reach, which enables the business to collect essential customer data to assess store performance and service delivery across regions.
Starbucks Operating Expenses
(Source: q4cdn.com)
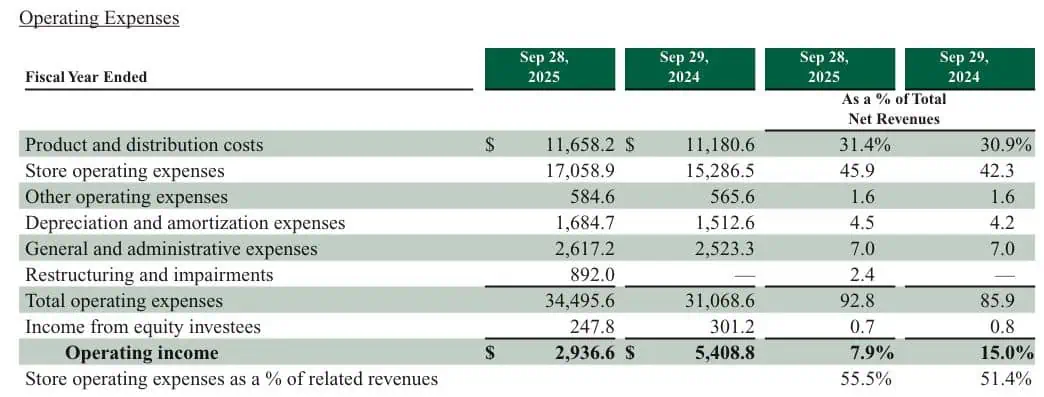
- The current expense analysis indicates that Starbucks experienced declining profit margins throughout the fiscal year.
- Total operating expenses for fiscal year 2025 reached USD 34.50 billion, representing 92.8% of total net revenues, compared with 85.9% in 2024.
- The product and distribution costs remained elevated at USD 11.66 billion, accounting for 31.4% of revenue, due to ongoing increases in input and logistics costs.
- The store operating expenses increased to USD 17.06 billion, which represented 45.9% of revenue, compared to 42.3% from the previous year, because of higher labor costs, wage increases, and increased operational requirements.
- The depreciation and amortization expenses reached USD 1.68 billion, while the general and administrative costs maintained a steady rate of 7.0% of revenue, which showed effective management of overhead expenses.
- Restructuring and impairment charges totalling USD 892 million in 2025 were a major financial factor because they did not exist in the previous year and significantly affected the company’s profitability. Operating income decreased to USD 2.94 billion, resulting in an operating margin that fell from 15.0% in 2024 to 7.9%.
Starbucks Inventories
(Source: q4cdn.com)
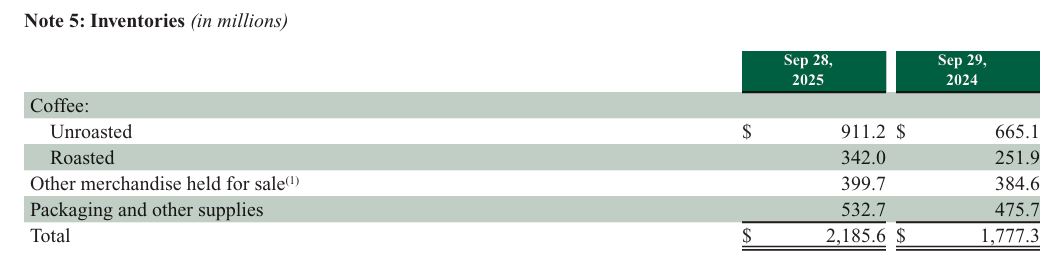
- The current inventory data indicate that Starbucks’ balance sheet commitments have grown across its entire business operations.
- The company reported total inventory levels of USD 2.19 billion for fiscal 2025, which represents a 23% increase from the previous year’s inventory total of USD 1.78 billion.
- The company increased its unroasted coffee inventory from USD 665.1 million to USD 911.2 million because it needed to source coffee during periods of price fluctuations.
- The company increased its roasted coffee inventory to USD 342.0 million, which represents a 36% increase that meets immediate requirements for store operations.
- Packaging and other supplies grew 12% to USD 532.7 million, consistent with store network scale.
- The inventory data from Starbucks indicates that the company carries out strategic inventory accumulation to safeguard its profit margins, which, however, creates additional working capital risk during periods of decreasing demand.
Starbucks Employee Benefit
(Source: q4cdn.com)
- Starbucks uses equity-based compensation as a fundamental element in its employee attraction and retention procedures, which the latest employee stock and benefit data reveal.
- The company maintains equity-based awards for future distribution through 74.5 million reserved shares and 9.1 million shares, which it allocated to its Employee Stock Purchase Plan as of September 28, 2025, to demonstrate its dedication to employee ownership.
- The Starbucks statistics indicate that dilution will continue to happen, yet they demonstrate a strong connection between employee performance and shareholder value creation.
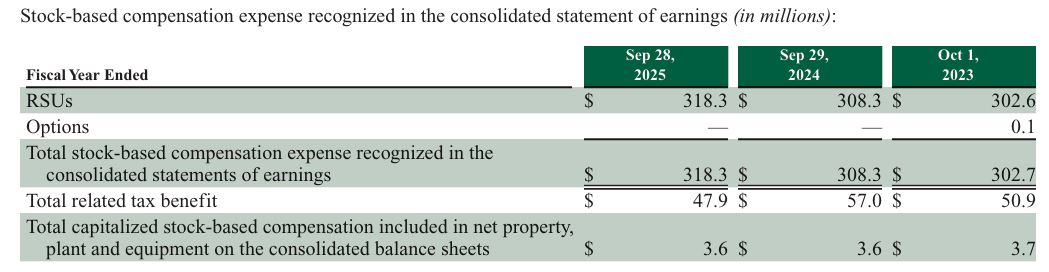
- The expenses related to stock-based compensation show consistent and steady growth throughout all operational periods.
- The company reported stock-based compensation expenses of USD 318.3 million for fiscal 2025, which represents a 3.2% increase from the previous year’s total of USD 308.3 million and a 5% increase from the 2023 fiscal year total.
- The primary component of restricted stock units now constitutes the incentive package, which focuses on maintaining employee retention instead of providing a substantial number of stock options.
- The related tax benefit declined to USD 47.9 million in 2025 from USD 57.0 million in 2024, indicating lower marginal tax efficiency despite higher expense recognition.
- The capitalized stock-based compensation costs maintained their constant value of USD 3.6 million, which showed the company used its resources to acquire long-lasting assets instead of raising its business expenses.
- The Starbucks statistics demonstrate that the company operates an established system that uses equity-based employee incentives to drive worker performance while maintaining financial openness and safeguarding shareholder interests in its worldwide business expansion.
Starbucks Credit Facility
- Starbucks enhances its capacity to manage financial resources through the introduction of a new credit facility.
- Starbucks upgraded its liquidity system through the transition from its 2021 credit facility to the new USD 3.0 billion unsecured five-year revolving credit facility, which an analyst identified as a major improvement.
- The 2025 credit facility, which has its term ending in June 2030, enables the company to extend its funding period while maintaining its capacity to choose between different financing options.
- Starbucks established a working capital reserve through its USD 150 million allocation for letters of credit and its ability to increase commitment limits by up to USD 1.0 billion, which will help the company handle operational expenses, invest in new assets and business growth, and stock buybacks.
- Starbucks maintains full control of its internal cash flow operations and debt management through its undrawn credit facility, which will remain inactive until September 28, 2025.
- The interest rates linked to Term SOFR combine with a credit-spread premium, which matches Moody’s and S&P ratings to demonstrate market trust in Starbucks’ creditworthiness.
- The Base Rate system, together with the 2% default premium,m offers lenders complete protection while enabling the borrower to operate without excessive limitations.
- The company successfully fulfilled all required fixed charge coverage obligations at the end of the year, which showed that it had the strong capability to pay back its debt obligations.
Starbucks Cash Flow
- The cash flow profile of Starbucks for fiscal year 2025 indicates that the company will use this year to adjust its operations instead of facing financial difficulties.
- The operating cash flow reached USD 4.7 billion, which represented a 23% decline from the previous year’s USD 6.1 billion due to a USD 1.9 billion reduction in net earnings.
- A USD 451.2 million increase in inventory occurred because of rising prices for both green coffee and roasted coffee products, which negatively impacted cash generation.
- The working capital situation at Starbucks shows that commodity market conditions, rather than a decline in consumer demand, caused the current financial difficulties.
- The company saw two opposing elements, which included a USD 713.2 million increase in loss from asset disposal and impairment charges that related to the “Back to Starbucks” restructuring plan and the growth in accounts payable, which resulted from alterations in payment schedules.
- The company spent USD 2.5 billion on investing activities, a slight decrease from its previous spending of USD 2.7 billion, due to a USD 472.0 million decrease in capital expenditures for North American store expansions and renovation projects.
- The company pursued a more cautious growth strategy, which showed selective development through its acquisition of 23.5 Degrees Topco Limited.
(Source: q4cdn.com)
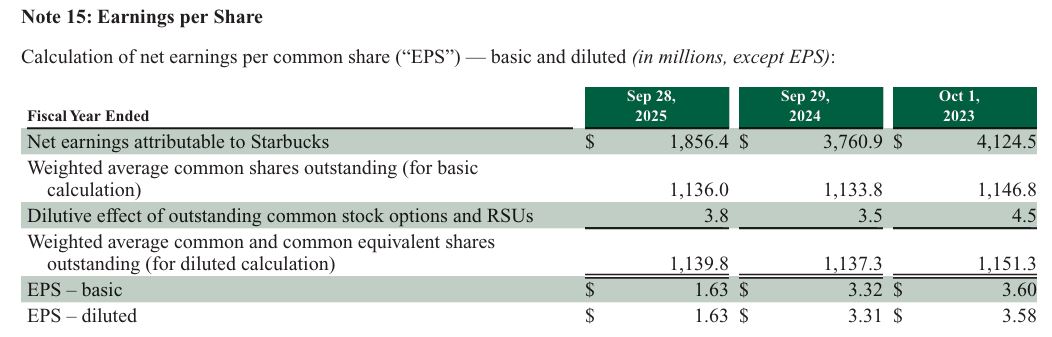
- Starbucks shows its fiscal 2025 earnings per share results because of its difficult business conditions and its current operational changes.
- Starbucks experienced a steep decline in net earnings, which dropped to USD 1.86 billion from USD 3.76 billion in fiscal 2024 and 55.0% below fiscal 2023 levels.
- The earnings drop resulted in lower shareholder returns, which saw basic EPS decrease to USD 1.63 from USD 3.32 a year earlier, while diluted EPS decreased to USD 1.63 from USD 3.31.
- Starbucks shows that its financial results show reduced profitability because of operational factors that caused costs to increase.
- The basic share count weighted average basic share count maintained its basic share count at 1.14 billion shares, which proved that EPS pressure occurred through earnings decline instead of equity inflation.
- The company showed controlled equity compensation through the dilutive effect of stock options and RSUs, which reached 3.8 million shares according to their customary pattern from past years.
- The diluted shares outstanding increase remained below 0.2% for the year, which shows that shareholders experienced minimal dilution.
Conclusion
Starbucks Statistics: Starbucks’s 2025 performance indicates that the company is undergoing operational changes rather than experiencing declining performance. The data indicate that the company has intentionally chosen to enhance its business quality through its current store expansion strategy, thereby enabling it to maintain financial stability during inflationary periods and achieve sustainable financial results. The Starbucks company reports stable revenue streams, which demonstrate market resilience despite lower earnings and shareholder returns compared to overall market performance.
The company established strategic investments in China while managing its inventory and employee incentive programs, which, together with liquidity buffers, demonstrate management practices that prioritize long-term business sustainability instead of pursuing immediate profits. The year 2025 serves as a reset point, which establishes the base for operational recovery, margin stabilization, and business expansion once economic pressures diminish.