Zillow Statistics By Revenue And Trends (2026)
Updated · Apr 11, 2026

Table of Contents
Introduction
Zillow Statistics: The real estate market experienced its most intense fluctuations during 2025 as the industry faced multiple recovery challenges. Meanwhile, companies changed their operational strategies, while statistical data produced unexpected results, which revealed the main business operations of Zillow Group. The year 2025 brought both business opportunities and operational difficulties through its combination of astonishing revenue results, home value prediction increases, and changes in consumer purchasing patterns.
The article analyzes vital Zillow statistics from 2025 that affect the overall United States housing market while presenting essential findings that researchers established through scientific studies and future-oriented research.
Editor’s Choice
- Zillow Group reported Q4 2025 revenue of USD 654 million, which showed an 18% annual growth rate because of strong sales growth.
- The total revenue for 2025 reached USD 2.58 billion, which represented a 16% increase from the previous year.
- The rental business experienced a 45% yearly revenue increase during Q4, reaching USD 168 million, which made it the fastest expanding business unit.
- The annual rental business revenue increased 39% to reach USD 630 million, which helped the company achieve better revenue stream diversification.
- The company achieved a 25% increase in adjusted EBITDA for the year, which reached USD 622 million, while its profit margins improved.
- The company reported 44% annual growth in adjusted net income in Q4, reaching USD 98 million.
- The diluted adjusted EPS rose to USD 1.64, which represents an increase from USD 1.38 in 1.38, the previous year.
- The company experienced 60% year-over-year growth in adjusted free cash flow in Q4, reaching USD 125 million.
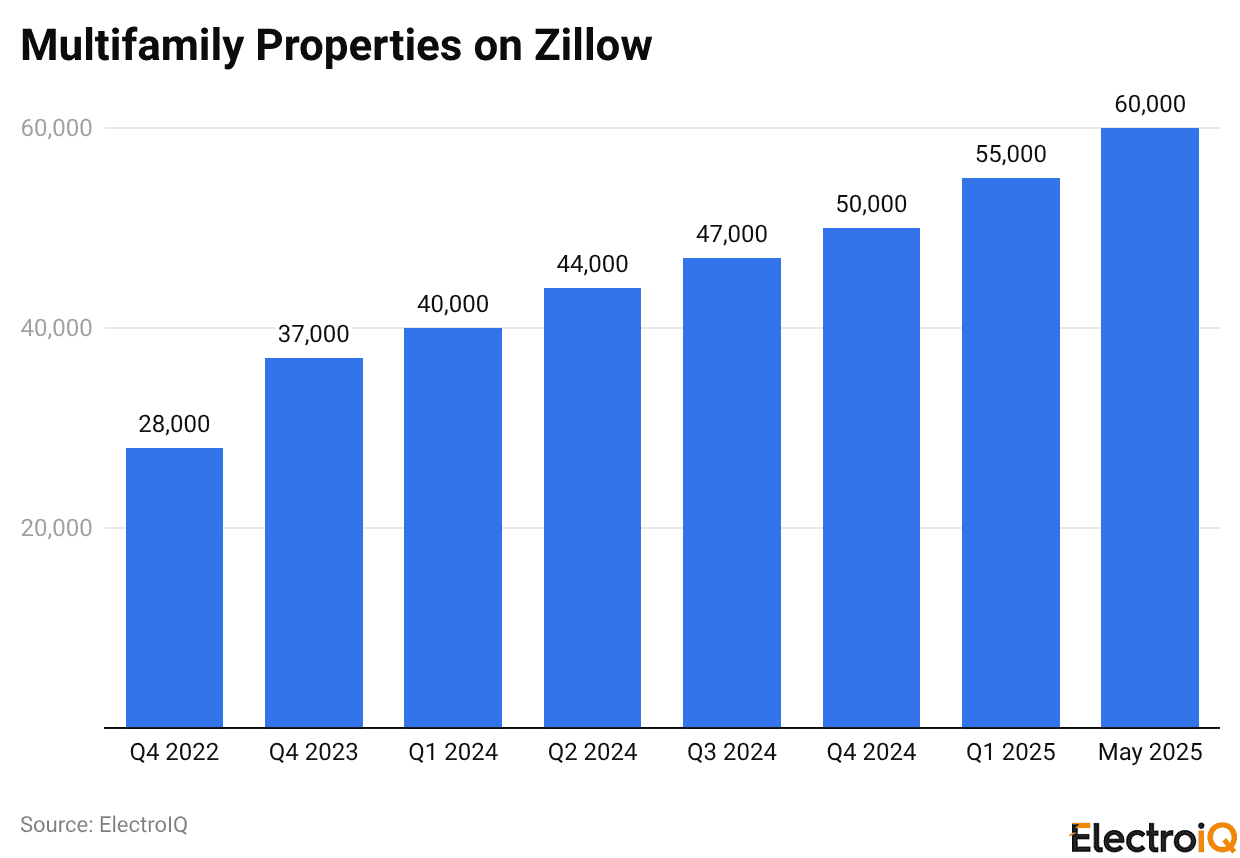
- Multifamily rental listings increased by 38% from the previous year, reaching 55, and then they reached 60,000, which occurred during early May.
- The average home price in the United States reaches USD 359,078, while monthly mortgage payments cost USD 1,749.
- The % age of listings that experienced price reductions in December decreased to 16.9%, which represents a decline from the 21.2% price reduction rate observed in November.
- Active listing numbers have grown by 8.9% compared to the previous year, yet inventory remains 17% lower than the levels that existed before the pandemic.
Zillow Total Revenue
(Source: zillow.com)
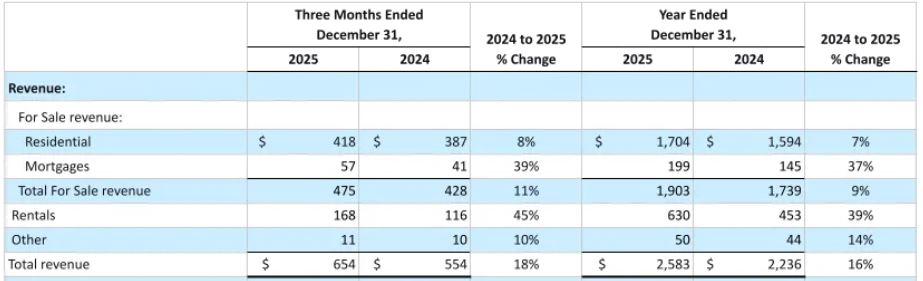
- The current quarter and annual results show increasing revenue growth because the company has multiple revenue sources.
- The total revenue for the three-month period, which ended on December 31, 2025, increased by 18% compared to the previous year, reaching 654 million dollars because rental revenue grew by 45% to 168 million dollars.
- The Residential revenue increased by 8 % to 418 million dollars, while Mortgage revenue experienced an outstanding 39 % growth, which demonstrated that financing demand had risen.
- The total revenue for the year reached 2.58 billion dollars because the company maintained its operational success from previous years.
- Rentals achieved exceptional results with a 39 % revenue increase, which brought in 630 million dollars for the company, while it continued to expand its share of total revenue.
- The Mortgage revenue grew by 37 % compared to the previous year, reaching 199 million dollars, because more people conducted business with the company.
- The Zillow statistics show that the company achieved balanced growth, which resulted in better revenue generation and strong growth across multiple business areas for its operations in 2026.
Zillow Adjusted EBITDA
(Source: zillow.com)
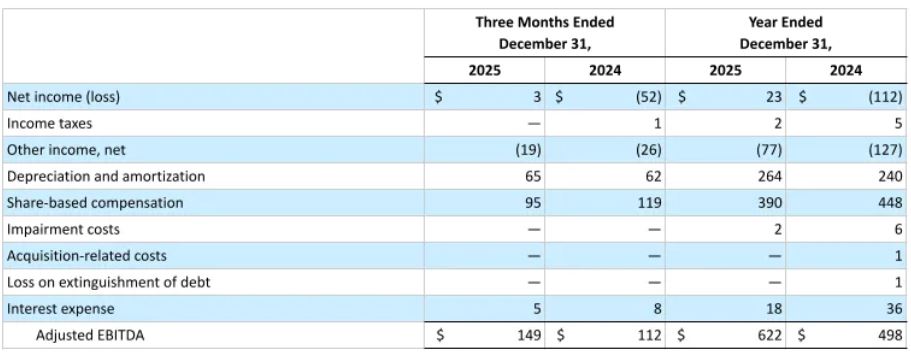
- The three-month Zillow report, which concluded on December 31 2025, achieved Adjusted EBITDA of USD 149 million, which represents a 33% increase from the USD 112 million earned during the previous year.
- The company achieved its first profitable quarter when net income reached USD 3 million after it experienced a USD 52 million loss during the previous year.
- The full-year Adjusted EBITDA for the company increased by 25% to reach USD 622 million, which surpasses the previous year’s total of USD 498 million.
- The annual depreciation and amortization expenses reached USD 264 million, while share-based compensation dropped to USD 390 million from its previous level of USD 448 million, which demonstrates improved control over expenses.
- The company improved its financial flexibility through a 50% reduction of interest expenses, which decreased from USD 36 million to USD 18 million.
- Zillow’s operating efficiency improvements, together with its capital discipline initiatives, have led to increased profit margins, according to these statistics.
- The Zillow statistics show that the platform has moved from the recovery phase to a state of improved profitability, which will persist until 2026.
Zillow Adjusted Net Income
(Source: zillow.com)
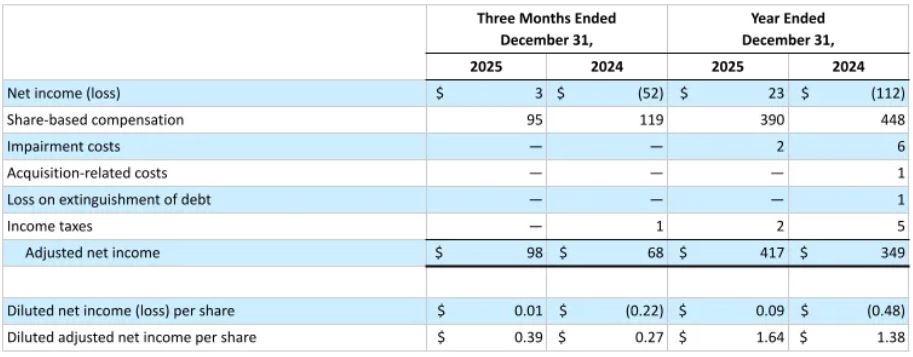
- The latest figures show clear progress, which results in better earnings quality and increased shareholder value generation.
- On December 31, 2025, the company achieved adjusted net income of USD 98 million, which represents a 44% increase from the USD 68 million net income that the company reported one year before.
- The company reported a net income of USD 3 million after experiencing a net income loss of USD 52 million during the fourth quarter of 2024, which marked a major change in their business profitability.
- The full-year period showed adjusted net income growth of 19% to reach USD 417 million, which compares to the previous year’s USD 349 million.
- The company reported diluted adjusted EPS of USD 1.64, which exceeds the previous value of USD 1.38 because of higher earnings per share performance.
- The company reduced its share-based compensation expenses from USD 448 million to USD 390 million, which resulted in better earnings visibility and improved management of company expenses.
- The Zillow data shows two things because it demonstrates that operational performance has improved while profit margins have returned to their normal levels.
Zillow Adjusted Free Cash Flow
(Source: zillow.com)
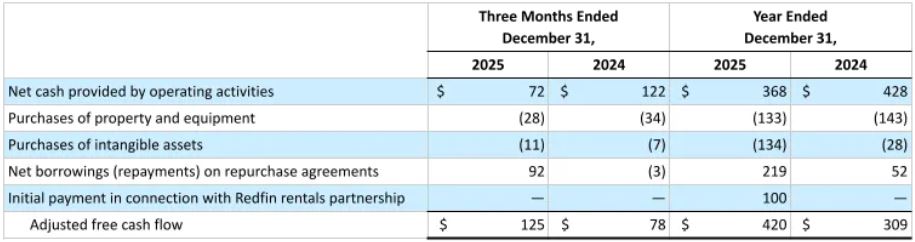
- The current cash flow profile shows two things about the financial operations of the company, which show better cash management practices and effective spending of financial resources.
- The period from October 2023 until December 2025 reported an adjusted free cash flow increase, which reached USD 125 million after increasing 60% from the previous year’s USD 78 million.
- It experienced cash growth because its operational cash flow decreased to USD 72 million from the previous year’s USD 122 million, yet its financing activities brought in USD 92 million of net borrowings.
- The company showed a 36% increase in adjusted free cash flow, which reached USD 420 million, compared to 2024.
- Generated operating cash flow of USD 368 million after spending on capital projects, which included USD 133 million for property and equipment and USD 134 million for intangible assets.
- The Redfin rentals partnership required a USD 100 million initial payment, which the company used as an investment for strategic growth.
- The Zillow performance metrics demonstrate increased cash operational efficiency and the ability to distribute financial resources across multiple growing business segments.
(Reference: seekingalpha.com)
- According to Seeking Alpha, the number of multifamily property listings increased by 38% compared to the previous year, which brought the total to 55000 listings during the first quarter, and the total further increased to 60000 listings by early May.
- The market experiences enhanced liquidity because of the rapid increase in supply, which helps property managers perceive greater value in their assets.
- The Zillow statistics demonstrate a typical flywheel effect because increased customer traffic leads to more property managers joining the platform, which results in greater inventory and better user interaction.
Zillow Market Heat and Rental Trends
- Market Heat Index currently displays a national housing market that provides equal advantages to both buyers and sellers because neither group maintains significant control.
- The distribution of climate zones shows a clear divide between different geographic areas.
- The San Jose, San Francisco, Hartford, New York, and Richmond areas represent the most active real estate markets because they show strong buyer interest while maintaining low property availability.
- In Milwaukee, Miami, Louisville, Indianapolis, and New Orleans, the market conditions provide advantages to buyers because the available inventory remains higher than average.
- December asking rents for rental properties decreased by 0.2% compared to the previous month, which brought the total below the pre-pandemic seasonal average of 0%.
- The rental prices show a 2.1% increase compared to the previous year, which displays the resilience of the base prices.
- In 34 major metropolitan areas, rents decreased during the month, with Denver and Salt Lake City experiencing the highest decline at 0.8%.
- San Francisco experienced the highest annual rent increase among the 50 largest metropolitan areas, with a 5.7% rise.
- The Zillow statistics show that the rental market shows signs of declining activity, yet it remains stable because different regions experience varying market conditions.
Zillow Sales Activity Trends
- The December housing activity shows a slow decline, which differs from an abrupt market drop.
- Price reductions affected 16.9% of listings, down from 21.2% in November and slightly below 17.1% recorded in December 2024.
- The sequential improvement shows that sellers are adjusting their market expectations more efficiently because the market is becoming stable.
- In November, 24% of homes sold at prices above their list price, which represented a slight decrease from 24.6% in October but showed a significant drop from 26.9% during the same month last year.
- The bidding activity has decreased because fewer people now participate in bidding wars, but approximately 25% of homes continue to sell above their asking price, which shows that people still want to buy homes.
- December experienced a 20.2% decrease in newly pending sales compared to November because both seasonal patterns and buyer purchasing power restrictions brought about this decline.
- The company reported a 1.9% increase in sales compared to the previous year, which showed that buyer interest had remained constant throughout the period.
- The median days to pending reached 43 days because it increased by 10 days from the previous month and six days from the previous year, which indicates that people now take longer to make decisions.
- The Zillow Research indicates a market shift, which shows that buyers still search for properties, but their demand has weakened.
- The market now demonstrates improved pricing discipline while transaction speeds return to pre-pandemic standards.
Zillow Inventory and Listing Trends
- According to Zillow Research december data show that housing supply remains constrained but shows signs of stabilization.
- New listings experienced a month-to-month decrease of 27.6%, which represents a standard seasonal decline and a 2.3% drop from the previous year.
- More notably, new listings remain 14.1% below pre-pandemic norms, which indicates that seller participation has yet to fully normalize in a higher-rate environment.
- December inventory experienced a total decline of 11.5%, which resulted in active listings showing an 8.9% increase when compared to the previous year. This pattern indicates that supply conditions show a gradual increase between the current year and the previous year.
- The overall inventory currently exists at 17% below pre-pandemic levels, which demonstrates ongoing structural inventory shortages.
- The overall Zillow statistics show that inventory constraints have become a main characteristic of the market, which creates limitations on price decreases while slowing down price growth.
Zillow Value Trends
- The December home value data shows that home values have stabilized throughout the country, although some areas experience market corrections.
- The typical U.S. home value stands at USD 359,078, while the estimated monthly mortgage payment (20% down) is USD 1,749 — down 5.2% year over year but still nearly 98.8% higher than pre-pandemic levels.
- The 50 largest metro areas did not show any price increases during the monthly evaluation period. The value of San Francisco and New York remained unchanged, while San Diego, San Jose and Los Angeles experienced minor declines of 0.1%.
- The most significant declines occurred in Buffalo and Pittsburgh, with both cities experiencing a 0.8% decrease.
- The market divides into two equal parts for annual performance, with 25 metros showing growth led by Hartford 4.8% and Milwaukee 4.7% while 25 areas experienced declines that included a 6% drop in Austin.
- The current Zillow statistics show a market cycle that is changing because of affordability problems, regional market adjustments, and standard pricing trends.
Zillow Group Ecosystem Overview
- Zillow Group uses multiple brands to create network effects, which helps the company reach more audiences across different real estate markets.
- Trulia, once its fiercest rival, now operates as the third-most visited online real estate brand with 9.8 million average monthly users, reinforcing traffic aggregation advantages.
- HotPads brings 2.13 million unique visitors each month while StreetEasy controls the New York City real estate market.
- The Out East platform, which focuses on luxury properties, enables the brand to attract additional customer segments.
- B2B monetization receives enhancement through professional solutions, which include Bridge Interactiv, eShowingTime+ Spruce, and Follow Up Boss.
- The Zillow statistics demonstrate three main strategic areas, which include platform consolidation and multiple brand monetization capabilities.
Conclusion
Zillow statistics in 2025 show a significant year that united financial strength with increased user engagement and detailed housing market development patterns. The company shows its brand strength through record revenue growth, which exceeds USD 2.6 billion, and its expanding mortgage and rental offerings, together with its high user activity levels. The U.S. housing market shows signs of cooling off because home values have stopped rising, and prices have changed across the market.
Zillow will show moderate growth in its forecasts while the company serves as a critical resource that helps people understand past real estate trends and upcoming market developments. In 2025, Zillow functioned as a data provider that established market narratives that affected decision-making for millions while showing the most complete depiction of a housing market that was going through change.
Sources
FAQ.
Zillow generated total revenue of USD 2.58 billion in 2025, which represented a 16% increase from the previous year.
The full year Adjusted EBITDA reached USD 622 million, which showed a 25% increase from the previous year.
The company achieved profitability in the fourth quarter with net income reaching USD 3 million, which marked a recovery from its 2024 losses.
The typical U.S. home value is USD 359078.
The estimated monthly mortgage payment is USD 1,749 with 20% down.
The current inventory level stands 17% below pre-pandemic levels, although there have been recent annual inventory increases.

I hold an MBA in Finance and Marketing, bringing a unique blend of business acumen and creative communication skills. With experience as a content in crafting statistical and research-backed content across multiple domains, including education, technology, product reviews, and company website analytics, I specialize in producing engaging, informative, and SEO-optimized content tailored to diverse audiences. My work bridges technical accuracy with compelling storytelling, helping brands educate, inform, and connect with their target markets.