Tata Motors Statistics By Insights And Market Trends (2026)
Updated · Apr 09, 2026

Table of Contents
Introduction
Tata Motors Statistics: Tata Motors has established itself as a major force that maintains worldwide operations by manufacturing passenger cars, commercial vehicles, and luxury vehicles through its Jaguar Land Rover division. The company experienced two years of mixed performance from 2025 to 2026 because of macroeconomic challenges, supply chain interruptions, and changing EV market requirements. The company’s operational strength showed through its record revenue and high cash flow performance in FY 2025.
The company experienced two challenges during FY 2026 because its sales volume showed unpredictable changes, and its profit margins decreased. Tata Motors operates during a crucial period of transformation, which combines its growing electric vehicle investments with the recovery of domestic market demand.
Editor’s Choice
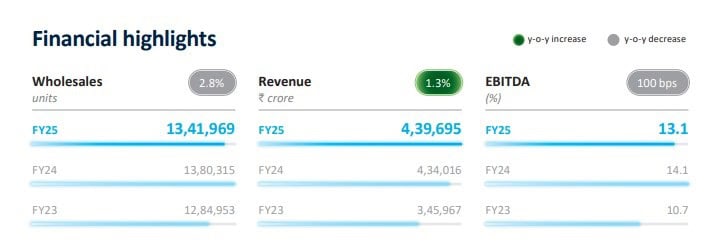
- Tata Motors’ FY2025 wholesale volumes stood at 1.34 million units, which represented a 2.8% increase when compared to the previous year.
- Revenue reached ₹4.39 lakh crore, which represented a 1.3% increase from the previous year and a 27% increase from the previous fiscal year.
- The EBITDA margin decreased to 13.1%, which corresponds to a 100 bps reduction from its previous value of 14.1%.
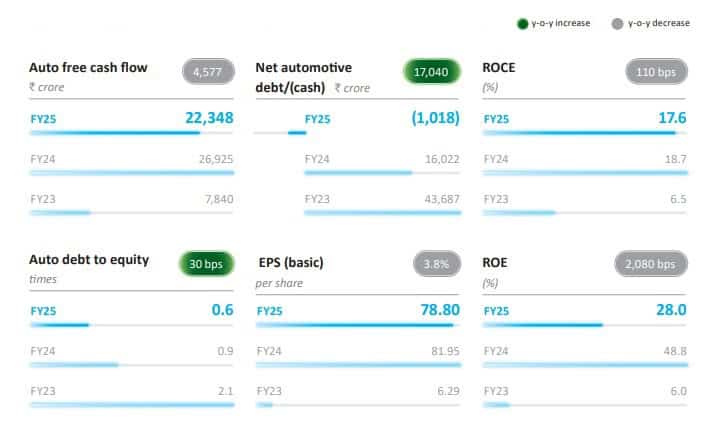
- Auto free cash flow of ₹22,348 crore, even though it experienced a 17% decline in revenue compared to the previous year.
- The company achieved a net cash position of ₹1,018 crore after reducing its automotive net debt from ₹16,022 crore in FY 2024.
- ROCE of 17.6%, which represents a significant increase compared to its 6.5% performance in FY 2023.
- ROE declined to 28%, which represents a return to standard levels after reaching 48.8%.
- The debt-to-equity ratio improved sharply to 0.6x from 2.1x in FY2023.
- The EPS maintained a strong performance at ₹78.80, which exceeded the previous year’s value of ₹6.29.
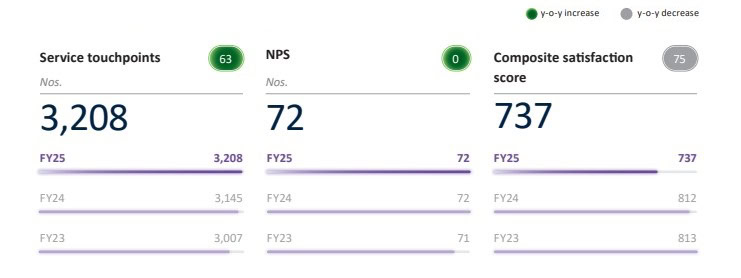
- The service network added 3,208 touchpoints, which represented a 2% YoY increase.
- NPS remained stable at 72, while the satisfaction score dropped 9% to 737.
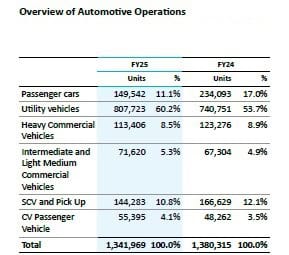
- Utility Vehicles dominated with 807,723 units, which gave them 60.2% market share that increased by 8.9% from the previous year.
- Passenger Vehicles experienced a 36% YoY decline, which resulted in a total of 149,542 units sold.
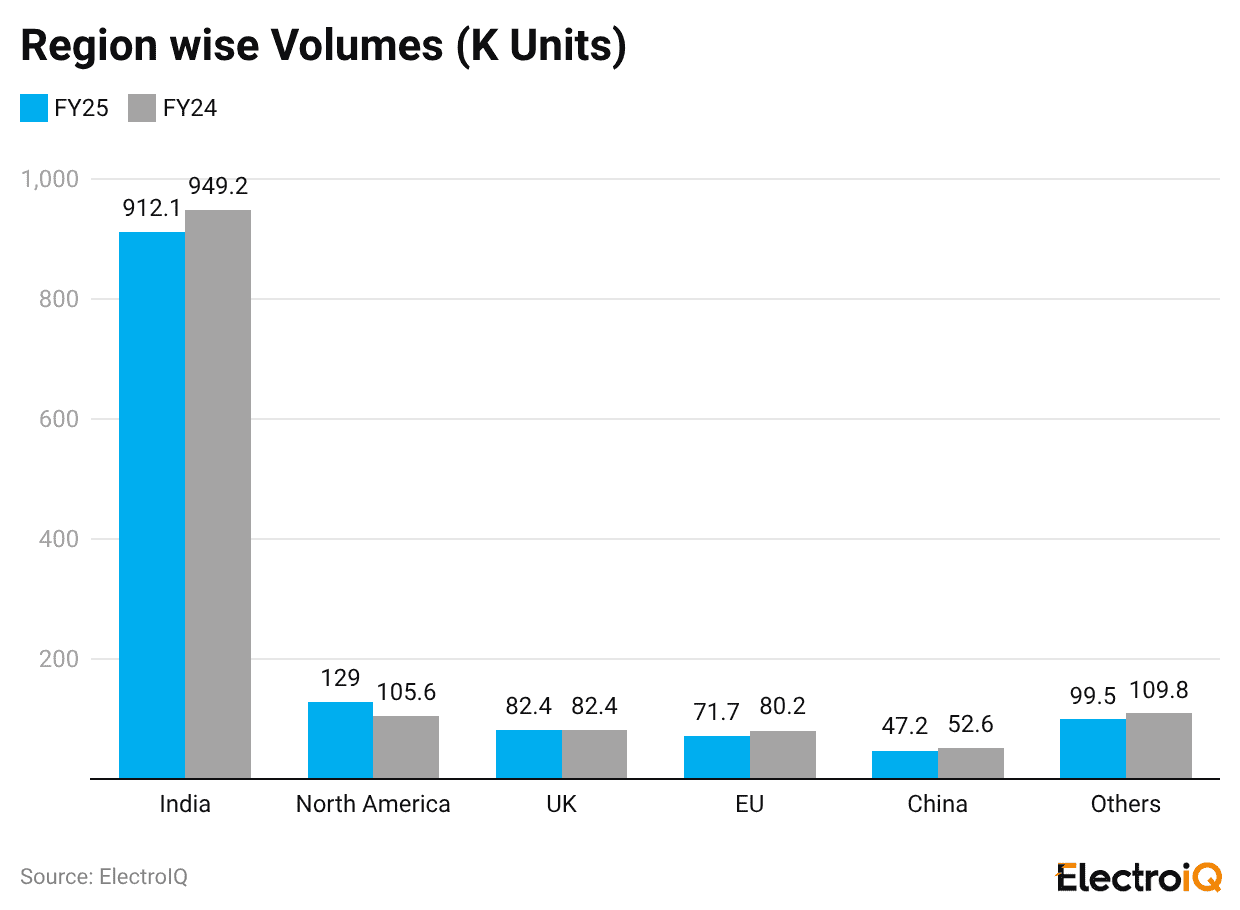
- India contributed 912.1k units (~68% share), despite a 3.9% YoY decline.
- EV leadership continued with 77,658 units and 39.2% market share in FY2026, though down from >80% early-mover peak.
Tata Motors FY2025 Performance
(Source: tatamotors.com)
- The performance of Tata Motors for FY2025 shows balanced growth because its revenue increases with steady volume growth while its profit margins return to normal levels.
- Wholesale volumes reached 1.34 million units (13,41,969) in FY2025, marking a 2.8% year-on-year increase compared to 1.38 million units in FY2024.
- The two-year period shows a 4.4% volume increase from FY2023, when the company sold 1.28 million units because both passenger and commercial vehicle markets maintained steady demand.
- The company reported financial results, which showed revenue growth to ₹4.39 lakh crore after reaching ₹4.34 lakh crore in FY2024.
- The current value shows a 27% increase from the previous year, when the company generated ₹3.45 lakh crore in revenue because the company expanded its business operations while enhancing its product offerings and pricing methods.
- The company achieves revenue growth through three main factors: increased SUV demand, its expanding electric vehicle collection, and enhanced sales of luxury automobiles.
- EBITDA margin dropped to 13.1% during FY2025 after it reached 14.1% in FY2024, although it showed considerable improvement from 10.7% during FY2023.
- The 100 basis point contraction indicates that the company faces increasing costs for raw materials while dealing with pricing pressures from its competitors and making additional expenditures for its electric vehicle production and technological advancements.
- Tata Motors uses margin compression to enter a new stage, which will bring them to achieve their long-term growth goals by sacrificing short-term profit margins.
(Source: tatamotors.com)
- The financial results of Tata Motors for FY2025 demonstrate an outstanding balance sheet improvement, which occurred because of strong cash flow performance, active debt reduction efforts, and better capital management practices, even though the company experienced decreased financial returns.
- The company reported auto free cash flow (FCF) of ₹22,348 crore, which represents a 17% decrease from the previous year’s amount of ₹26,925 crore, while showing a 185% increase from the previous year’s amount of ₹7,840 crore.
- The ongoing cash flow generation allows Tata Motors to finance its electric vehicle projects, capital expenditures, and debt repayment activities, which serve as essential components for achieving sustainable long-term growth.
- The main achievement shows the substantial reduction of net automotive debt, which converted into a net cash position of ₹1,018 crore during FY2025 after the company held a debt load of ₹16,022 crore in FY2024 and ₹43,687 crore in FY2023.
- The successful execution of the deleveraging strategy leads to a complete financial turnaround, which decreases financial risk while building balance sheet durability that benefits investor confidence.
- The Return on Capital Employed (ROCE) reached 17.6% for the current period, which represents a decrease from 18.7% in FY2024 but an improvement from 6.5% in FY2023 because better capital utilization and operational efficiency improvements.
- The Return on Equity (ROE) decreased to 28.0% from its previous 48.8% rate, which shows a return to standard business operations after an outstanding year, yet the company continues to provide substantial value to its shareholders.
- The debt-to-equity ratio, which serves as a leverage indicator, improved because it decreased to 0.6x, which compares to 0.9x in FY2024 and 2.1x in FY2023, thus demonstrating the company’s effective financial control and its reduced need for outside financing.
- The company’s earnings per share (EPS) reached ₹78.80, which represents a minor decrease from ₹81.95, but it exceeds the previous year’s EPS of ₹6.29, which demonstrates the company’s medium-term capacity for profitability growth.
- Tata Motors’ FY2025 performance signals a transition to a financially strong and self-sustaining business model, positioning it well for future growth, EV expansion, and shareholder value creation.
Tata Motors FY2025 Customer Experience Metrics
(Source: tatamotors.com)
- Tata Motors’ fiscal data from 2025 shows customer experience results that demonstrate service network growth and customer loyalty maintenance, yet customer satisfaction results show some decline.
- The company operates 3,208 service touchpoints after increasing its locations from 3,145 during FY2024 and 3,007 during FY2023, which represents a 7 % growth across two years.
- Tata Motors maintains its commitment to growing after-sales service operations because it wants to make products available to customers and serve rural markets, which helps the company gain customer trust in India’s automotive industry.
- The Net Promoter Score (NPS) for customer loyalty maintained its steady level at 72, which matched the score from FY2024 and showed a 1 point increase from the 71 score in FY2023. This consistency demonstrates that customers actively support the brand while they maintain high satisfaction, which helps Tata Motors establish competitive customer loyalty standards.
- The composite satisfaction score decreased to 737, which represents a decrease from 812 in FY2024 and 813 in FY2023 and shows that customer service improvements have not yet achieved their desired effect.
- The decline indicates that the organization faces difficulties with its service delivery, customer service response time, and ability to meet customer needs as its network grows.
Tata Motors Technology and Innovation 2025
- Tata Motors has shifted its core business operations toward developing its electric vehicle products through its utilization of advanced artificial intelligence systems, its development of connected vehicle systems, and its application of data analytics technologies.
- A standout development is the deployment of Generative AI solutions across customer touchpoints.
- The AI system of the company produced more than 22000 unique email replies, which were sent to customers.
- Tata Motors achieved a 97% improvement in response time, slashing latency from 3 hours to under 5 minutes.
- The digital transformation process of the organization benefits from these two elements because they enhance customer satisfaction while increasing operational productivity, which ensures that the company follows its established policies and operational procedures.
- The operational enhancements that occur in business operations serve to strengthen this strategic approach.
- The automotive company achieved a 25% decrease in service station return visits while experiencing a 15% reduction in customer complaints for every 1000 vehicles, which demonstrated better service performance and increased customer loyalty and brand value protection, which automotive brands require to succeed in the industry.
- The C75 drive cycle, which uses 4 billion kilometres of actual electric vehicle driving data, enables better range prediction results, which solve range anxiety problems that hinder electric vehicle adoption.
- The Curvv electric vehicle model and its other electric vehicle models achieve better market value through this feature because it boosts customer trust in electric vehicle transportation.
- The AI-enabled geo-spatial analytics model helped the fast-charging network coverage expand by 10% year-over-year, while 85% of national highways and 73% of state highways now have charging stations located within 50 kilometres of each other, and metro areas maintain a charging station density of one station for every 5-7 kilometres.
- The company has developed its logistics operations through mobile-based Proof of Delivery systems, which it has implemented at more than 400 dealerships to create better visibility and track shipments in real time while enhancing their operational capabilities.
- Tata Motors has established a comprehensive connected mobility system, which includes predictive maintenance, OTA updates, and customized services after reaching 1 million linked commercial vehicles.
Tata Motors FY25 Sales By Segment
(Source: tatamotors.com)
- Tata Motors’ FY25 sales mix shows substantial changes in its product range because utility vehicles experienced strong growth while commercial vehicle demand patterns continued to evolve.
- The total number of units reached 1,341,969, which represents a slight decrease of 2.8% from the previous fiscal year total of 1,380,315 units, and this indicates a period of transition instead of a complete business decline.
- The Passenger Vehicles (PV) segment experienced a significant downturn as its sales dropped from 234,093 units (17.0% share) in FY24 to 149,542 units (11.1%) in FY25, which delivered a complete 36% yearly sales drop.
- Utility Vehicles (UVs) function as the primary driver of market growth, which lets them achieve market dominance through a total of 807,723 units.
- The company achieved 8.9% annual growth, which supports its new business strategy to focus on SUVs and lifestyle vehicles, which represent one of the most important search terms in the car industry today.
- Heavy Commercial Vehicles (HCVs) experienced an 8% declin,e which appears as a yearly decrease, while SCV and Pickups experienced a 13.4% dro,p which shows that demand decreased in both logistics and infrastructure industries.
- The market for Intermediate and Light Medium Commercial Vehicles (ILMCVs) expanded through 6.4% YoY because last-mile and regional transport demand showed stability.
- The CV Passenger Vehicles market experienced a 14.8% increas,e which demonstrates that people have resumed using mobility services and public transportation again.
- The increasing concentration in UVs (over 60% contribution) indicates portfolio consolidation, while declining PV share signals segmental imbalance.
- Tata Motors’ FY25 performance underscores a strategic realignment toward high-growth segments, with utility vehicles driving volume stability.
- The company needs to restore its balance between passenger vehicles and commercial vehicles because this operational approach exposes it to diversification risks, which will impact its ability to achieve long-term growth.
Tata Motors FY25 Regional Sales
(Source: tatamotors.com)
- The Tata Motors company showed its regional volume performance for fiscal year 2025 to demonstrate how worldwide demand patterns operate because it showed both market growth in core regions and partial market declines in certain international locations.
- The total volume shows a slight decrease through Indian market operations, which produced 912.1k units but fell short of the 949.2k units from fiscal year 202,4 which represents a 3.9% decrease from the previous year.
- India retains its leading market share,e which sustains its role as the primary engine driving company growth.
- North America experienced a substantial volume decrease, which dropped from 129.0k units to 105.6k units.
- The market experienced a total 18.1% decline through this period, which shows either demand normalization or the impact of economic challenges.
- The UK market maintained a steady state at 82.4k units, which showed no market growth but sustained strong performance throughout its established market.
- The European Union (EU) region experienced a total volume drop of 11.3% year over year, which resulted in 71.7k units, while China saw a more severe market downturn through a 10.3% decrease to 47.2k units.
- The market conditions show greater competition from both international markets and local demand obstacles.
- The “Others” segment developed into a successful business segment through its 10.4% annual growth, which reached 109.8k units. The business successfully built new markets while it developed its presence in new countries.
- The geographic concentration ratio shows high levels throughout India, which delivers more than 68% of the total volume output.
- The company operates through its domestic business operations, while Tata Motors requires international market equilibrium and diverse market development to grow its business.
|
India passenger EV market structure (late 2025–FY2026) |
Tata. EV | JSW MG Motor India | Mahindra Electric |
| FY2026 EV sales (units)autocarindia+1 | 77,658 | 52,408 |
42,006 |
|
FY2026 EV market share (%)autocarindia+1 |
39.2 | 26.4 | 21.2 |
| Late‑2025 EV market share (%) | 39.7 | 25.1 |
22.1 |
|
Peak/early EV share reference |
>80% at early‑mover peakevindia+1 | ~26–35% of EV market by 2024–25 | 7.8% in FY2025 |
| FY2026 YoY EV volume growth | ~50% growth in Q3 FY26 | ~74% YoY growth |
~5x YoY growth, +172% share jump |
|
Positioning |
Broad ladder from entry to premium EVs | Urban crossovers, ecosystem‑heavy EV play |
SUV‑centric “Born Electric” portfolio |
Conclusion
Tata Motors, through its performance assessment from FY2025 to FY2026, displays its current stage of organizational transformation, which requires it to maintain its financial capacity while adapting to changing market conditions. The company displays financial stability through its significant revenue increase and strong cash generation, while its net cash transition demonstrates its financial strength and careful management of capital resources. The company faces immediate challenges because its margins have decreased, its passenger vehicle sales have dropped, and its regional markets show fluctuating demand patterns.
The company maintains its strategic direction by focusing on high-growth market segments, which include its expanding utility vehicle business and its dominant position in India’s electric vehicle market. The demerger enhances both operational efficiency and valuation assessment through improved organizational structure. Tata Motors currently holds a strong growth position for future development because of its focus on electrification and premium product offerings, and its dominance in the domestic market.
Sources
FAQ.
Tata Motors reported ₹4.39 lakh crore revenue, growing 1.3% YoY.
The company achieved a net cash position of ₹1,018 crore after reducing its previous debt obligations.
Utility Vehicles (UVs) lead growth with 60.2% share and 8.9% YoY increase.
The company holds approximately 39.2% of the electric vehicle market share in India during the fiscal year 2026.
The company experienced margin reduction because of increased production expenses, decreased customer demand and its investments in electric vehicles.

I hold an MBA in Finance and Marketing, bringing a unique blend of business acumen and creative communication skills. With experience as a content in crafting statistical and research-backed content across multiple domains, including education, technology, product reviews, and company website analytics, I specialize in producing engaging, informative, and SEO-optimized content tailored to diverse audiences. My work bridges technical accuracy with compelling storytelling, helping brands educate, inform, and connect with their target markets.