App Store Revenue Statistics By Market Size, Insight and Facts (2026)
Updated · Dec 22, 2025

Table of Contents
- Introduction
- Editor’s Choice
- Global App Store Revenue Statistics
- App Store Statistics By Currently Available Apps
- Number of Paid Apps by Cost Statistics, 2025
- App Stores Distribution Analyses By Category, 2025
- App Store Statistics By App Ratings
- Mobile App Downloads Statistics By Stores
- App Store Statistics By Top Global Downloads
- Mobile App Downloads Statistics By Category
- Fastest Apps To Reach One Billion Downloads
- App Store Marketing Statistics
- Top 10 Apps Of Google Play And iOS App Store (2025)
- Conclusion
Introduction
App Store Revenue Statistics: Today, app stores play a big role in our digital lives. They shape how we find, download, and use apps every day. App store statistics indicate what people prefer on their phones, such as games, social media, banking, health, and learning apps. By examining downloads, earnings, time spent, and reviews, we can see which app types are winning, how quickly the market is growing, and where new opportunities are appearing. This information helps developers, marketers, investors, and brands develop more effective mobile plans.
This article includes several statistical analyses from different insights that examine key app store metrics, explain the main trends behind them, and discuss their implications for the future of mobile apps. These insights can guide better decisions for everyone.
Editor’s Choice
- The global app store revenue is projected to reach USD 270 billion by 2025.
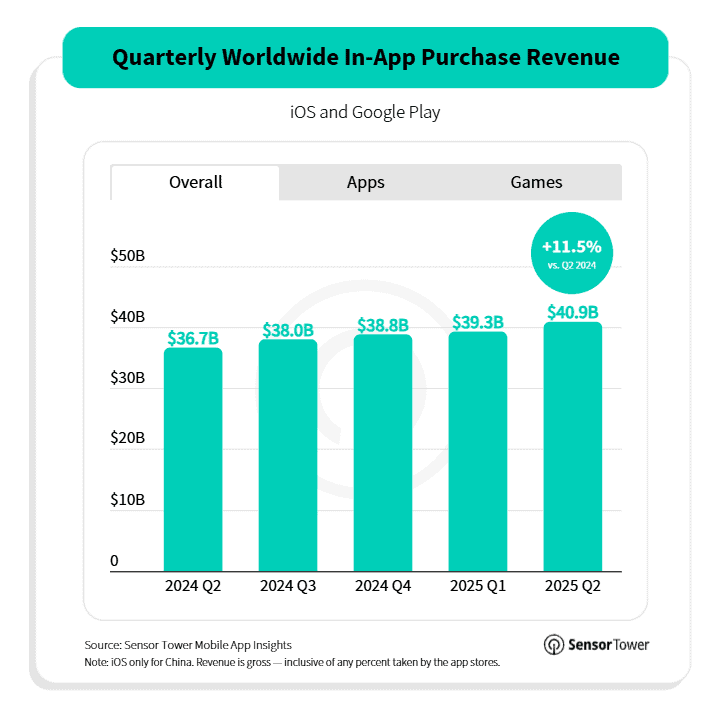
- Global in-app purchase revenue on iOS and Google Play reached USD 39.3 billion in the first quarter of 2025 and USD 40.9 billion in Q2.
- In 2025, games generated the highest revenue on the App Store, resulting in USD 82 billion.
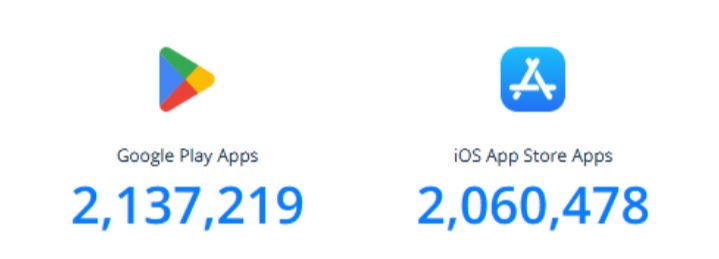
- Google Play had 2,137,219 apps, and the Apple App Store had 2,060,478 apps on 11th December 2025.
- As of 2025, Google Play released approximately 1.7K new apps per day, whereas the iOS App Store with 2K new apps per day.
- The distribution of apps by rating shows that Google Play has 1,050,202 rated apps, representing 49.14% of its catalogue, while the App Store has 852,069 rated apps, accounting for 41.35% of its total.
- By 2025, the App Store will have reached 37 billion downloads, and Google Play will have reached 136 billion.
- ChatGPT reached one billion downloads the quickest, in only 27 months.
- As of October 2025, Instagram led worldwide with 52 million downloads from both the Android and Apple App Stores.
- In 2024, the global app store ecosystem generated USD 1.3 trillion in developer billings and sales.
Global App Store Revenue Statistics
- According to sqmagazine.co.uk, global app store revenue is projected to reach USD 270 billion by 2025, with Apple accounting for 51% of that amount.
- Most revenue on the App Store comes from in-app purchases, which account for 72% of total revenue.
- Non-gaming apps are growing faster and should generate approximately USD 56 billion, compared with gaming’s USD 82 billion on iOS.
- AR and VR apps are projected to grow by 38%, driven by devices such as the Apple Vision Pro.
- The app store has more than 185 languages, used globally.
- Spending in the U.S. will reach USD 43 billion, followed by Europe (USD 22.5 billion), Brazil (USD 1.9 billion), and India (USD 2.7 billion).
- Meanwhile, developer payouts may pass USD 80 billion.
(Reference: eltima.com)
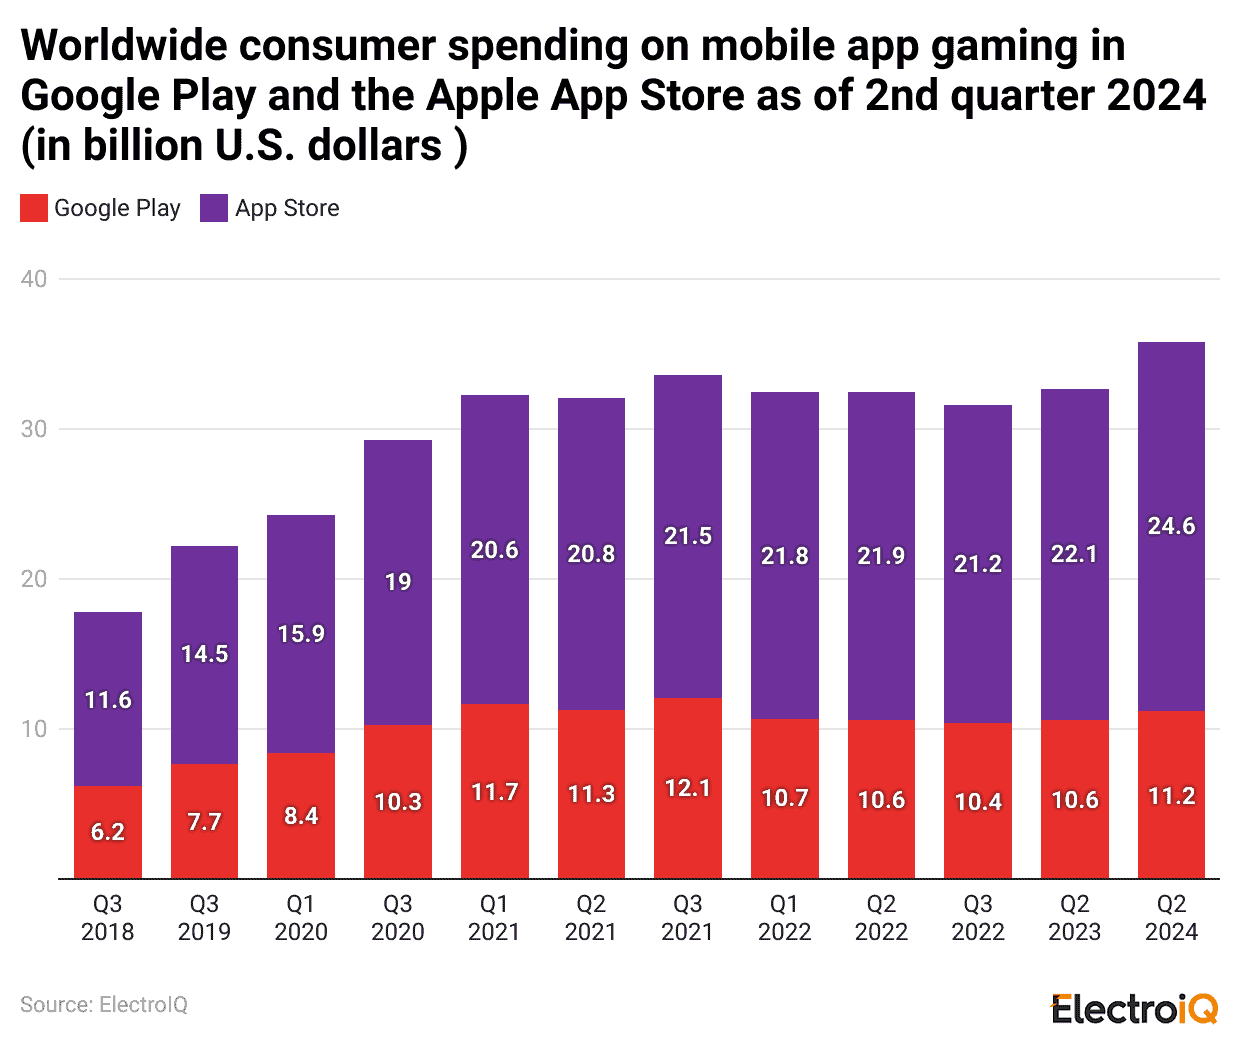
- In the second quarter of 2024, spending increased on both platforms: Google Play (USD 11.2 billion) and the App Store (USD 24.6 billion).
(Source: infogram.com)
- Global in-app purchase revenue on iOS and Google Play reached USD 39.3 billion in the first quarter of 2025 and USD 40.9 billion in Q2.
|
(Quarterly Analysis)
|
Apps | Games |
| Revenue of iOS and Google Play (USD billion) |
||
| Q2, 2025 | 21.1 | 19.8 |
| Q1 | 19.5 | 19.8 |
| Q4, 2024 | 19.1 | 19.7 |
| Q3 | 18.1 | 19.9 |
| Q2 | 17.0 | 19.7 |
By Category
- In 2025, games generated the highest revenue on the App Store, resulting in USD 82 billion.
- Social networking apps will account for USD 16.7 billion, driven by platforms such as TikTok, YouTube, and new AI video apps.
- Entertainment services such as Disney+ and HBO Max generated USD 12.5 billion in revenue.
- Health and fitness apps rose sharply, growing 24% year over year to USD 6.3 billion.
- Dating apps, including Tinder and Bumble, generated USD 4.1 billion in revenue, with Bumble’s revenue increasing by 29%.
- Productivity and business tools accounted for USD 4.8 billion, while finance apps accounted for USD 5.6 billion.
- Shopping apps such as Temu and Amazon accounted for USD 9.3 billion, education apps for USD 3.2 billion, and lifestyle apps for more than USD 2.6 billion.
App Store Statistics By Currently Available Apps
(Source: 42matters.com)
- Google Play had 2,137,219 apps, and the Apple App Store had 2,060,478 apps on 11th December 2025.
- As of the latest 2025 data, Google Play hosts 2,137,219 apps, comprising 1,881,575 (88.04%) and 255,644 games (11.96%).
- In comparison, the Apple App Store offers 2,060,478 apps in total, of which 1,852,294 (89.9%) are apps, and 208,184 (10.1%) are games.
The table below shows the free vs. paid apps analysis of 2025:
| Platforms | Free Apps | Paid Apps |
| Google Play | 2,071,542 (96.96%) | 65,054 (3.04%) |
| iOS App Store | 1,963,049 (95.34%) | 95,982 (4.66%) |
Number of Paid Apps by Cost Statistics, 2025
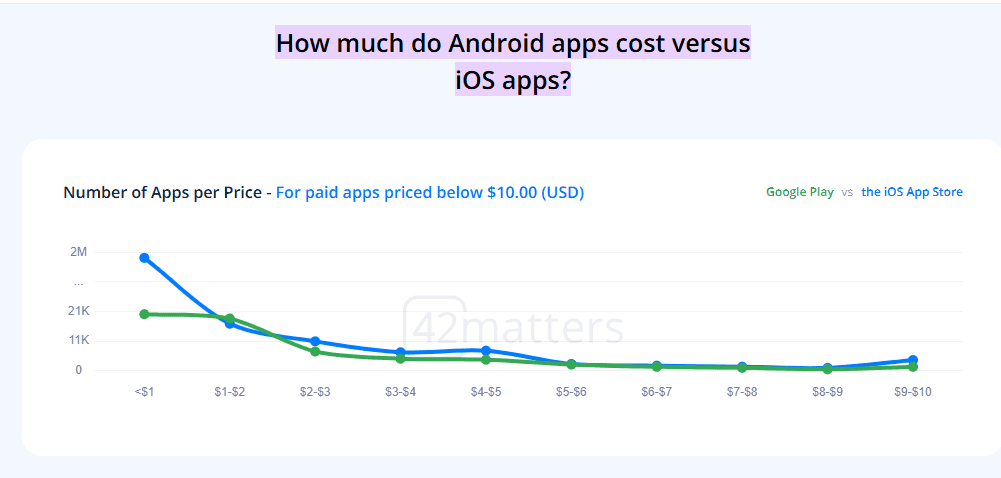
(Source: 42matters.com)
| Cost (USD) |
Google Play (Apps) |
iOS App Store (Apps) |
| <1 | 20,465 | 1,997,495 |
| 1 to 2 | 18,656 | 16,929 |
| 2 to 3 | 6,886 | 10,539 |
| 3 to 4 | 4,291 | 6,641 |
| 4 to 5 | 3,943 | 7,189 |
| 5 to 6 | 2,175 | 2,389 |
| 6 to 7 | 1,353 | 1,750 |
| 7 to 8 | 998 | 1,400 |
| 8 to 9 | 477 | 974 |
| 9 to 10 | 1,371 | 3,786 |
App Stores Distribution Analyses By Category, 2025
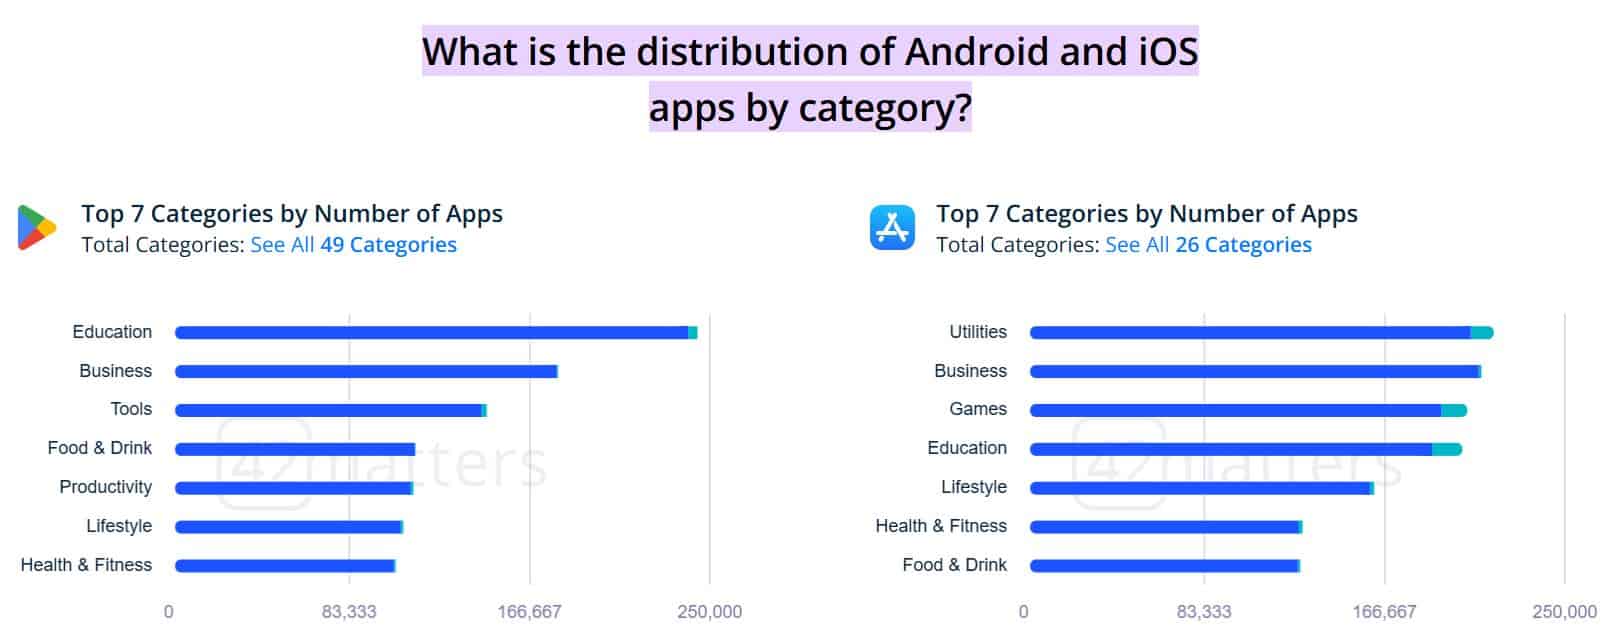
(Source: 42matters.com)
Google Play
| Category | Free | Paid |
| Education | 239,835 | 6,820 |
| Business | 179,141 | 662 |
| Tools | 144,351 | 4,402 |
| Foods & Drink | 113,633 | 247 |
| Productivity | 111,687 | 1,985 |
| Lifestyle | 106,999 | 1,954 |
| Health & Fitness | 103,949 | 1,088 |
- The Education category on Google Play has a very high share of free apps: 239,835 free titles versus 6,820 paid titles. Paid apps account for nearly 2.8% of the total, indicating that most learning tools are offered free, while paid apps, typically priced in USD, serve a smaller premium demand.
- The Business category is largely driven by free distribution, with 179,141 free apps and only 662 paid apps. Paid offerings account for about 0.4%, indicating that business users strongly prefer free tools, while paid apps in USD are limited to niche or enterprise-focused use cases.
- In the Tools category, 144,351 free apps dominate, accounting for 4,402 paid apps. Paid tools make up close to 3.0%, reflecting steady demand for specialized utilities where users are more willing to pay in USD for advanced features.
- The Food & Drink category is almost entirely free-led, with 113,633 free apps and just 247 paid apps. Paid apps account for only about 0.2%, indicating that recipe, ordering, and discovery apps rely primarily on free access rather than direct USD purchases.
- Productivity apps also follow a free-first approach, with 111,687 free apps and 1,985 paid apps. Paid apps represent nearly 1.8%, suggesting selective willingness among users to pay in USD for efficiency and task management improvements.
- The Lifestyle category records 106,999 free apps versus 1,954 paid apps. Paid apps account for roughly 1.8%, showing moderate acceptance of USD-priced apps that focus on personalization, wellness, or daily activities.
- Health & Fitness apps are primarily offered for free, with 103,949 free and 1,088 paid apps. Paid apps account for about 1.0% of the market, indicating that while most users start with free options, a small segment is willing to pay in USD for premium health tracking or training features.
iOS App Store
| Category | Free | Paid |
| Utilities | 206,278 | 13,142 |
| Business | 209,990 | 2,026 |
| Games | 192,837 | 14,476 |
| Education | 188,558 | 16,428 |
| Lifestyle | 159,858 | 3,262 |
| Health and Fitness | 126,729 | 3,394 |
| Food & Drink | 126,626 | 1,649 |
- In the iOS App Store, the Utilities category shows 206,278 free apps and 13,142 paid apps, indicating that free apps account for over 90% of total listings, while paid apps represent a small share of user demand.
- The Business category records 209,990 free apps versus 2,026 paid apps, indicating that paid options account for less than 2%, reflecting a strong reliance on freemium and subscription-led models.
- In the Games category, 192,837 apps are free and 14,476 are paid, showing that paid titles make up less than 10%, even though gaming remains one of the highest revenue-generating segments in USD terms.
- The Education category includes 188,558 free apps and 16,428 paid apps, where paid offerings account for around 8%, suggesting users are more willing to pay for structured learning content.
- Within the Lifestyle category, 159,858 free apps dominate over 3,262 paid apps, keeping the paid share at about 2%, which highlights price sensitivity in this segment.
- The Health and Fitness category reports 126,729 free apps and 3,394 paid apps, with paid apps contributing nearly 3%, supported by growing acceptance of wellness subscriptions priced in USD.
- In the Food & Drink category, 126,626 free apps significantly outweigh 1,649 paid apps, limiting paid adoption to around 1%, as most users prefer free discovery and ordering tools over direct purchases.
By Newly Released (Per day, per week, and per month)
- According to 42matters.com, in 2025, Google Play released approximately 1.7K new apps per day, whereas the iOS App Store with 2K new apps per day.
Furthermore, weekly and monthly releases of 2025 are stated in the table below: Per Week
| Calendar Week | Google Play | iOS App Store |
| CW 47 | 13K | 15K |
| CW 48 | 12K | 14K |
| CW 49 | 9.5K | 12K |
Per Month (September to November)
| Month | Google Play | iOS App Store |
| September | 58K | 56K |
| October | 56K | 57K |
| November | 52K | 57K |
App Store Statistics By App Ratings
- In 2025, the distribution of apps by rating shows that Google Play has 1,050,202 rated apps, representing 49.14% of its catalogue, while the App Store has 852,069 rated apps, accounting for 41.35% of its total.
- In contrast, Google Play contains 1,087,017 unrated apps, accounting for 50.86%, while the App Store includes 1,208,409 unrated apps, representing 58.65% of its offerings.
The table below shows the average rating distributions by number of apps:
| Rating Distribution | Google Play (Apps) |
iOS App Store (Apps) |
| 1.0 to 1.5 | 3,896 | 44,879 |
| 1.5 to 2.0 | 11,355 | 15,337 |
| 2.0 to 2.5 | 25,119 | 32,724 |
| 2.5 to 3.0 | 44,989 | 26,913 |
| 3.0 to 3.5 | 96,567 | 64,601 |
| 3.5 to 4.0 | 180,852 | 59,477 |
| 4.0 to 4.5 | 324,962 | 128,040 |
| 4.5 to 5.0 | 279028 | 187,013 |
| 5 | 83,433 | 293,085 |
- Google Play also hosted 1,087,017 unrated apps, accounting for 50.86% of its total offerings, indicating a balanced mix of rated and unrated apps.
- In comparison, the App Store included 1,208,409 unrated apps, representing 58.65%, suggesting that a larger portion of iOS apps had not yet received user feedback.
- Apps rated between 1.0 and 1.5 were limited on Google Play at 3,896 apps, while the App Store showed a significantly higher count of 44,879 apps in this lowest rating range.
- The 1.5 to 2.0 rating range included 11,355 apps on Google Play and 15,337 apps on the App Store, indicating slightly weaker performance on iOS in this segment.
- Apps rated between 2.0 and 2.5 totaled 25,119 on Google Play and 32,724 on the App Store, reflecting moderate user dissatisfaction across both platforms.
- In the 2.5 to 3.0 category, Google Play reported 44,989 apps, while the App Store recorded 26,913 apps, indicating a stronger concentration of mid- to low-rated apps on Android.
- Apps rated 3.0 to 3.5 reached 96,567 on Google Play compared with 64,601 on the App Store, indicating broader average performance on Android.
- The 3.5 to 4.0 rating range included 180,852 Google Play apps and 59,477 App Store apps, highlighting stronger clustering of above-average ratings on Google Play.
- High-performing apps rated 4.0 to 4.5 accounted for 324,962 apps on Google Play and 128,040 apps on the App Store, making this the largest rating band on both platforms.
- Apps rated between 4.5 and 5.0 totaled 279,028 on Google Play, while the App Store recorded 187,013 apps, reflecting strong user satisfaction across both ecosystems.
- Perfect 5-star ratings were observed in 83,433 Google Play apps, whereas the App Store showed a significantly higher count of 293,085 apps, indicating stricter rating behavior on Android and more concentrated top ratings on iOS.
Mobile App Downloads Statistics By Stores
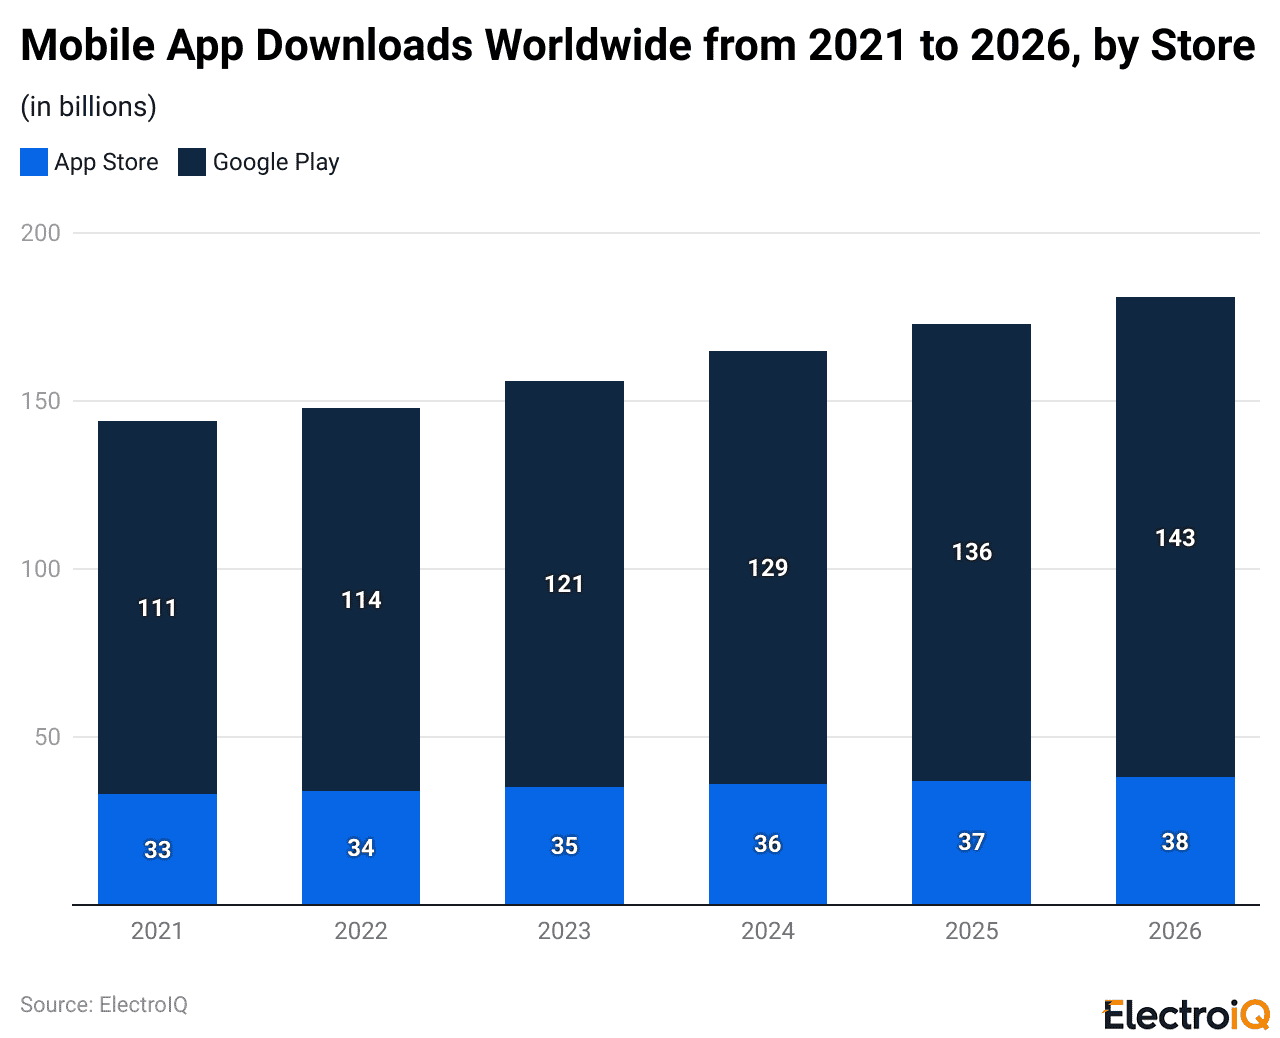
(Reference: statista.com)
- As of 2024, the total number of App Store downloads accounted for 36 billion, while Google Play recorded 129 billion.
- By 2025, the App Store will have reached 37 billion downloads, and Google Play will have reached 136 billion.
- Followed by 2026: the App Store (38 billion downloads) and Google Play (143 billion).
App Store Statistics By Top Global Downloads
(Reference: backlinko.com)
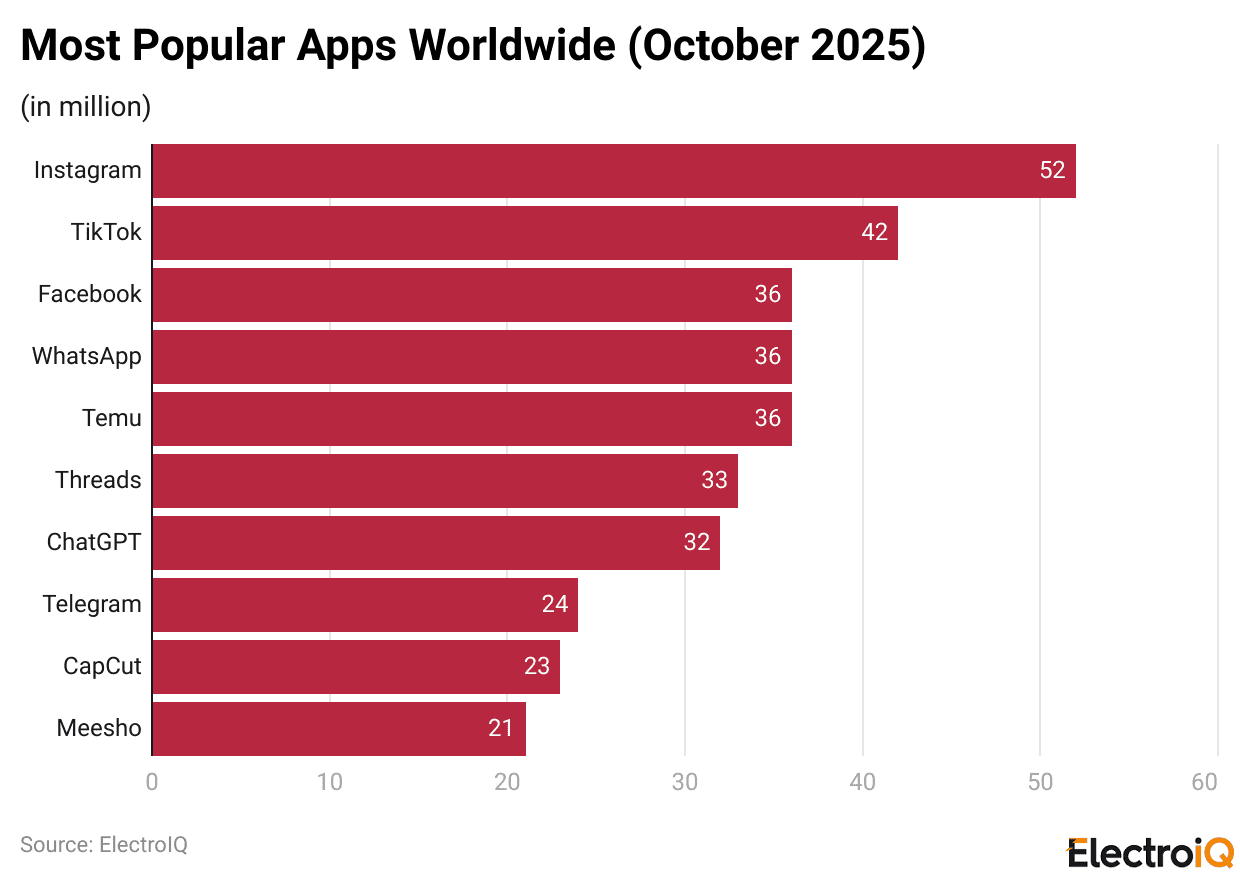
- As of October 2025, Instagram accounted for the highest number of downloads, with 52 million from both the Android and Apple App Stores.
- Followed by TikTok (42 million), Facebook (36 million), WhatsApp (36 million), Temu (36 million), Threads (33 million), ChatGPT (32 million), Telegram (24 million), CapCut (23 million), and Meesho (21 million).
Mobile App Downloads Statistics By Category
(Reference: statista.com)
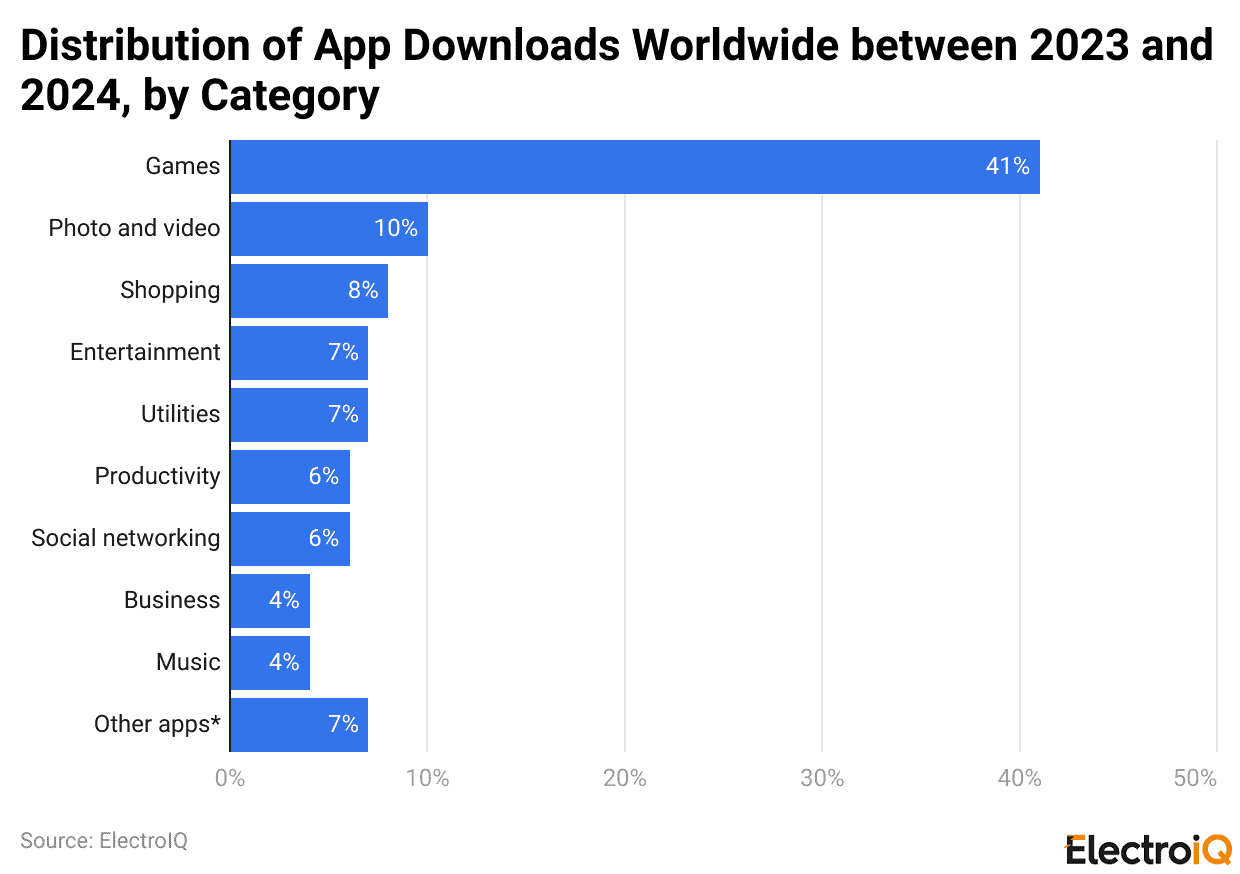
- The above Statista chart shows that games accounted for the largest share of app downloads between 2023 and 2024, with 41% of all downloads.
- The next biggest category is photo and video apps at 10%, followed by shopping apps with 8%, while entertainment apps account for 7% of downloads.
- Downloads followed by utilities (7%), productivity (6%), social networking (6%), business (4%), music (4%) and other apps (7%).
Fastest Apps To Reach One Billion Downloads
(Reference: infogram.com)
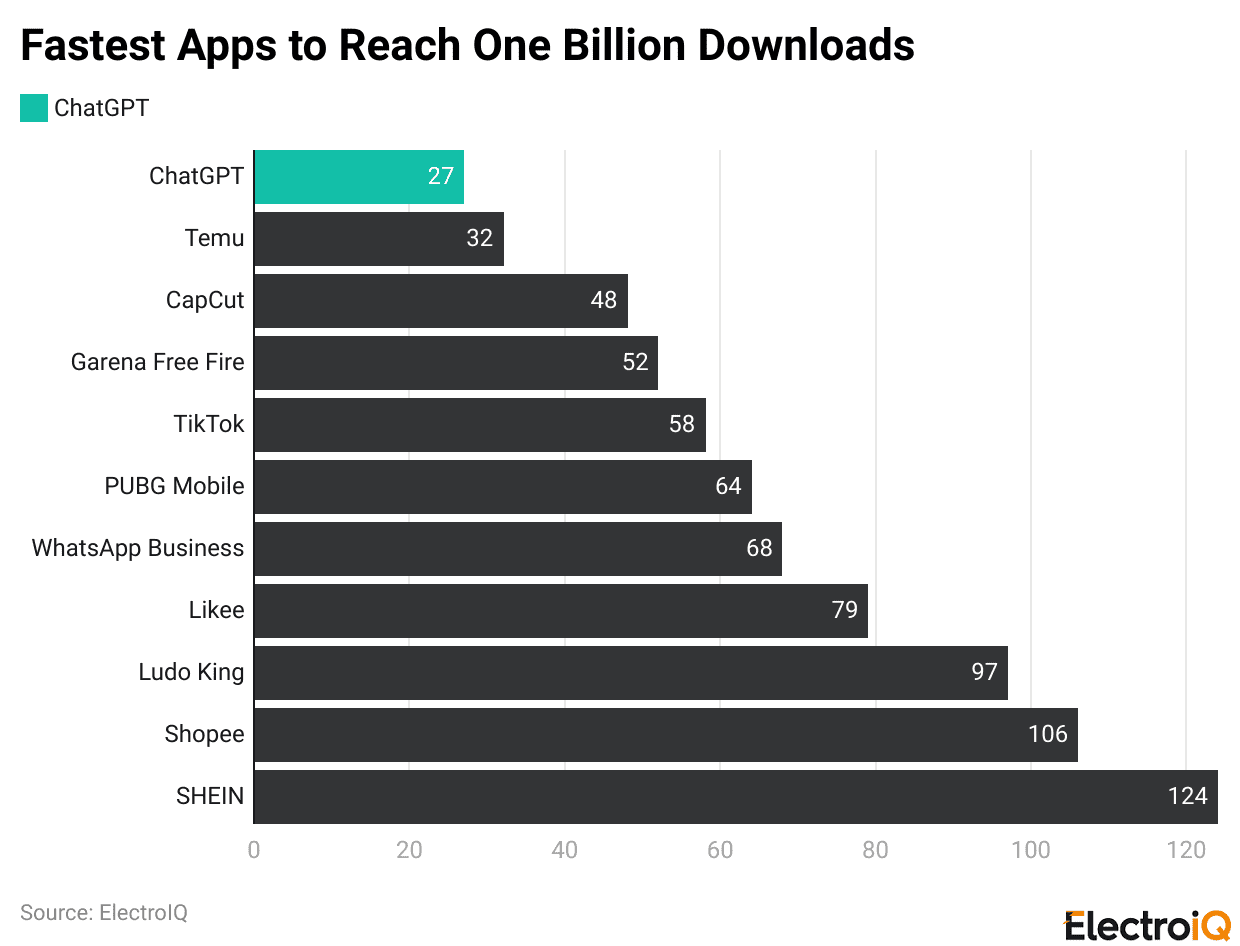
- ChatGPT reached one billion downloads the quickest, in only 27 months.
- Temu comes next at 32 months, then CapCut at 48 months.
- Garena Free Fire achieves 52 months, and TikTok achieves 58 months.
- PUBG Mobile requires 64 months, WhatsApp Business 68 months, and Likee 79 months.
- The casual game Ludo King reached one billion in 97 months, Shopee in 106 months, and finally SHEIN took 124 months.
App Store Marketing Statistics
- amraandelma.com further stated that in 2024, the global app store ecosystem generated USD 1.3 trillion in developer billings and sales.
- For 2025, store revenue is forecast at USD 138 billion (+16.9%), with games about 60% (USD 82 billion) and subscriptions about 44% of that total.
- The store has 1.81 million apps and 472,000 games, adds approximately 1,249 new apps each day, and is expected to surpass 92 billion downloads by the end of 2025.
- Meanwhile, around 69.3% of downloads are redownloads, and 94.6% of apps are free.
- In 2025, iOS users spent 4.2 hours/day in apps (+5% YoY).
- In the first half of 2024, U.S. conversion averaged 25% (navigation 115.5%), installs from search/browse were 3.8%, and 90% of visitors read only 10% of a page.
Top 10 Apps Of Google Play And iOS App Store (2025)
| Google Play | iOS App Store |
| Focus Friend (by Hank Green) | ChatGPT |
| Luminar: Photo Editor | Threads |
| Edits (an Instagram app) | |
| Wiser-15 Minute Audio Books | TikTok-Videos, Shop & LIVE |
| Pingo AI Language Learning | WhatsApp Messenger |
| ABCmouse 2: Kids Learning Game | |
| SleepisolBio: sleep, alarm | YouTube |
| Goodnotes: Notes, docs, PDF | Google Maps |
| SoundCloud | Gmail-Email by Google |
| Calm-Sleep, Meditate, Relax | Google Gemini |
Conclusion
App Store numbers are not just about how many times an app is downloaded. They also indicate users’ preferences, competitive intensity, and the emergence of new revenue streams. Because most people use phones first, developers need to focus on app speed, positive ratings, and retention, not only on first launch.
Subscriptions and in-app purchases are changing how apps make money. For companies, these statistics indicate where to allocate resources, which markets to focus on, and how quickly trends can evolve. Those who respond quickly stay ahead.
Sources
FAQ.
App Store statistics reveal user behaviour, guide business decisions, optimise performance, and improve revenue opportunities.
ASO is improving app store listings to significantly increase visibility and downloads.
Apps generate revenue through paid downloads, in-app purchases, subscriptions, advertising, sponsorships, and the sale of digital content online.
Yes, analytics reveal users’ countries, devices, and sometimes traffic sources and demographics.
Businesses learn user preferences, emerging markets, monetisation models, and opportunities to improve products and marketing.

Maitrayee Dey has a background in Electrical Engineering and has worked in various technical roles before transitioning to writing. Specializing in technology and Artificial Intelligence, she has served as an Academic Research Analyst and Freelance Writer, particularly focusing on education and healthcare in Australia. Maitrayee's lifelong passions for writing and painting led her to pursue a full-time writing career. She is also the creator of a cooking YouTube channel, where she shares her culinary adventures. At Smartphone Thoughts, Maitrayee brings her expertise in technology to provide in-depth smartphone reviews and app-related statistics, making complex topics easy to understand for all readers.