Data Science Statistics By Market Size, Application, Country, Adoption And Facts (2025)
Updated · Oct 17, 2025

Table of Contents
- Introduction
- Editor’s Choice
- General Statistics
- Data Science Market Size
- Application Analyses
- Tools For Data Exploration And Processing
- Data Science Statistics By Libraries For Creating Dashboards
- Experiment Tracking Tools Usage
- Adoption Statistics By Different Sectors
- ROI Impacts
- Average Data Scientist Salaries Statistics By Country, 2025
- Cloud Skills In Data Scientist Hiring
- Data Science Statistics By Top Used Tools
- Data Science Growth Statistics Across Use Cases
- Conclusion
Introduction
Data Science Statistics: Data science now drives everyday decisions and helps turn data into real business results. This article brings together up-to-date statistics that explain how teams, tools, and budgets are changing across sectors. Inside, you’ll see quick views of hiring needs, pay ranges, common tech stacks (Python, R, SQL), MLOps usage, how fast models go live, and the ROI from pilots to full production. We also show adoption by company size and region, how GenAI is entering daily workflows, and which skills most often lead to promotions.
Whether you build models, manage a team, or study the field, these numbers give a clear picture of where the discipline is growing, what is driving demand, and which capabilities create impact. Use these benchmarks to set goals, pick the right tools, and shape your 2025 plan.
Editor’s Choice
- The global market size of Data Science is expected to reach around USD 241.2 billion by the end of 2025, which increased from USD 187.3 billion in 2024.
- The market size of the U.S. data science platform is estimated to reach around USD 44.14 billion by 2025.
- In 2024, Pandas was the most used tool with 77% adoption, and NumPy followed at 72%.
- Plotly Dash was the most used dashboard tool at 31%, followed by Streamlit (28%), Panel (12%), Gradio (12%), and Voila (4%).
- An in-house solution secured the highest share in tools for data versioning, with a share of 14%.
- TensorBoard is a highly used experiment tracking tool with a share of 26%.
- Arcadia and HIMSS surveyed 100 healthcare leaders; 55% plan to aggregate unstructured data, reducing manual reviews.
- Around 66% of data leaders plan to spend more on data and analytics services to drive innovation.
- Data-driven firms are 23 times more likely to win customers and 19 times likely to be profitable.
- A report published by bls.gov in 2024, data scientists earned a median pay of USD 112,590 per year (approximately USD 54.13 per hour).
- According to mindinventory.com, the United States News ranks data scientists #4 in best technology jobs, #6 in best STEM jobs, and #8 among top U.S. jobs.
- In 2025, Python is the top data-science language at 84.6% usage, with SQL (58.5%) and R (45.9%).
- In the same year, only 3 out of 5 organisations, with about 60% use data analytics to drive innovation.
General Statistics
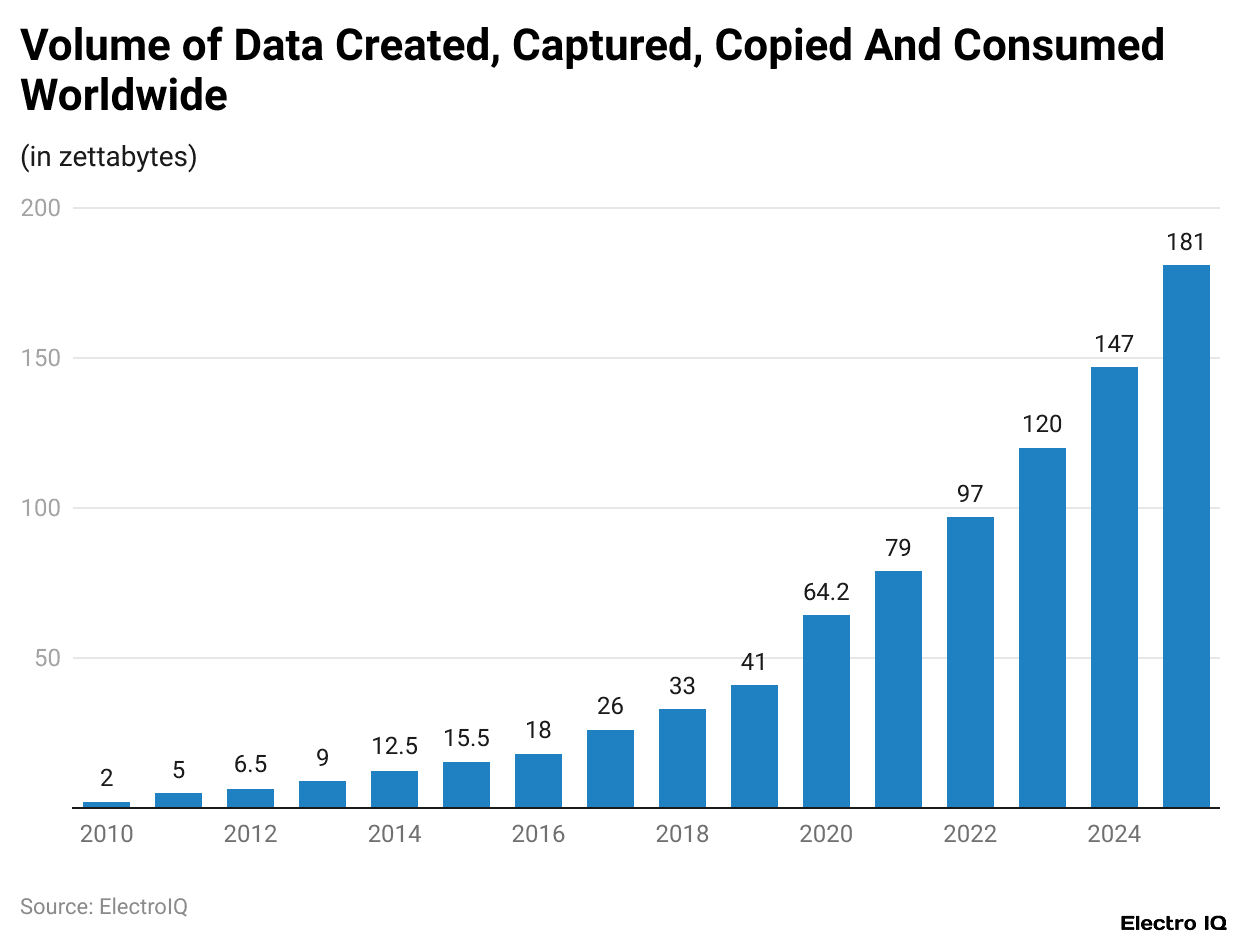
(Reference: admin.binariks.com)
- In 2024, the volume of data created, captured, copied, and consumed was 147 zettabytes of data, while it will reach 181 zettabytes by the end of 2025.
- USA Today reports the data science market may reach USD 166.89 billion in 2025, with North America contributing about 38% of adoption.
- Precedence Research projects the data science platform market to climb to USD 676.51 billion by 2034 at a 16.20% CAGR.
- Around 66% of data leaders plan to spend more on data and analytics services to drive innovation, while a majority allocate around 55% of their budgets to big data for IT solutions.
- Companies doing so often realise an 8% revenue lift, and 56% stated that they are increasing big-data or analytics investment.
- According to Harvard Business, almost 90.5% of organisations rank AI.
Data Science Market Size
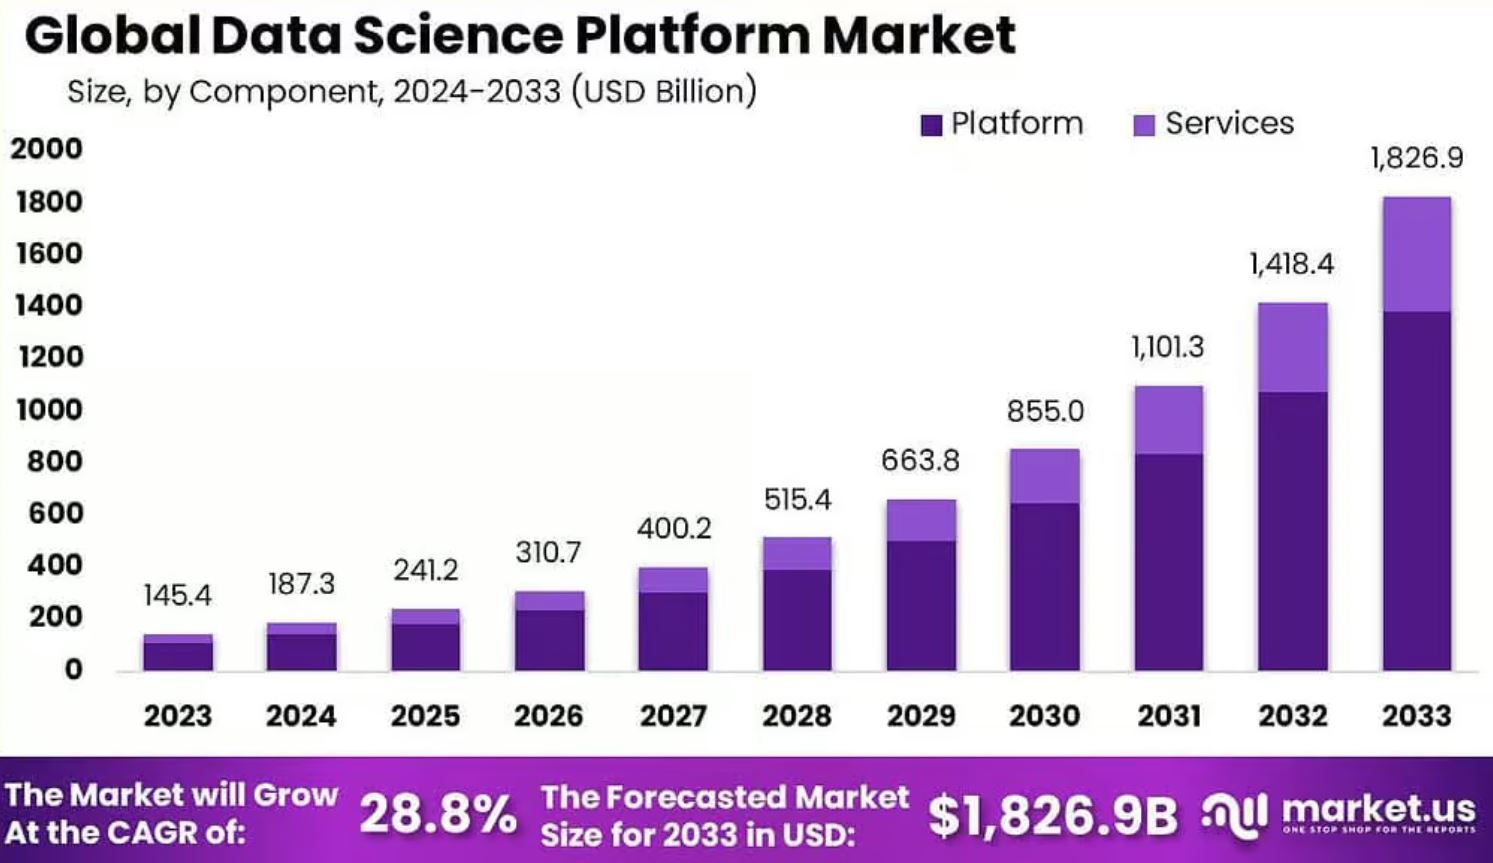
(Source: sp-ao.shortpixel.ai)
- The global market size of Data Science is expected to reach around USD 241.2 billion by the end of 2025, up from USD 187.3 billion in 2024.
- The growth rate of the market will grow at a CAGR of 28.8% from 2024 to 2033, resulting in USD 1,826.9 billion by the end of 2033.
- Furthermore, in the coming years, this market is estimated to reach USD 310.7 billion in 2026, followed by USD 400.2 billion in 2027, USD 515.4 billion in 2028, USD 663.8 billion in 2029, USD 855 billion in 2030, USD 1,101.3 billion in 2031, and USD 1,418.4 billion in 2032.
United States Data Science Market Size
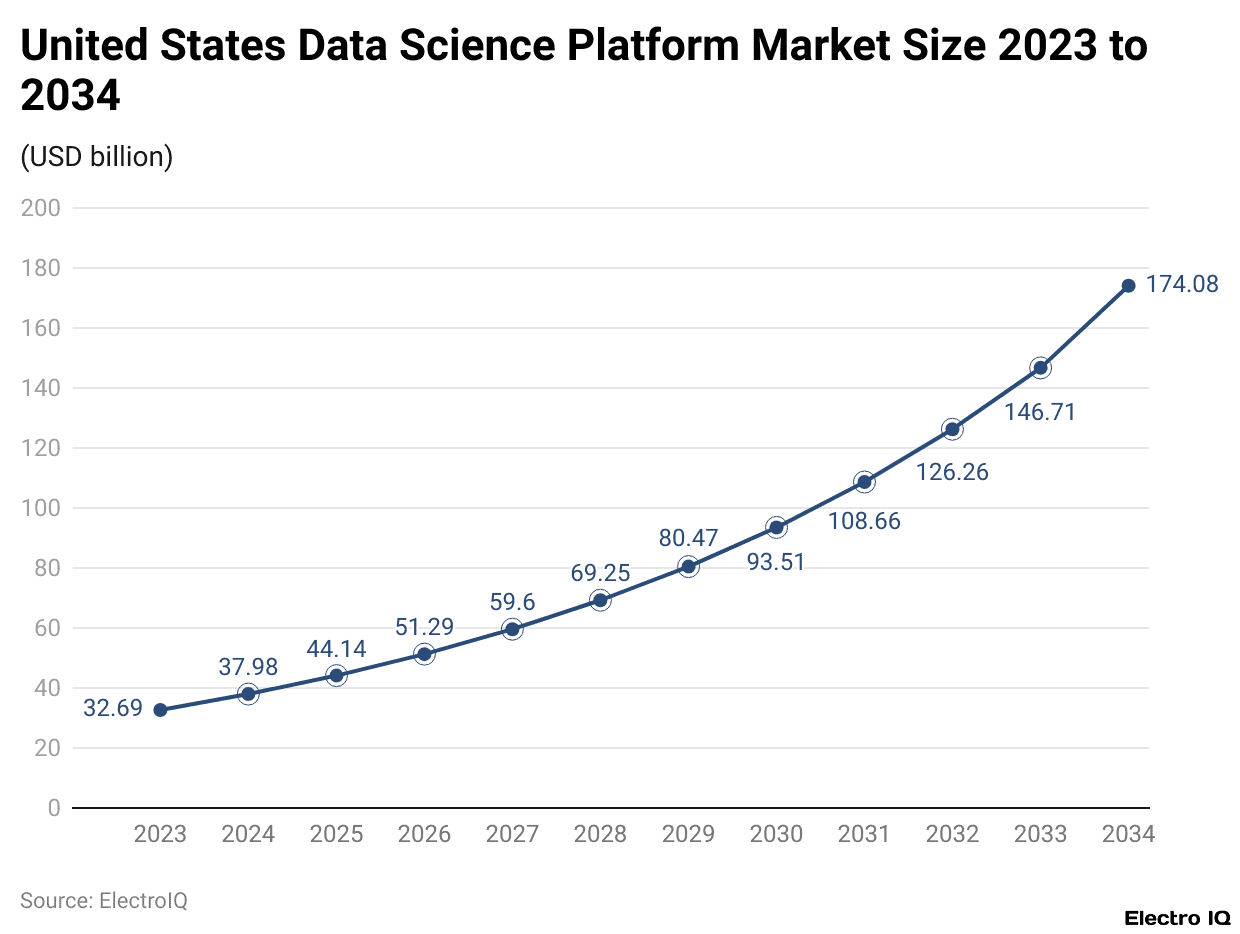
(Reference: precedenceresearch.com)
- The market size of the U.S. data science platform is estimated to reach around USD 44.14 billion by 2025, up from USD 37.98 billion in 2024.
- Furthermore, the market size in the coming years is expected to be followed by USD 51.29 billion (2026), USD 59.60 billion (2027), USD 69.25 billion (2028), USD 80.47 billion (2029), USD 93.51 billion (2030), USD 108.66 billion (2031), USD 126.26 billion (2032), USD 146.71 billion (2033), and USD 174.08 billion (2034).
- The growth rate of the market will reach a CAGR of 16.42% from 2024 to 2034.
Application Analyses
- Collect and clean data from many sources, then turn it into usable information.
- Support better decisions with evidence, not guesses.
- Combine skills from analytics, statistics, coding, machine learning, and data mining.
- Find hidden patterns to reveal important insights for any domain.
- Handle big datasets quickly and accurately.
- Build models that automate tasks and workflows.
Tools For Data Exploration And Processing
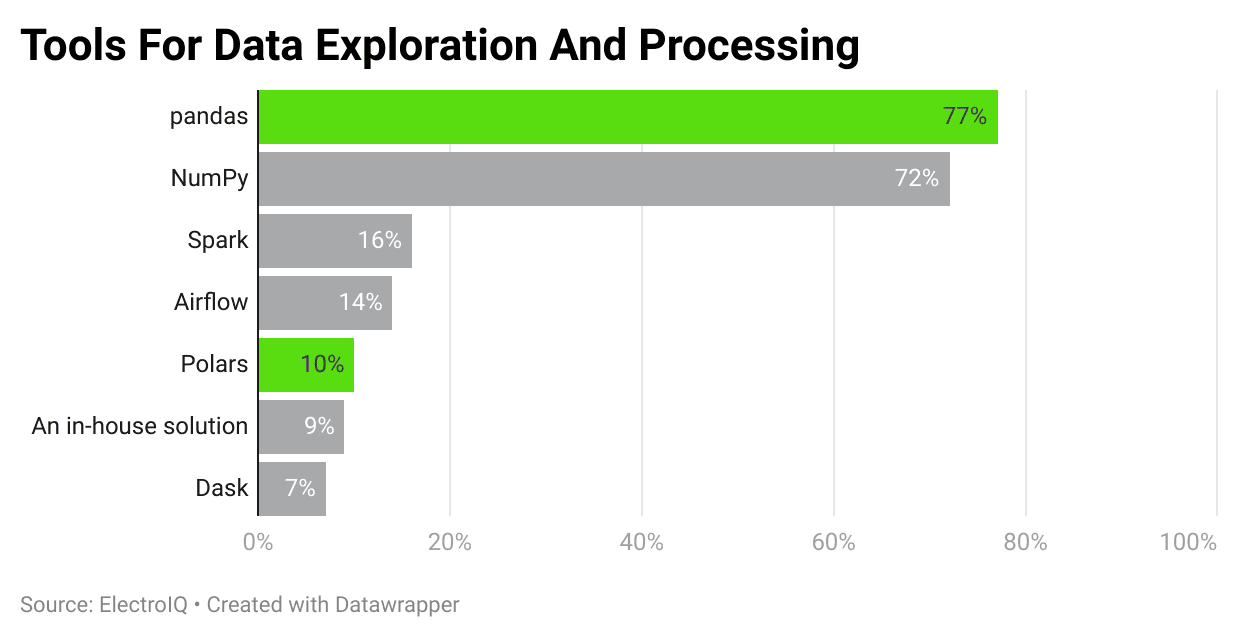
(Reference: blog.jetbrains.com)
- As of 2024, Pandas was the most used tool with 77% adoption, and NumPy followed at 72%.
- Followed by Spark (16%), Airflow (14%), Polars (10%), in-house tools (9%), and Dask (7%).
Data Science Statistics By Libraries For Creating Dashboards

(Reference: blog.jetbrains.com)
- In the same year, Plotly Dash was the most used dashboard tool with a share of 31%, followed by Streamlit (28%), Panel (12%), Gradio (12%), and Voila (4%).
- Another 13% used other libraries, while 26% had never used any dashboard libraries.
By Tools for Data Versioning
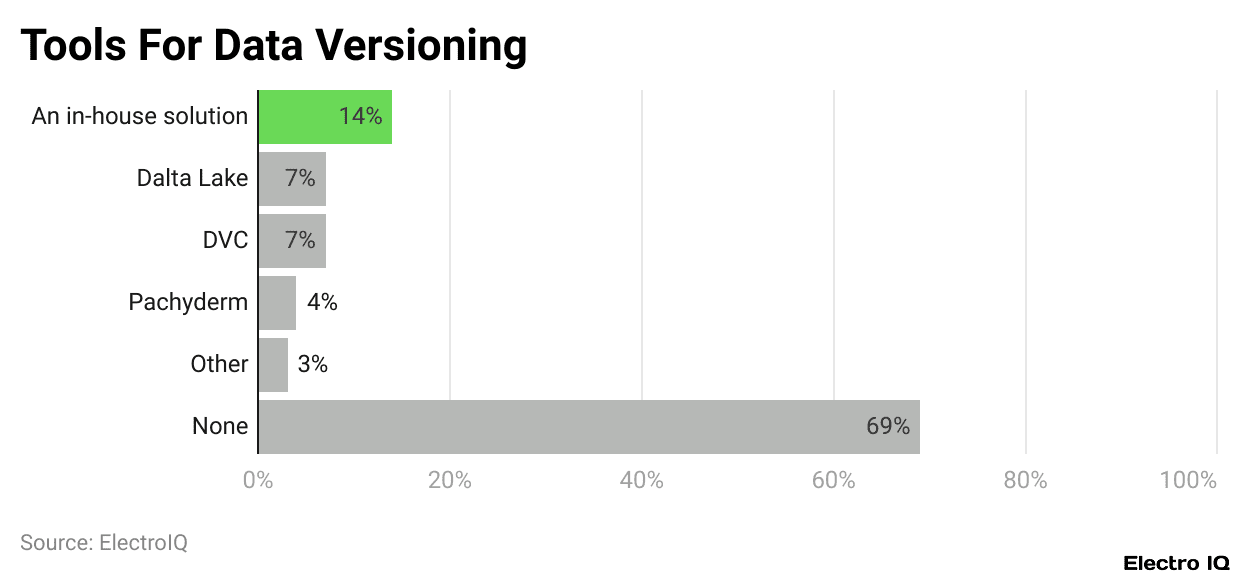
(Reference: blog.jetbrains.com)
- As of 2024, in-house solutions secured the highest share in tools for data versioning, with a share of 14%.
- Other tools are followed by Delta Lake (7%), DVC (7%), Pachyderm (4%), and others (3%).
- Lastly, 69% of people never used any data versioning tools.
Experiment Tracking Tools Usage
![]()
(Reference: blog.jetbrains.com)
- The above chart shows that TensorBoard is a highly used experiment tracking tool with a share of 26%.
- Followed by MLflow (19%), Weights & Biases (12%), CometML (4%), NeptuneML (4%).
- Only 2% use other tools, and 12% rely on in-house solutions.
- Notably, 44% report using no experiment tracking tool.
Adoption Statistics By Different Sectors
- Arcadia and HIMSS surveyed 100 healthcare leaders; 55% plan to aggregate unstructured data, reducing manual reviews.
- Meanwhile, 29% to 30% say data improves workforce productivity and helps identify meaningful cost-saving opportunities across organisations.
- In 2025, 45% of financial organisations plan to maximise data value via analytics.
- Additionally, 36% use data for risk management. NVIDIA reports 35% leverage AI for efficiency, 20% to lower TCO, and one-third achieve cost reductions over 10%.
- IDC reports 99.4% of U.S. higher-education institutions see data/AI advantage.
- Ivy Tech analysed 10,000 course sections, flagged 16,000 at-risk students, and saved 3,000; 98% of contacted students earned a C grade.
- IBM reports 62% of retailers improved competitiveness after adopting big data analytics.
- Forrester says insight-driven businesses grow 8.5x faster than beginners, achieving 20% revenue growth.
- Credence Research forecasts sports analytics to hit 19,477 million by 2032, CAGR 20.2% from 2025 to 2032.
- Formula 1 uses AWS, 300 sensors producing 1.1 million telemetry points.
ROI Impacts
- Data-driven firms are 23 times more likely to win customers and 19 times more likely to be more profitable.
- After using data science for predictive maintenance, operational efficiency rose 15% and maintenance costs dropped by about USD 50 million.
- Predictive maintenance cut unplanned downtime by 20% and delivered USD 25 million in savings.
- Analysis/reporting time fell 50%, misdiagnoses declined 20%, and diagnostic accuracy improved 25%.
- Models reached 99.9% detection accuracy, preventing roughly USD 2 billion in potential losses.
- Real-time management reduced peak-hour congestion by 25%.
- Citizens spent 30% less time finding spots.
- Product-recommendation click-through rates improved by up to 68%.
Average Data Scientist Salaries Statistics By Country, 2025
| Country | Average Salary Per Year |
| India | ₹12,50,000 |
| United States | 120,000 to $240,000 |
| United Kingdom | £60,000 |
| Germany | €68,000 |
| Canada | CA$101,092 |
| Australia | $115,000 to $135,000 |
| UAE | AED 13,565 |
By Hiring & Talent Demand
- According to mindinventory.com, the United States News ranks data scientists #4 in best technology jobs, #6 in best STEM jobs, and #8 among top U.S. jobs.
- The market demand will grow by 28% annually through 2026, adding 11.5 million new roles by 2026.
- In 2025, U.S. job changes are around 73,100; the U.S. Bureau of Labour Statistics projects 36% growth from 2023 to 2033.
- Vietnam’s AI/data science market is growing 28% to 30% from 2021 to 2025, with salaries of USD 1,500 to 3,000 per month and USD 5,000 to 7,000 for senior roles.
- India’s big data market is reaching USD 3.38 billion by 2029 at a 7.66% CAGR.
- In the UAE, data scientists are among the top 10 sought-after roles.
- Globally, postings favour versatile professionals (53.5%), domain experts (38.1%), and full-stack (5.4%).
Cloud Skills In Data Scientist Hiring
- In 2025, 26.7% of data scientist roles list AWS as core, with 3% asking for Amazon S3 and 0.3% for Lambda.
- Azure skills appear in 15.6% of openings, while Google Cloud Platform is mentioned far less at 3.4%.
Data Science Statistics By Top Used Tools
- Python leads data-science work, covering about 68% of projects.
- Demand stays high across company types, with about 76% in startups and 71% in enterprises.
- R is the main alternative: more than 2 million statisticians and data scientists use it.
- In enterprises, 43% of teams pair R with Python.
- For biostatistics, R is used in roughly 38% of applications, and about 65% of data scientists prefer R for academic research.
- SQL also ranks among the most in-demand skills, with 58.5% of recruiters expecting data scientists to know SQL.
By Top Programming Languages
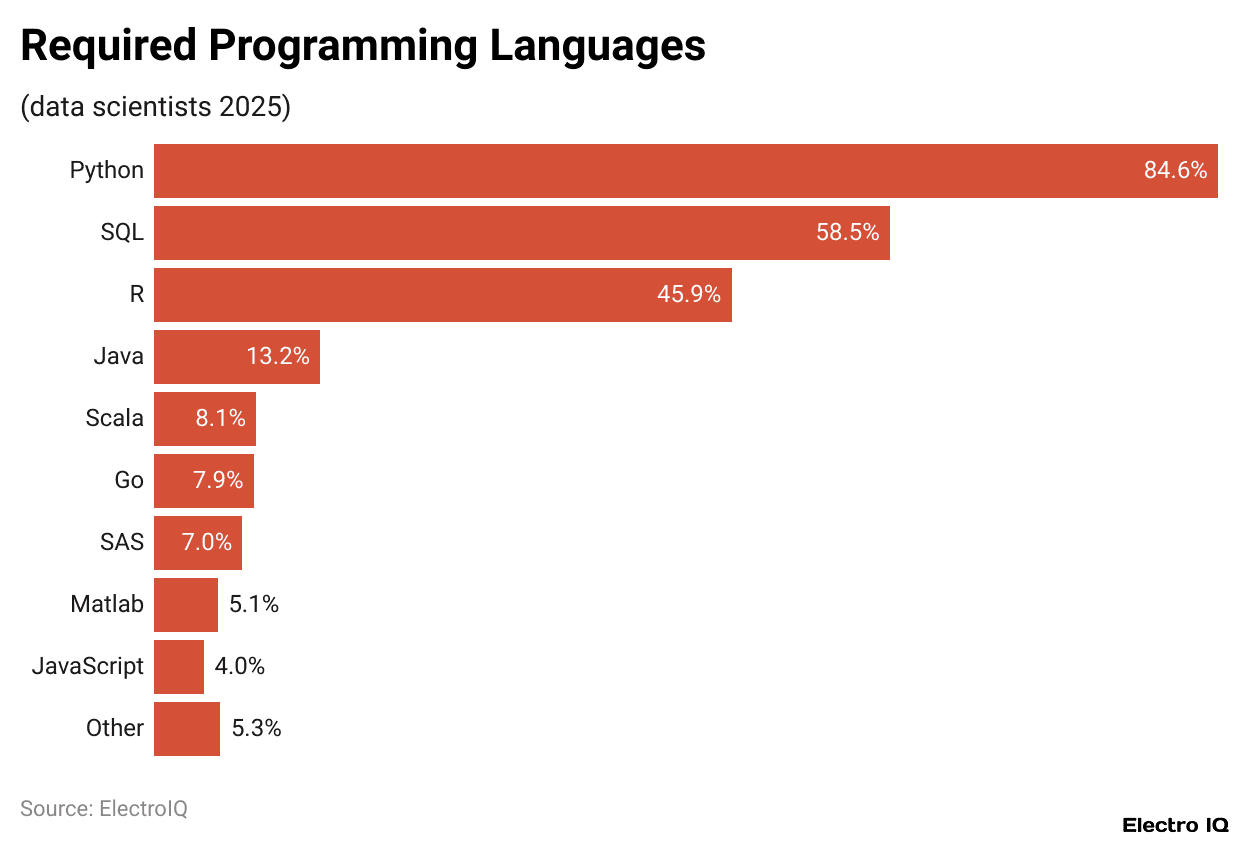
(Reference: mindinventory.com)
- In 2025 job postings, Python is the most used programming language in data science with a share of 84.6%, followed by SQL (58.5%) and R (45.9%).
- Furthermore, other required languages of 2025 are Java (13.2%), Scala (8.1%), Go (7.9%), SAS (7%), Matlab (5.1%), JavaScript (4%), and Other (5.3%).
Data Science Growth Statistics Across Use Cases
- A 2025 report shows 3 in 5 organisations use data analytics to drive innovation.
- Over 90% say they gained measurable value from data and analytics, and over 95% have added AI-powered predictive analytics to marketing, with 44% having fully integrated it.
- Hyper-personalisation cuts acquisition costs by 50%, lifts revenue 5% to 15%, and raises marketing ROI 10% to 30%.
- Still, about 30% of B2C marketing leaders struggle with data quality.
- More than 50% of global fraud uses AI, and 92% of financial institutions report that most fraud now involves generative AI.
- In response, 90% of these institutions are adopting AI-powered defences.
- 85% of companies plan to optimise inventory and supply chains with AI, while 83% plan to use automatic identification, and 78% will apply advanced analytics.
- 72% of AI/ML groups rely on data science to clean, transform, and label data for reliable training.
Conclusion
Data science is no longer an experiment; it now runs daily operations. The statistics here point to strong hiring, higher pay for rare skills, broader MLOps use, and quicker moves from pilots to production. Python-first stacks still lead, while GenAI is reshaping tools and routines in every size of company.
The lesson is clear: pair the right talent with disciplined delivery, versioning, monitoring, and clear ROI. Set 2025 goals to close skill gaps, harden platforms, standardise deployments, and measure business outcomes. Teams that operationalise well ship value faster and secure budgets.
FAQ.
Forecasting demand, scoring risk, detecting fraud, personalising content, optimising pricing, and improving operations.
SQL for data access, Python/R/R for analysis and modelling, statistics, data visualisation, and communication with stakeholders.
Python (pandas, scikit-learn), Jupyter, SQL databases, BI tools (e.g., dashboards), and cloud platforms for storage and compute.
Start with a narrow use case, ship a baseline, measure impact, then iterate, preferring deployment over endless experimentation.

Maitrayee Dey has a background in Electrical Engineering and has worked in various technical roles before transitioning to writing. Specializing in technology and Artificial Intelligence, she has served as an Academic Research Analyst and Freelance Writer, particularly focusing on education and healthcare in Australia. Maitrayee's lifelong passions for writing and painting led her to pursue a full-time writing career. She is also the creator of a cooking YouTube channel, where she shares her culinary adventures. At Smartphone Thoughts, Maitrayee brings her expertise in technology to provide in-depth smartphone reviews and app-related statistics, making complex topics easy to understand for all readers.