Google Analytics Statistics By Revenue, Market, Customer, Usage And Facts (2025)
Updated · Jun 23, 2025

Table of Contents
- Introduction
- Editor’s Choice
- General Google Analytics Statistics
- Features of Google Analytics
- Google Analytics Market Statistics
- Google Analytics Revenue Statistics
- Google Analytics Customer Statistics By Country
- Top 5 Companies Using Google Analytics
- Usage Statistics of Google Analytics
- Website Traffic of Google Analytics Statistics
- Industry Using Google Analytics Statistics
- Google Analytics Pricing Statistics
- Pros And Cons Of Google Analytics
- Conclusion
Introduction
Google Analytics Statistics: Google Analytics is one of the most popular tools to monitor your website’s performance, as it gathers data regarding customer behaviour, engagement, and preferences. They are segmented into two different versions: Google Analytics 4 (GA4) and Google Analytics 360 (GA360). Google Analytics was developed by Google and was released on November 14, 2005.
This article includes several detailed analyses from different insights, including overall market analysis, user bases, visitors’ interaction with a website, such as page views, session duration, traffic sources, and conversion rates.
Editor’s Choice
- According to W3Techs’ reports, Google Analytics dominates the web analytics market, holding an 81.4% share.
- By 2025, approximately 37.9 million websites worldwide are expected to utilise Google Analytics.
- The Meetanshi report further states that around 6.8 million companies have adopted Google Analytics in recent years.
- According to 6sense reports, the United States leads with 2,256,913 customers, accounting for 48.88% of the total customer base.
- As of 2025, more than 6444725 companies have started using Google Analytics.
- The platform supports over 39 languages, making it accessible to users worldwide.
- Narrative BI reports indicate that the global market for Analytics as a Service is projected to reach USD 58.71 billion by 2027.
- As per SimilarWeb reports of May 2025, the total number of visits to google-analytics.com reached 35.9 K.
- At the same period, India secured the highest website traffic share, at 51.23%.
- Moreover, direct search and organic search accounted for the highest traffic shares of 45.53% and 39.72%, respectively.
General Google Analytics Statistics
- Google Analytics is one of the most widely used tools for website tracking, with a market share of approximately 43% as of 2024.
- It’s currently used by about 14.2 million websites worldwide, including over 3.2 million in the United States alone.
- This means about 55.49% of all websites rely on it to monitor and understand how their sites are performing.
- Nearly 83.5% of websites use either Google Analytics or a similar tracking service.
- Among the top-ranking websites, about 43.35% of the top 10,000 and 42.23% of the top 100,000 rely on Google Analytics.
- The platform supports over 39 languages, making it accessible to users worldwide.
- However, it has faced some legal restrictions and has been banned in countries like France, Austria, and Italy.
- Google Analytics is a crucial component of the Analytics as a Service (AaaS) market, which is projected to reach nearly USD 69 billion by 2028.
- In 2025, the number of people following Google Analytics on Facebook grew by 6.53%.
Features of Google Analytics
- Focus: Web tracking, user behaviour
- Interface: User-friendly, suitable for beginners
- Customisation: Limited options
- Target Audience: Small to medium-sized businesses
- Integration Ecosystem: Google Ads, BigQuery, Looker Studio, and Firebase
- Costs: GA4 (Free); and GA360 (Starts at USD 150,000/year)
- Real-Time Data: Provides real-time tracking
- Data Retention: Up to 14 months by default; extendable in GA360
- Privacy Compliance: GDPR and CCPA compliant
- Predictive Analytics: Basic capabilities
- Complexity: Easy to Set up
Google Analytics Market Statistics
- A report published by 6sense estimates that Google Analytics’ market share in 2025 will reach 90.95%.
- While, according to Narrative BI reports, Google Analytics is the most widely used tool in the web analytics market, holding a market share of 29.62%.
- Meanwhile, the total number of current customers available in Google Analytics is around 6,564,075.
- The top three competitors of Google Analytics are Vidyard, with a 0.74% market share, followed by Tableau Software ( 0.72%) and Agile CRM (0.61%).
- As of 2025, more than 6444725 companies have started using Google Analytics.
Google Analytics Revenue Statistics
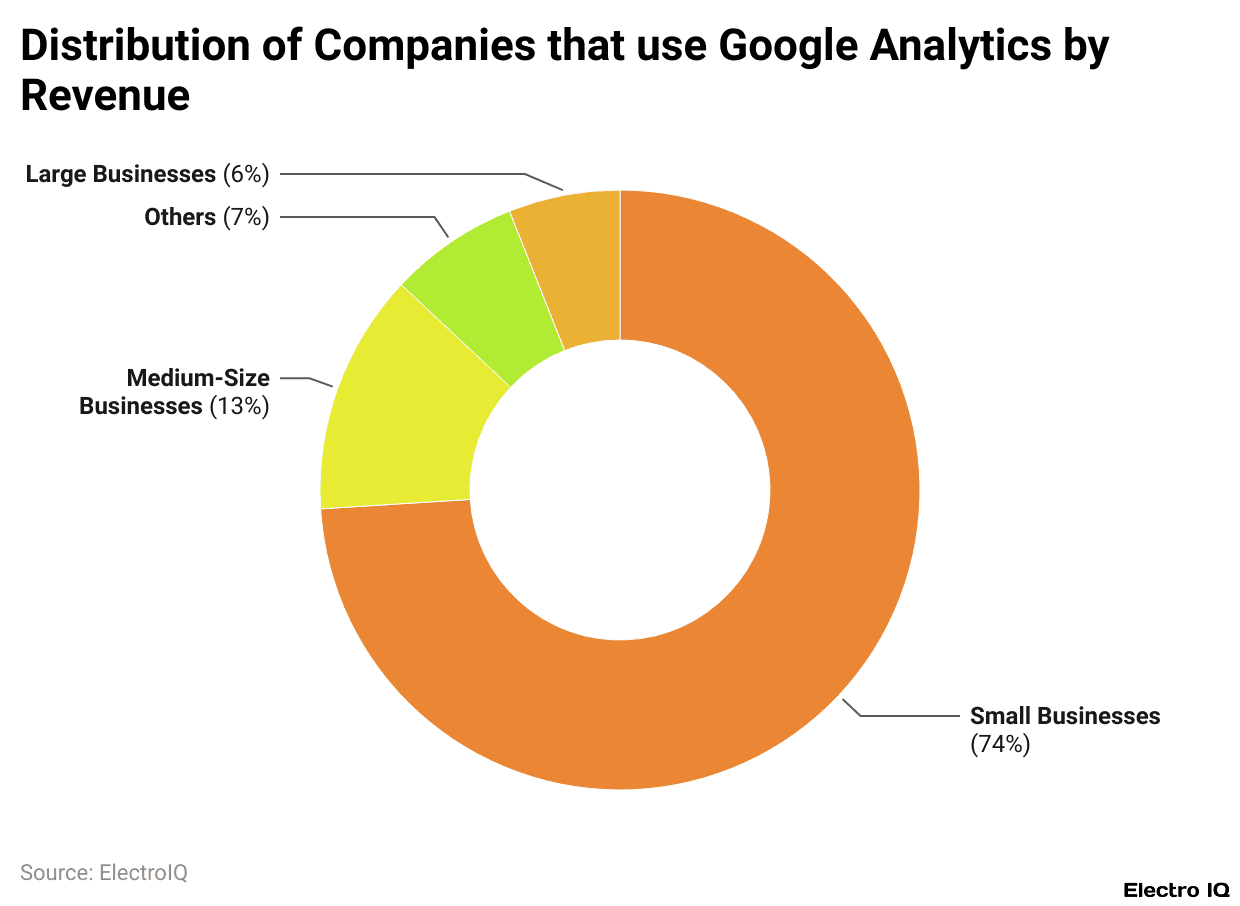
(Reference: blog.meetanshi.com)
- The above image indicates that most companies using Google Analytics earn revenue between USD 1 million and USD 10 million.
- Approximately 74% are small businesses earn revenue of less than USD 50 million.
- Medium-sized companies account for around 13%, while large businesses, earning over USD 1 billion, make up only 6%.
Google Analytics Customer Statistics By Country
- According to 6sense reports, the United States leads with 2,256,913 customers, accounting for 48.88% of the total customer base.
- The United Kingdom follows with 484,944 customers, accounting for 10.50%, and Canada comes in third with 258,026 customers, representing 5.59% of thetotal.
The above graph elaborates on the total number of customers using Google Analytics in different countries, as stated in the table below:
| Country | Number of customers |
| Germany | 253,634 |
| Brazil | 242,917 |
| France | 241,573 |
| India | 237,381 |
By Products and Services
- According to the reports of 6sense in 2025, Google Analytics’ top three products and services by number of customers using them are Marketing (34,979), Digital Marketing (22,112), and Social Media (22,023).
- Others are followed by Branding (21,700), Design (21,391), Seo (20,822), and Web Design (19,498).
By Employee Size
- As of 2025, approximately 3,624,541 small companies are utilising Google Analytics, with an employee count ranging from 0 to 9.
- Furthermore, the total number of Google Analytics customers by employee size is as follows: 1,468,915 customers (20-49 employees), 492,683 customers (100-249 employees), 429,830 customers (10-19 employees), and 135,614 customers (250-499).
Top 5 Companies Using Google Analytics
| Company Names | Employee Size |
| ASA International |
10,000+
|
| Brother Industries | |
| Hunter Douglas NV | |
| Apollo Hospitals | |
| JLL |
Usage Statistics of Google Analytics
- According to W3Techs’ reports, Google Analytics dominates the web analytics market, holding an 81.4% share.
- In the same duration, the absolute usage share of Google Analytics is 46.8%.
(Reference: w3techs.com)
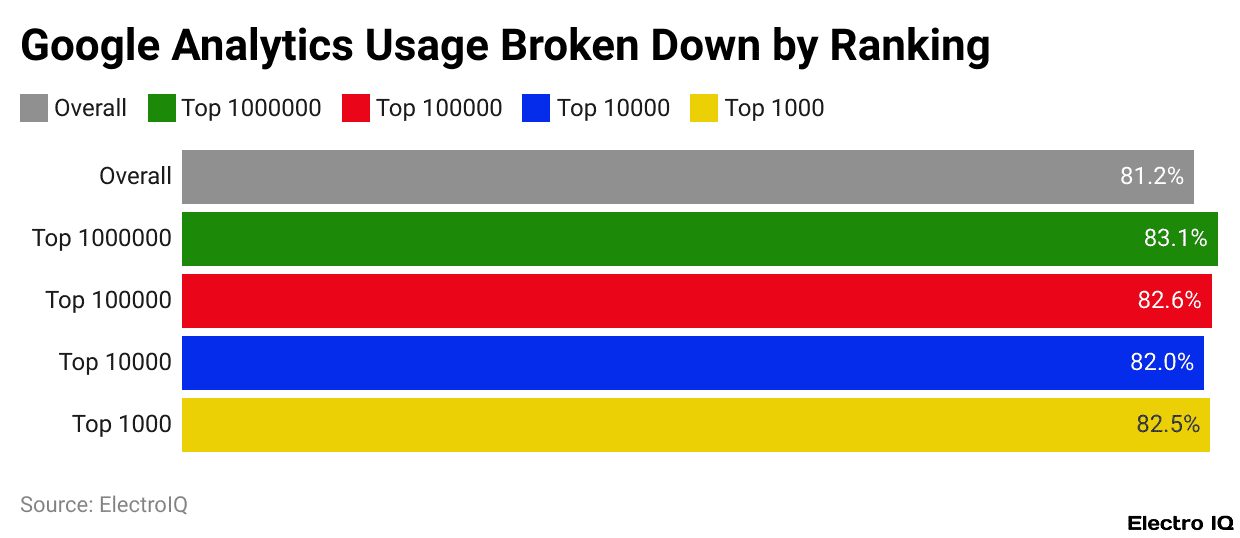
- As of June 5, 2025, Google Analytics is used by 83.3% of the top 1 million websites that rely on traffic analysis tools, while only 0.4% of those websites use Adobe Analytics.
Furthermore, other shares of websites using Google Analytics by ranking are stated in the table below:
| Ranking | Google Analytics |
| Top 100,000 | 82.9% |
| Top 10,000 | 82.5% |
| Top 1,000 | 82.3% |
Website Traffic of Google Analytics Statistics
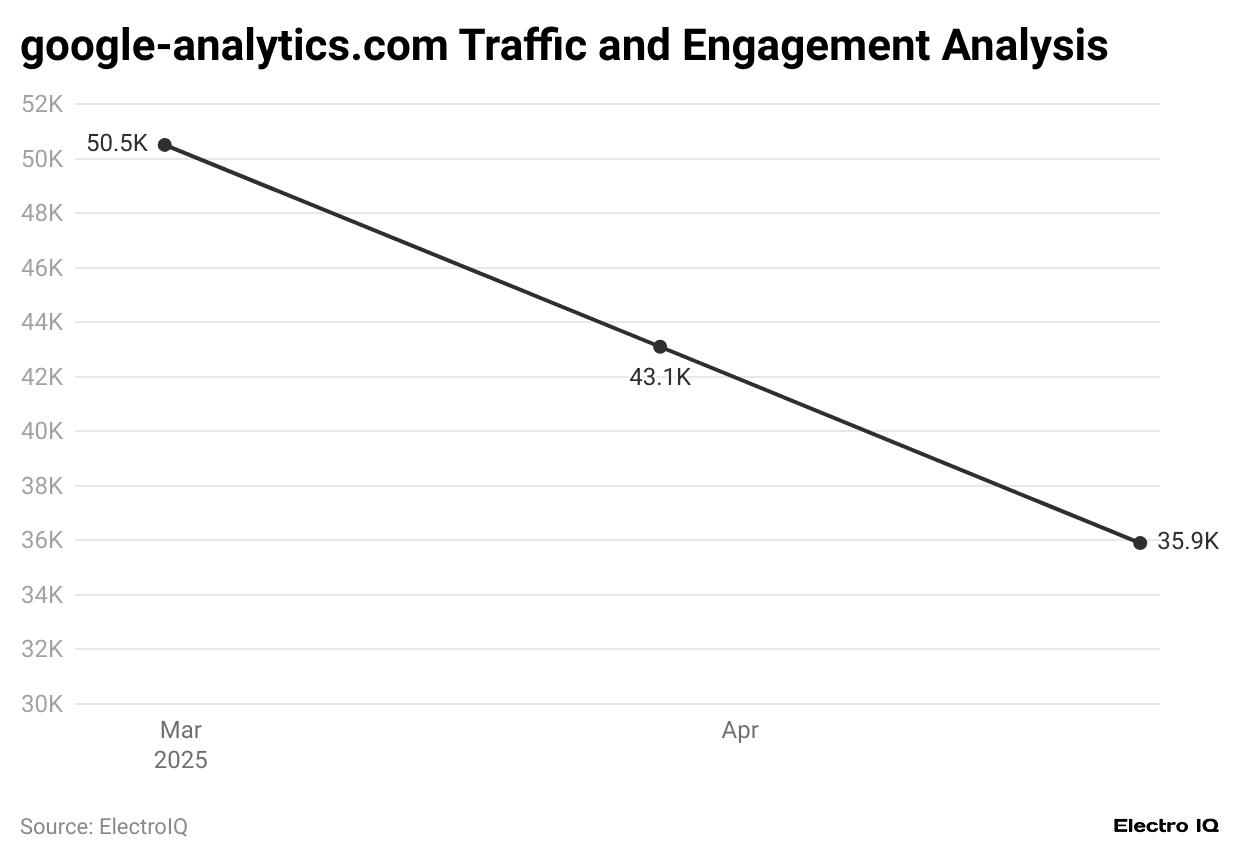
(Source: similarweb.com)
- As of May 2025, the total number of visits to google-analytics.com reached 35.9K, representing a 16.63% decrease, along with a bounce rate of 80.01%.
- Meanwhile, the website’s pages per visit remained 1.54, and the average visit duration was 00:00:17.
- Based on ranking, the website’s global ranking was #834,758, in Japan it ranked #158,612, and its category-based rank was #4,575.
By Country
(Source: similarweb.com)
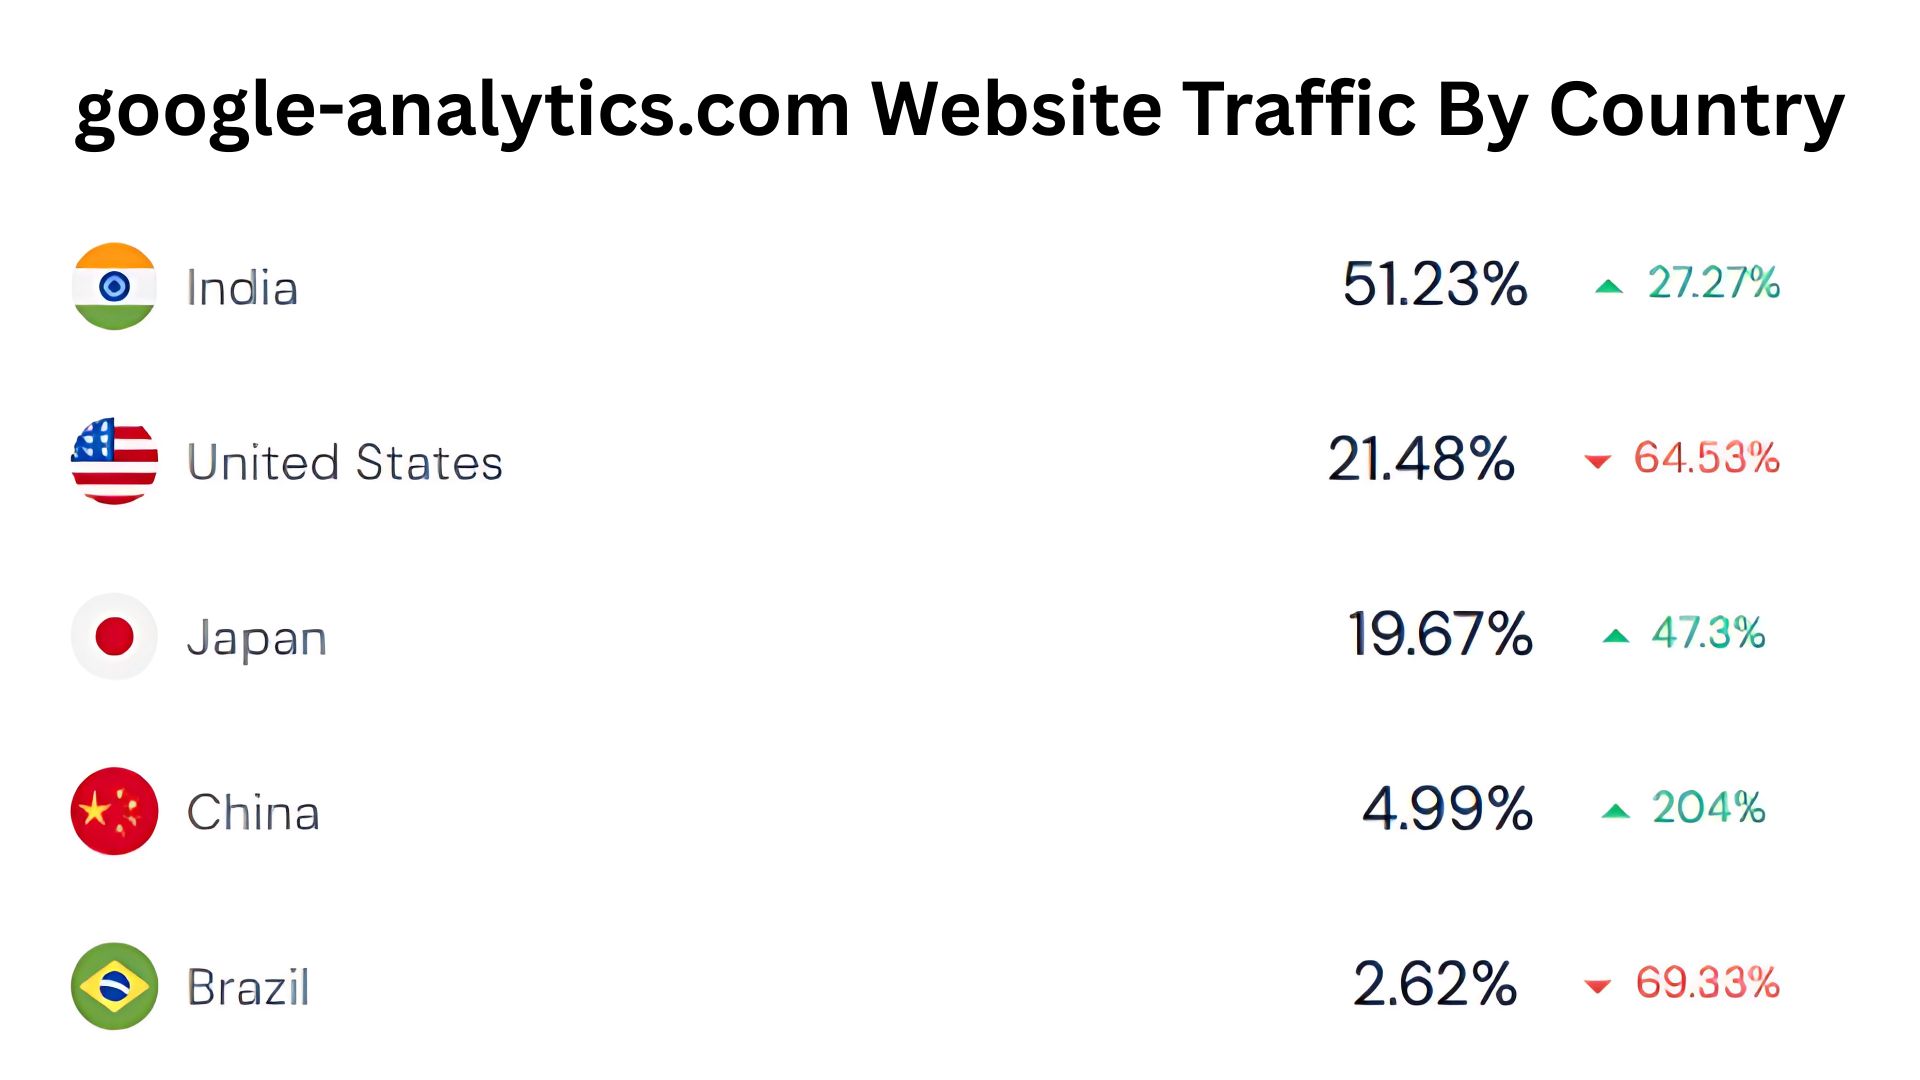
- The above graph indicates that in May 2025, India secured the highest website traffic share, at 51.23%, representing a 27.27% increase from the previous month.
- Moreover, the United States accounted for 21.48% (-64.53%) and Japan accounted for 19.67% (+47.3%).
- China’s and Brazil’s traffic shares secured a traffic share of 4.99% (+20.4%) and 2.62% (-69.33%), respectively.
By Marketing Channels Distribution
(Reference: similarweb.com)
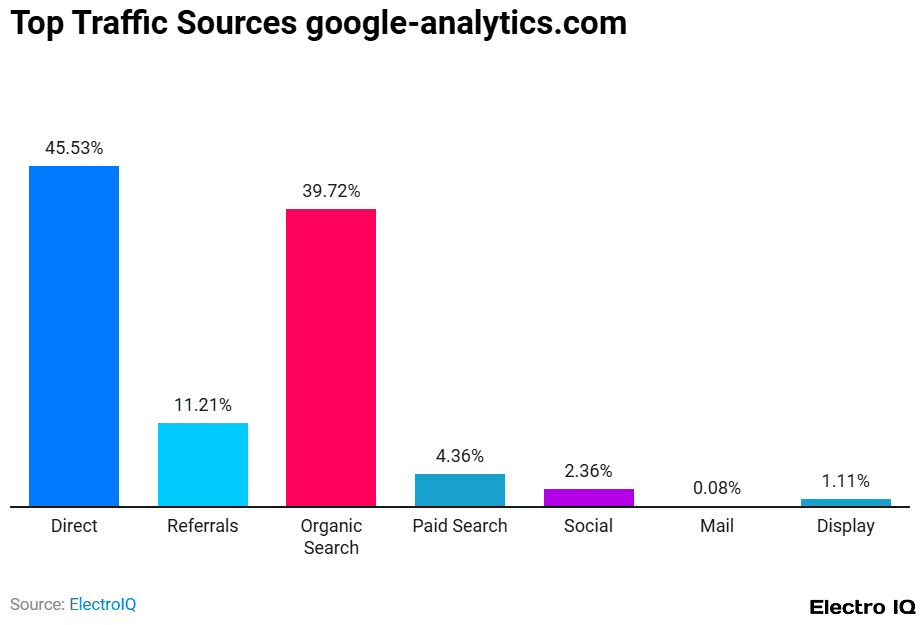
- As of May 2025, direct search and organic search accounted for the highest traffic shares of 45.53% and 39.72%, respectively, on Google Analytics’ website.
- Meanwhile, other channels’ shares are followed by referrals (11.21%), social (2,36%), email (0.08%), and display (1.11%).
Industry Using Google Analytics Statistics
(Source: mycodelesswebsite.com)
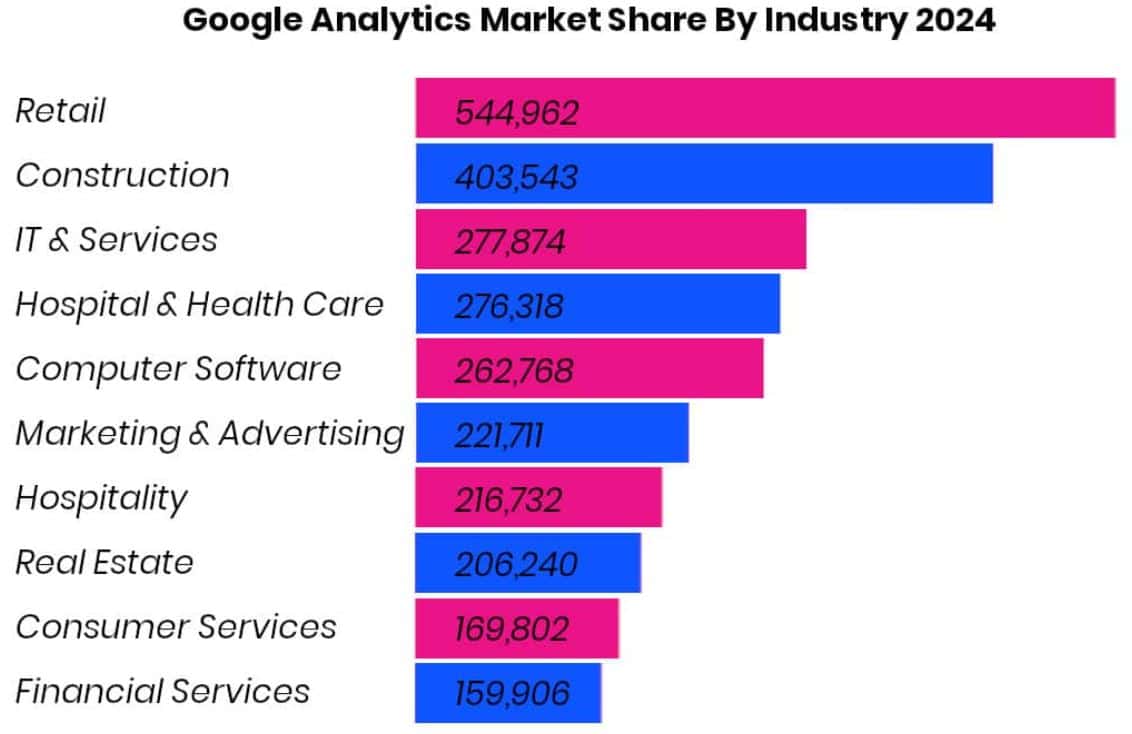
- A report published by My Codeless Website, as of January 2024, found that almost 544,962 retail companies were using Google Analytics, followed by Construction with 403,543 companies, and IT & Services with 277,874 companies.
- Furthermore, other industries using Google Analytics, listed by number of companies, are Hospital & Health Care (276,318), Computer Software (262,768), Marketing & Advertising (221,711), Hospitality (216,732), Real Estate (206,240), Consumer Services (169,802), and Financial Services (159,906).
Google Analytics Pricing Statistics
- The PostHog report states that Google Analytics 4’s standard plan is completely free, with usage limits (including sampling for large datasets and 14-month data retention).
- The enterprise-grade Google Analytics 360 starts at approximately USD 50,000 per year, which includes up to 25 million events per month.
- For larger data needs or higher traffic, GA360 pricing can exceed USD 150,000 per year.
- Enterprises often pay extra for services like server-side tracking, BigQuery access, and implementation support.
Pros And Cons Of Google Analytics
| Pros | Cons |
| Free of cost. | Upgrading to the premium version of Google Analytics 360 is more expensive, at around USD 150,000. |
| Can be easily connected with a Google Ads account. | Complex measurements are not possible. |
| Helps in tracking eCommerce platforms. | By tracking the entire sales funnel, behaviour cannot be analysed. |
| Able to create custom reports to track specific information based on a particular sector. | Complicated integration of code for non-developers. |
| Ideal for beginners as it comes with in-depth information about the platform. | For marketing reports, dashboards are not optimally suited. |
Conclusion
After completing the article on Google Analytics Statistics, it can be concluded that Google Analytics is better for simpler use. As they are mostly free, easy to use, and integrate seamlessly with other Google tools, such as Ads, BigQuery, and Search Console. As digital trends grow and data-driven strategies become more essential, the demand for tools like Google Analytics is only expected to rise.
Hope this article will help in understanding the basic knowledge about Google Analytics so, that you can effectively grow your online presence.

Maitrayee Dey has a background in Electrical Engineering and has worked in various technical roles before transitioning to writing. Specializing in technology and Artificial Intelligence, she has served as an Academic Research Analyst and Freelance Writer, particularly focusing on education and healthcare in Australia. Maitrayee's lifelong passions for writing and painting led her to pursue a full-time writing career. She is also the creator of a cooking YouTube channel, where she shares her culinary adventures. At Smartphone Thoughts, Maitrayee brings her expertise in technology to provide in-depth smartphone reviews and app-related statistics, making complex topics easy to understand for all readers.


