Retail Statistics By Market, Sales, Product Type And Technology (2025)
Updated · May 07, 2026


Table of Contents
- Introduction
- Editor’s Choice
- General Retail Statistics
- Retail Market Statistics
- Retail Sales Growth Statistics
- Retail Digital Ad Spending Statistics
- Retail Statistics By Product Type
- Retailer Consumer Statistics
- Most Valuable Retail Brand Statistics
- Social Media and Retail Statistics
- Artificial Intelligence and Retail Statistics
- Augmented Reality and Retail Statistics
- Buy Online, Pick Up in Store (BOPIS) And Retail Statistics
- Retail Statistics By Drivers Impact Analysis
- Retail Sales Share Statistics By Region
- Retailers With The Most Locations Statistics
- Retail Marketers And Tracking Consumers Statistics
- Retail Statistics By Types of Data Collected
- Retail Technology Statistics
- Recent Development of Retail Industry Statistics
- Conclusion
Introduction
Retail Statistics: Retailing refers to selling goods and services directly to consumers. Elaborating, retailers can directly purchase products and services from manufacturers or through wholesalers and then sell them to consumers, retaining their profits in the process.
The word retail comes from the Old French verb retaillier, meaning “to shape by cutting”, while in 1433, as a noun, the meaning changed to “a sale in small quantity”. The retail industry is undergoing significant evolution with the advancement of technology, shifting consumer habits, and broader market trends in sectors such as fashion, electronics, groceries, and lifestyle products.
This article examines the current state of global retail market analyses, its challenges, innovations, and the evolving expectations of today’s customers.
Editor’s Choice
- According to Infosys reports, the global retail industry market size is projected to reach around USD 35.2 trillion by the end of 2025.
- Mordor Intelligence further elaborates that in 2024, food, beverages, and groceries accounted for 52.12% of global retail sales.
- Pharmaceuticals and health products are expected to experience rapid growth, with a 10.01% annual growth rate until 2030.
- Supermarkets and hypermarkets held 36.63% of the retail market by sales channel, while online and mobile shopping is set to grow by 11.31% each year.
- North America led in revenue share (30.21%), but the Asia-Pacific region is growing the fastest at 9.19% annually.
- The Infosys report also states that retailers account for more than 25% of global emissions, while 56% are developing new climate-friendly products or services.
- In 2024, U.S. retail stores faced USD 685 billion in returned items.
- Out of this, USD 103 billion was lost to fraud and false claims, representing a USD 2 billion increase over the previous year.
- Emarketer predicts retail digital ad spending will increase by 10.6% in 2024.
- WebFX states that the retail industry is the largest private employer in the U.S., employing approximately 55 million people.
General Retail Statistics
- The WebFX report further states that in January 2025, approximately 30,000 new jobs were added to the retail trade sector.
- In the private sector, retail is the biggest employer, contributing approximately USD 5.3 trillion to the GDP each year.
- From Q3 2022 to Q4 2024, the total U.S. e-commerce has increased by 7.5%.
- As of 2024, the retail industry’s total returns reached up to USD 890 billion.
- Recently, 91% of consumers are buying products from retailers that have brand recognition, recommendations, and enable relevant offers.
- About 25% of Gen Z are more likely to purchase something if it has many likes or good reviews.
- Nearly 45% of people in the U.S. think that stores should promote and sell products from Black-owned brands.
- 4 out of 10 shoppers begin their shopping by doing a general search rather than looking for a specific product.
- Walmart holds the top spot as the biggest retail company in the world.
- People in the Asia-Pacific region are 13% more likely to pay full price for a product right away.
- In China, 84% of shoppers have made purchases through social media platforms.
Retail Market Statistics
(Source: mordorintelligence.com)
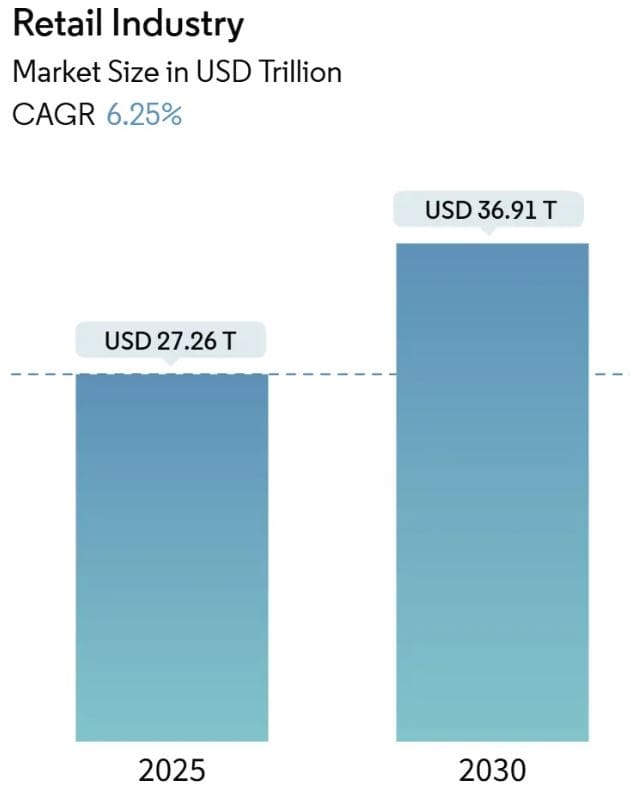
- The graph above indicates that by 2025, the retail industry’s market size is expected to reach USD 27.26 trillion.
- The compound annual growth rate of the market will grow at a CAGR of 6.25% from 2025 to 2030.
- Moreover, by 2030, the market is expected to reach a size of USD 36.91 trillion.
- According to Infosys reports, social commerce is expected to grow from USD 699 billion in 2024 to approximately USD 821 billion in sales by 2025.
- Forrester further states that by 2028, the global retail e-commerce sales will make around USD 6.8 trillion in revenue.
(Reference: cdn.shopify.com)
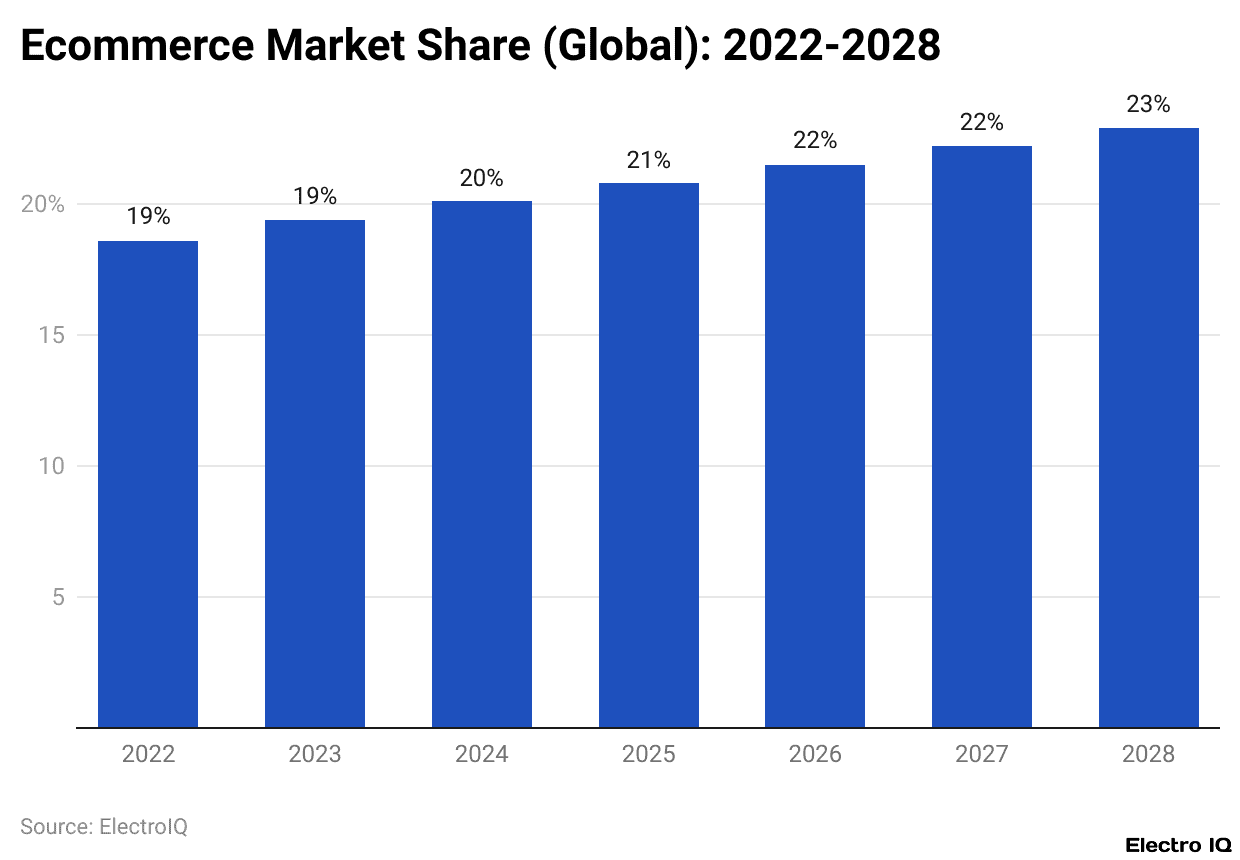
- The above graph indicates that in 2024, the e-commerce market captured a 20.1% market share and is expected to grow to 20.8% by the end of 2025.
- The market share is expected to reach 21.5% by 2026, followed by 22.1% by 2027, and 22.9% by 2028.
The table below shows the market share of e-commerce in the United States:
| Year | Market Share |
| 2024 | 16.2% |
| 2025 | 17.1% |
| 2026 | 18% |
| 2027 | 19% |
| 2028 | 20% |
Retail Sales Growth Statistics
(Reference: statista.com)
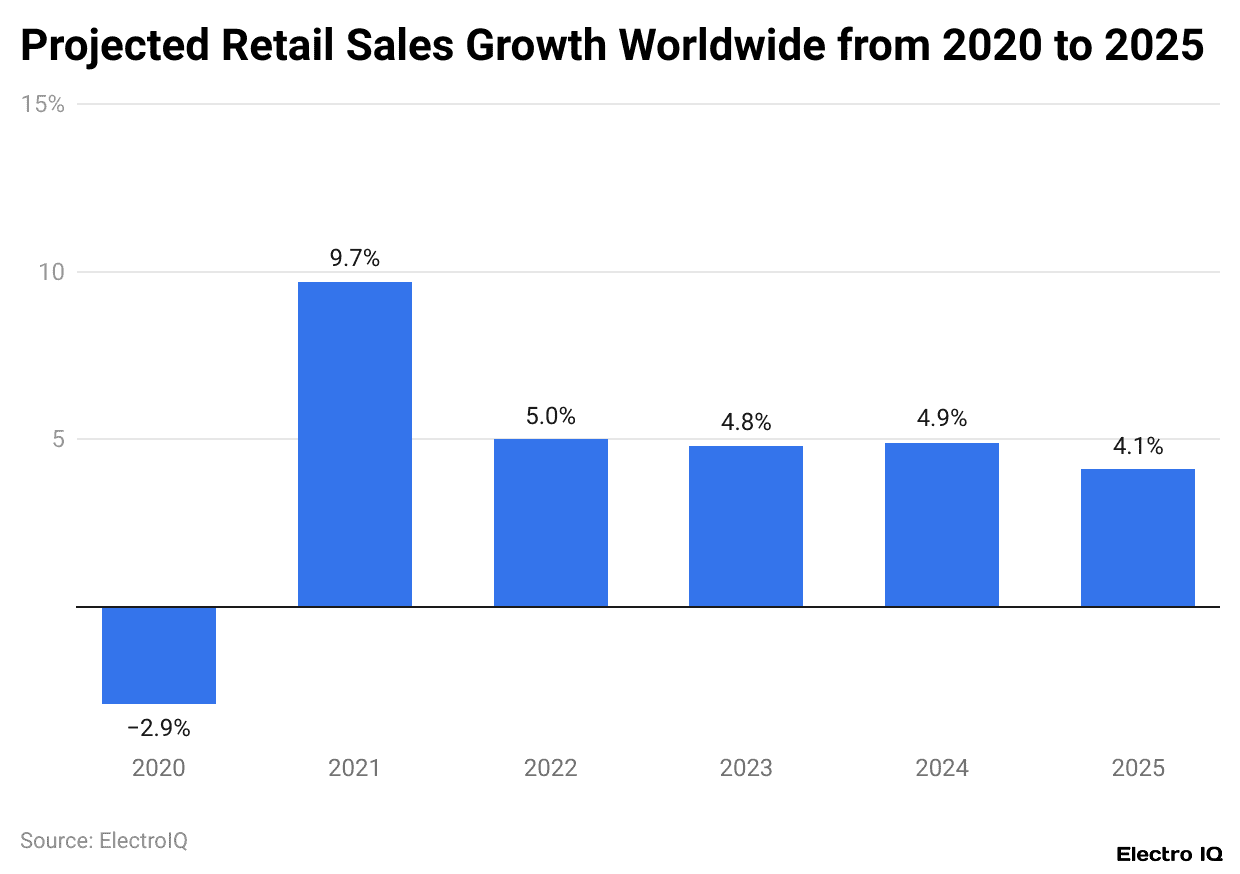
- In 2023, the global retail sales growth accounted for 4.8%, and in 2024, it reached 4.9%.
- By the end of 2025, the growth rate is projected to be 4.1%, reduced from last year.
Retail Digital Ad Spending Statistics
(Source: eMarketer.com)
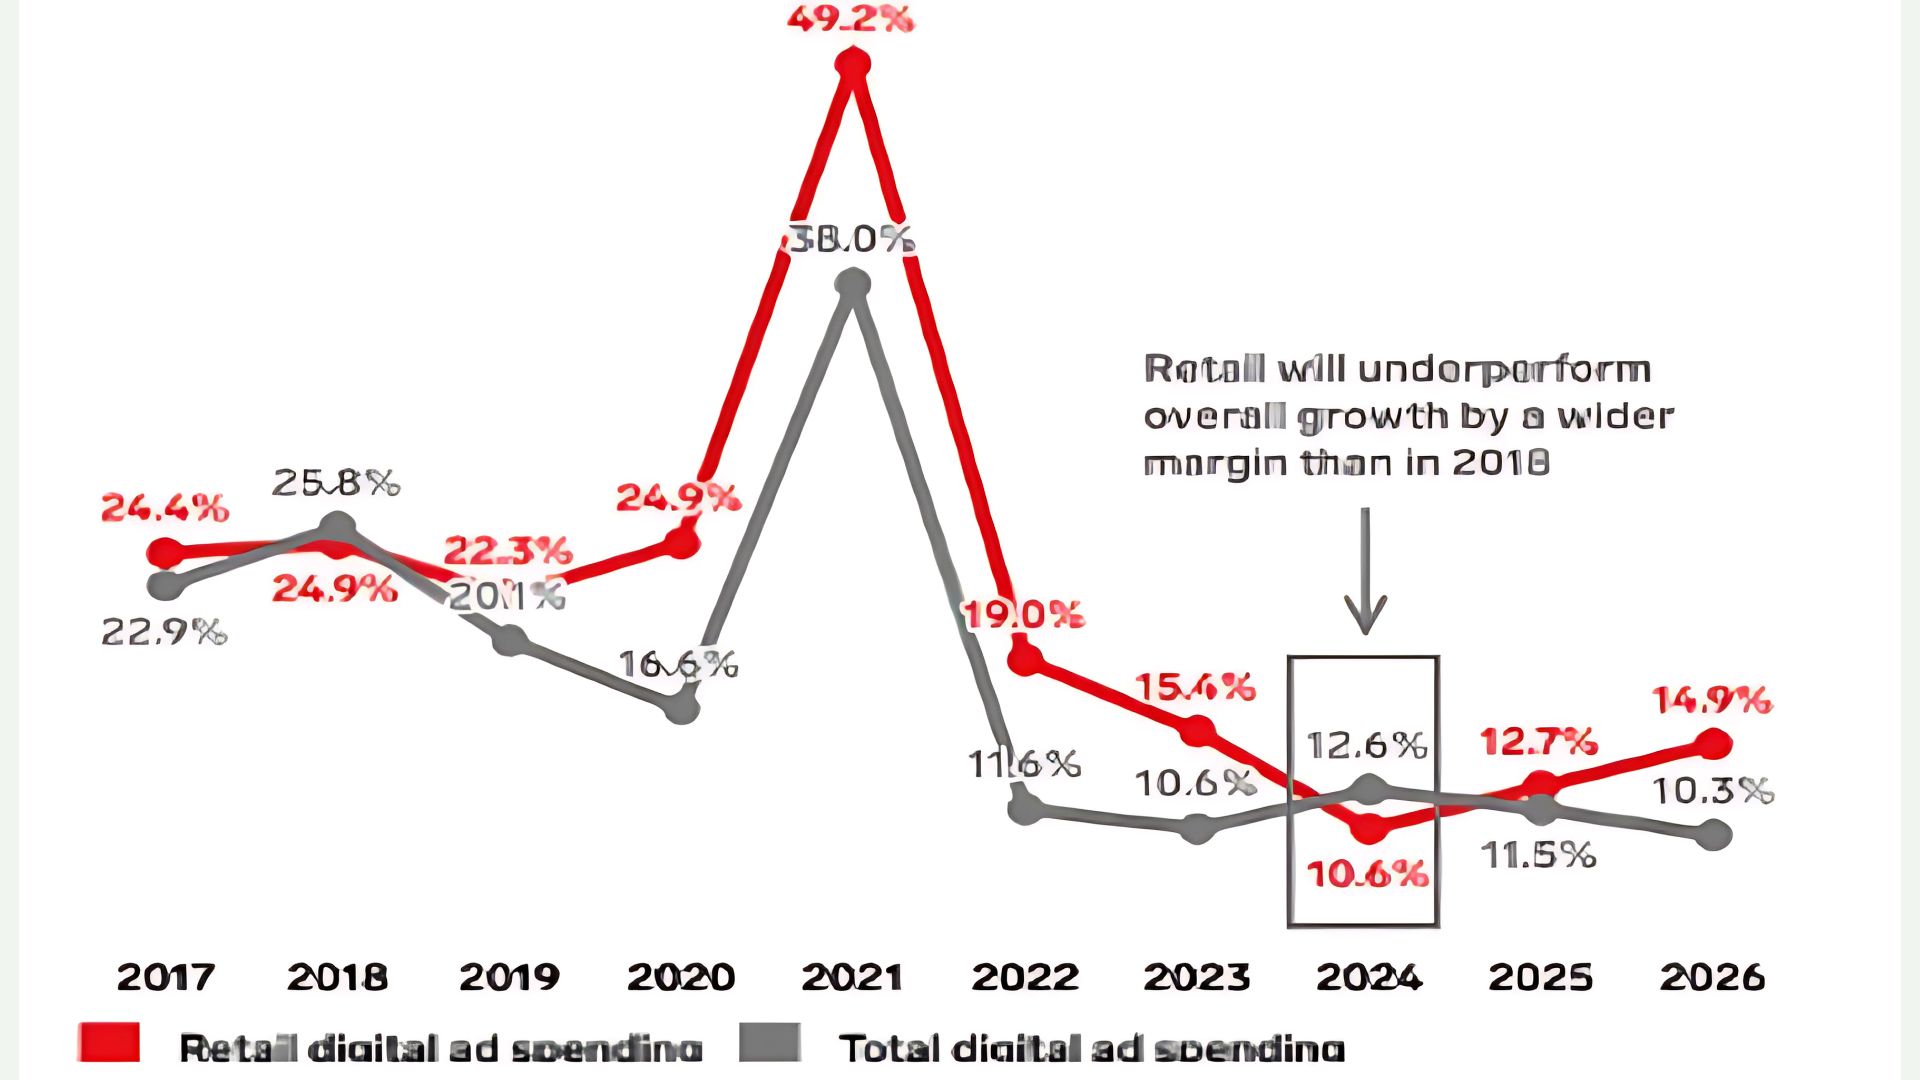
- The above graphical analysis indicates that retail digital ad spending is expected to increase by 10.6% in 2024.
- Meanwhile, it is expected to be higher in 2025 with a digital ad spending share of 12.7%, followed by 2026 (14.9%).
Retail Statistics By Product Type
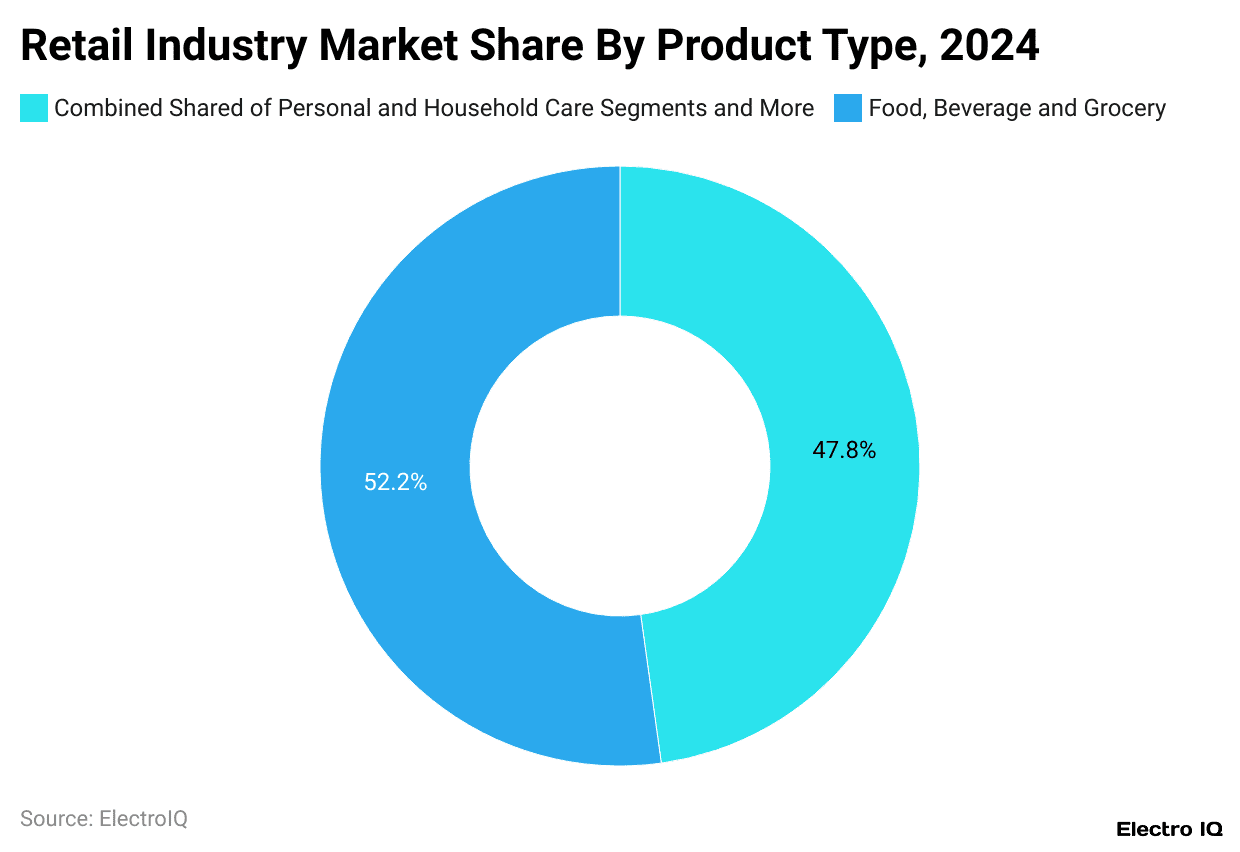
(Reference: mordorintelligence.com)
- Food, Beverage & Grocery retained a 52.12% slice of the global retail industry market share in 2024.
- Meanwhile, the personal and household care segment collectively captured a 47.8% share of the market.
By Distribution Channel
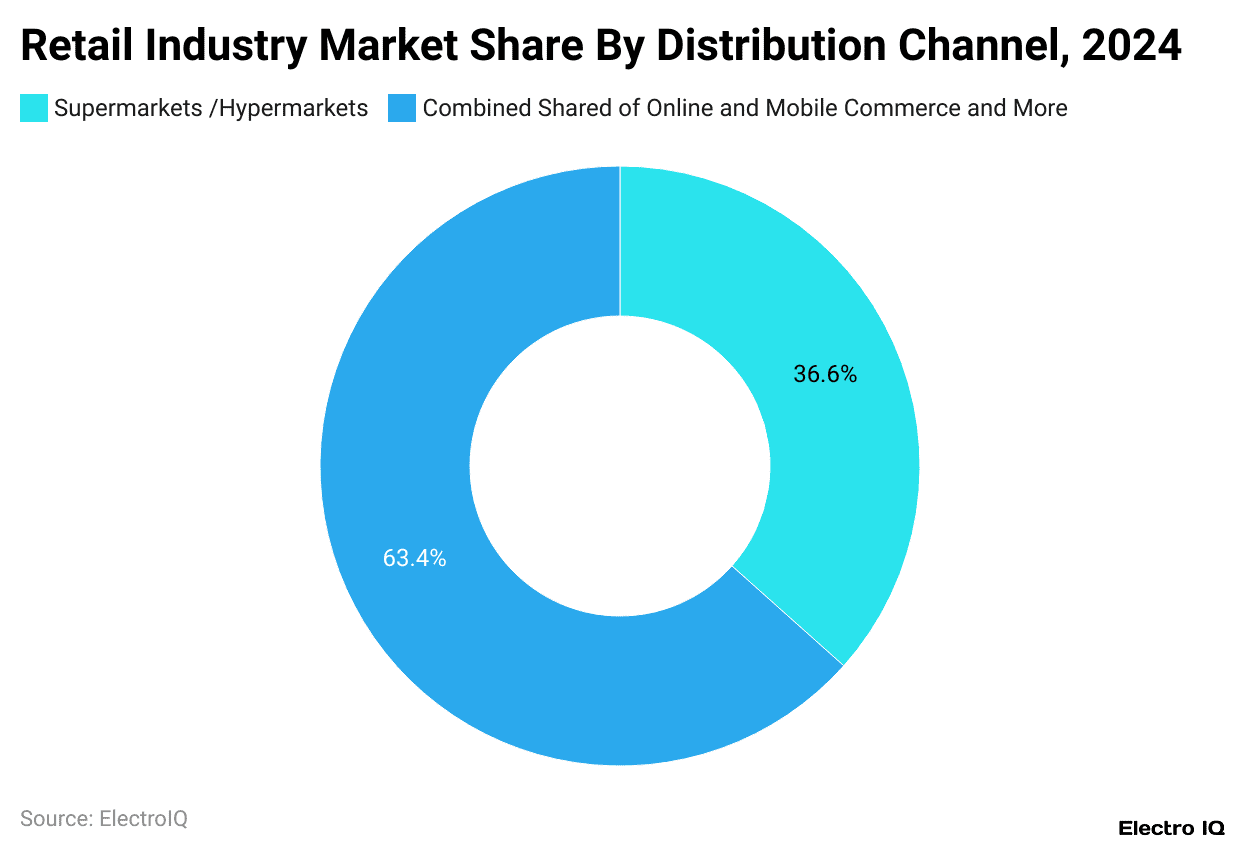
(Reference: mordorintelligence.com)
- Moreover, the largest retail market was captured by online and mobile commerce, accounting for a 36.63% share.
- Besides, supermarkets and Hypermarkets secured a market share of 36.63%.
Retailer Consumer Statistics
- According to Invoca reports, in recent years, before making an online purchase, nearly 81% of retail shoppers conduct online research.
- In which, for searching products, around 77% of shoppers use mobile devices.
The table below shows consumer shares who use search engines to research retail products:
| Retail products | Consumer Share |
| Appliance dealers | 78% |
| Auto dealers | 78% |
| Auto parts | 80% |
| Bicycle dealers | 79% |
| Carpet | 63% |
| Electronics | 76% |
| Florists | 78% |
| Furniture | 73% |
| Garden/lawn equipment | 69% |
| Hardware | 69% |
| Jewelers | 73% |
| Lumber | 70% |
| Mattresses | 79% |
| Motorcycles | 76% |
| Musical Instruments | 78% |
| Optical Goods | 74% |
| Pharmacies | 62% |
| Pizza | 62% |
| Restaurants | 74% |
| Tire Dealers | 76% |
| Water heaters | 94% |
| Windows | 66% |
Most Valuable Retail Brand Statistics
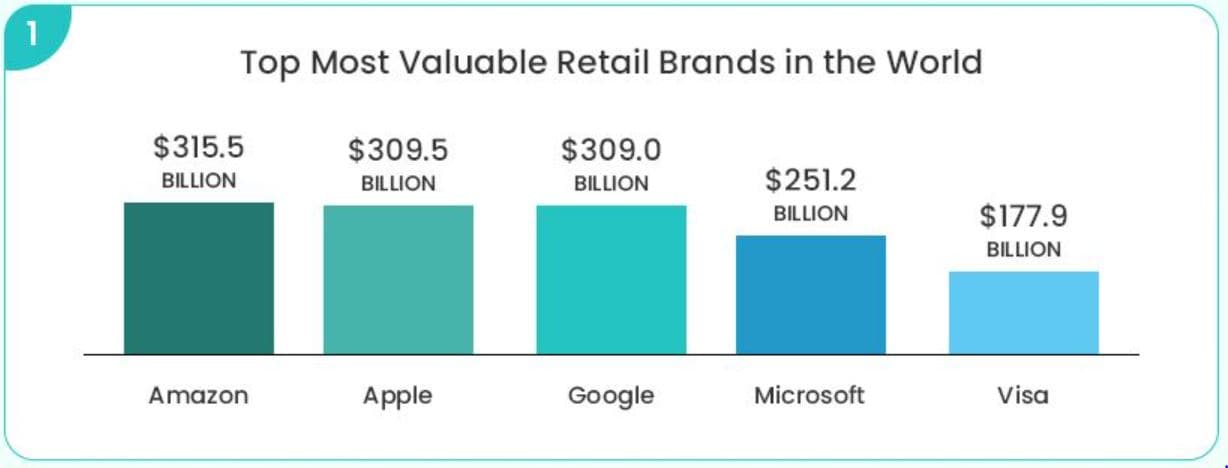
(Source: cloudfront.net)
- In 2025, Amazon is expected to be the most valuable retail brand, with a brand valuation of USD 315.5 billion, followed by Apple with USD 309.5 billion.
- The next three retail brands, in order, are Google (USD 309 billion), Microsoft (USD 251.2 billion), and Visa (USD 177.9 billion).
Social Media and Retail Statistics
- WebFX report shows that by the end of 2025, more than 53% of global consumers will be shopping via social platforms.
- In the United States, Facebook is the top social commerce platform, with 63.5 million buyers.
- Meanwhile, Instagram has almost 41 million social buyers in the country.
- By 2025, the U.S. social commerce industry is expected to reach around USD 79 billion.
- In contrast, the American livestreaming market is projected to account for 20% of e-commerce sales by 2026.
Artificial Intelligence and Retail Statistics
- As of 2025, AI automation is going to be adopted by 80% of retail executives in global organisations.
- Moreover, to date, 87% of retailers have claimed that they have already adopted at least one AI automation solution.
- In the United States, the retail market is projected to reach a revenue of USD 17.76 billion by the end of 2032, driven by the adoption of AI.
- Companies that use smart digital personalisation tools grow their revenue 6% to 10% faster than others.
- Only 3% of customers are comfortable using AI chatbots for customer support.
Augmented Reality and Retail Statistics
- In 2025, retailers offering AR experiences are preferred by 61% of consumers, according to reports from WebFX.
- Active AR user devices are estimated to reach 1.4 billion.
- More than 50% of all consumers are spending more on AR-based retailers.
- As of 2025, the market valuation of the AR market is expected to reach USD 32 billion and is estimated to exceed USD 50 billion by 2027.
Buy Online, Pick Up in Store (BOPIS) And Retail Statistics
- About 85% of U.S. shoppers who use BOPIS end up buying something extra when they visit the store.
- Nearly two-thirds of retailers already offer or are planning to offer this option.
- In 2024, around 50% of users choose BOPIS for convenience, while 46% use it to save time.
- Additionally, 51% of shoppers use their phones in-store, and 55% prefer to check product availability online before visiting nearby stores.
Retail Statistics By Drivers Impact Analysis
| Factors | CAGR (2025 to 2030) |
|
Rise of e-commerce and omnichannel retailing |
+1.8% |
| Growing urban middle class in emerging markets |
+1.2% |
|
AI-powered personalisation and retail analytics |
+0.9% |
| Expansion of quick-commerce and last-mile logistics |
+0.7% |
|
Retail-media network monetisation boom |
+0.5% |
| Gen-Z “shoppertainment” social commerce |
+0.4% |
By Restraints Impact Analysis
| Factors | CAGR (2025 to 2030) |
|
Supply-chain disruptions and freight volatility |
-08% |
| Margin Squeeze from Price Wars |
-0.6% |
|
Escalating Data-Privacy Regulation |
-0.4% |
| Tech-Talent Shortage for Automation Roll-outs |
-0.3% |
- North America accounts for the largest share of global retail sales, at 47.9%.
- Next comes Europe with 33.2%, followed by Asia Pacific at 15.7%.
- Latin America accounts for 1.7%, while Africa and the Middle East collectively account for the smallest portion, at 1.3%.
Retailers With The Most Locations Statistics
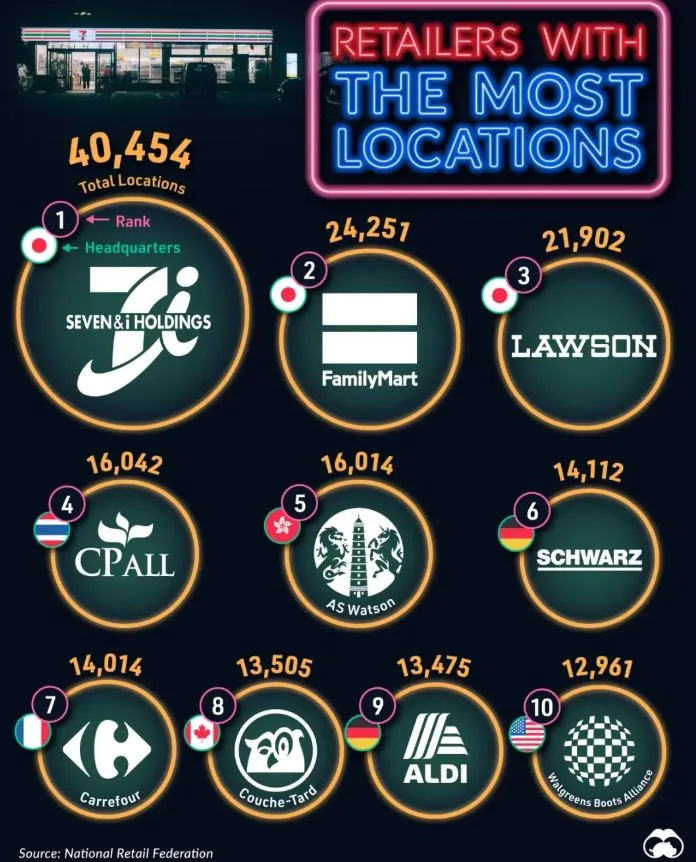
(Source: voronoiapp.com)
| Retailer | Headquarters | Number of retail stores |
| Seven & I |
Japan
|
40,454 |
| FamilyMart | 24,251 | |
| Lawson | 21,902 | |
| CP All | Thailand | 16,042 |
| AS Watson | Hong Kong | 16,014 |
| Schwarz Group | Germany | 14,112 |
| Carrefour | France | 14,014 |
| Couche-Tard | Canada | 13,505 |
| Aldi | Germany | 13,475 |
| Walgreens Boots Alliance | America | 12,961 |
Retail Marketers And Tracking Consumers Statistics
![]()
(Source: website-files.com)
- Around 38.2% can only track some consumers some of the time, while 30.9% of retailers say they cannot track consumers across devices.
- Additionally, most of the time, 10.6% of retailers can track some consumers, while 12.2% of them can track most consumers.
- Followed by 4.9% of retailers can track most consumers some of the time, and 2.4% of retailers can track all consumers every time. And 0.9% of retailers can track all consumers at some times.
Retail Statistics By Types of Data Collected
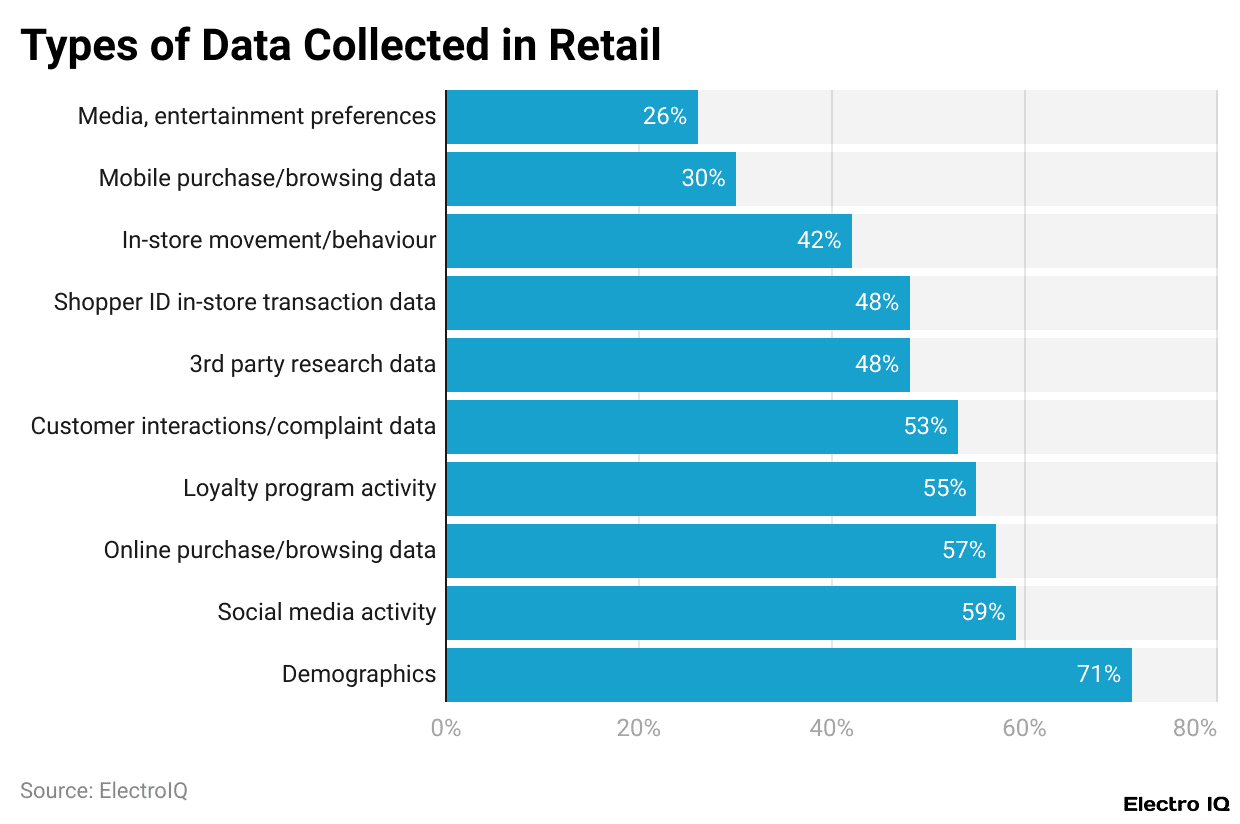 (Reference: scoop.market.us)
- The above graph shows that demographic data takes the lead, comprising a substantial 71% of the information gathered.
- Social media activity, Online purchase and browsing data, and Loyalty program activity data closely follow, with shares of 59%, 57%, and 55%, respectively.
- Furthermore, other types of data collected in this industry are customer interactions/complaint data (53%), third-party research data (48%), shopper ID in-store transaction data (48%), in-store movement and behavior (42%), mobile purchase and browsing data (30%), and media and entertainment preferences (26%).
Retail Technology Statistics
- According to Radix’s 2025 report, almost 55% of smart speaker owners plan to make purchases using voice searches.
- While purchasing online products, 4 out of 10 users are using QR codes each month.
- If products are customised with AR, then 405 of retail customers are willing to pay more while purchasing.
- Meanwhile, in cases where retailers are implementing AR, 71% of customers said they would shop more.
- In contrast, more than 42% of consumers claimed that AI can lead to faster checkouts.
- By 2032, the market size of AI in retail and e-commerce is expected to reach USD 325 billion.
Recent Development of Retail Industry Statistics
- In May 2025, Dick’s Sporting Goods announced it would buy Foot Locker for USD 2.4 billion, creating a massive global sports retail chain with 2,400 stores.
- In June 2025, Starbucks tested a new AI tool called “Green Dot Assist,” built using Azure OpenAI, which was deployed in 35 stores to reduce drink preparation time to just four minutes.
- At the same time, Ocado began building a robotic fulfilment centre in Catalonia for Spanish retailer Bon Preu, along with expanding its tech automation into Europe.
- Coinbase also launched a new stablecoin-based payment system, designed for the USD 6 trillion global e-commerce market.
Conclusion
Following the completion of the article on Retail Statistics, the global retail industry is continuing to grow, driven by the adoption of advanced technologies and shifting consumer demands. Leading brands such as Amazon, Apple, and Google dominate global brand value rankings, reflecting their strong market influence and digital innovation.
This article encompasses all current analyses, including market size, sales, demand, influencing factors, product types, distribution, country segmentation, and recent developments. All the above information will remain beneficial for understanding the current scenario of the retail industry.
FAQ.
The life cycle involves four stages: innovation, growth, maturity, and decline.
The biggest ongoing problems are frequent staff turnover, changing customer needs, outdated HR tools, and increasing operational costs.
Sales per square foot, gross margins, return on investment, average transaction value, customer retention, conversion rate, foot traffic, digital traffic, and inventory turnover.
The top three basic and important requirements of retail are pricing, location, and merchandise.
The 5Ps of retail are product, price, place, promotion and people.

Tajammul Pangarkar is the co-founder of a PR firm and the Chief Technology Officer at Prudour Research Firm. With a Bachelor of Engineering in Information Technology from Shivaji University, Tajammul brings over ten years of expertise in digital marketing to his roles. He excels at gathering and analyzing data, producing detailed statistics on various trending topics that help shape industry perspectives. Tajammul's deep-seated experience in mobile technology and industry research often shines through in his insightful analyses. He is keen on decoding tech trends, examining mobile applications, and enhancing general tech awareness. His writings frequently appear in numerous industry-specific magazines and forums, where he shares his knowledge and insights. When he's not immersed in technology, Tajammul enjoys playing table tennis. This hobby provides him with a refreshing break and allows him to engage in something he loves outside of his professional life. Whether he's analyzing data or serving a fast ball, Tajammul demonstrates dedication and passion in every endeavor.