AI Governance Statistics By Market Size, Corporate Governance and Adoption, Funding, Trends And Facts (2025)
Updated · Oct 23, 2025

Table of Contents
- Introduction
- Editor’s Choice
- AI Governance Market Size
- United States AI Governance Market Size
- AI Governance Market Share Statistics By Region
- Global Responsible AI Governance Consulting Market Size
- Regulation and Enforcement Capacity
- Public Sector Transparency and Controls
- Corporate Governance and Adoption
- AI Governance Pillar Scores Statistics
- Country-Wise Government AI Readiness Index Statistics, 2024
- Category-Wise AI Governance Funding Statistics
- AI Governance – Board Readiness By Sector
- Conclusion
Introduction
AI Governance Statistics: AI governance is shifting from slide decks to day-to-day practice as pilots become real products. This article gathers statistics on how teams, regulators, and auditors set guardrails for model risk, compliance, and accountability. Expect figures on framework uptake, EU AI Act readiness, NIST AI RMF, and ISO/IEC 23894, plus the spread of model inventories and risk registers, red-teaming and bias/robustness tests, incident reporting, and executive ownership of Responsible AI.
We also quantify practical controls: model cards and fact sheets, human-in-the-loop checkpoints, third-party due diligence, privacy and data-provenance safeguards, explainability coverage, and audit cadence. This article on AI Governance Statistics includes several statistical analyses and current data from different insights that will help in understanding the topic better.
Editor’s Choice
- According to Precedence Research, the global market size of AI Governance is expected to be around USD 309.01 million by 2025, which is an increase from 2024, resulting in USD 227.65 million.
- As of 2025, North America led the AI governance market, taking a 40% share.
- By component, the software segment accounted for 66% in 2024.
- In the same period, based on deployment, on-premises models delivered 53% of market share.
- By organisation size, large enterprises dominated, generating 70% of spending in 2024 across key adoption metrics.
- The Market.us report further states that the global Responsible AI Governance Consulting market size is expected to reach around USD 394.7 million by 2025.
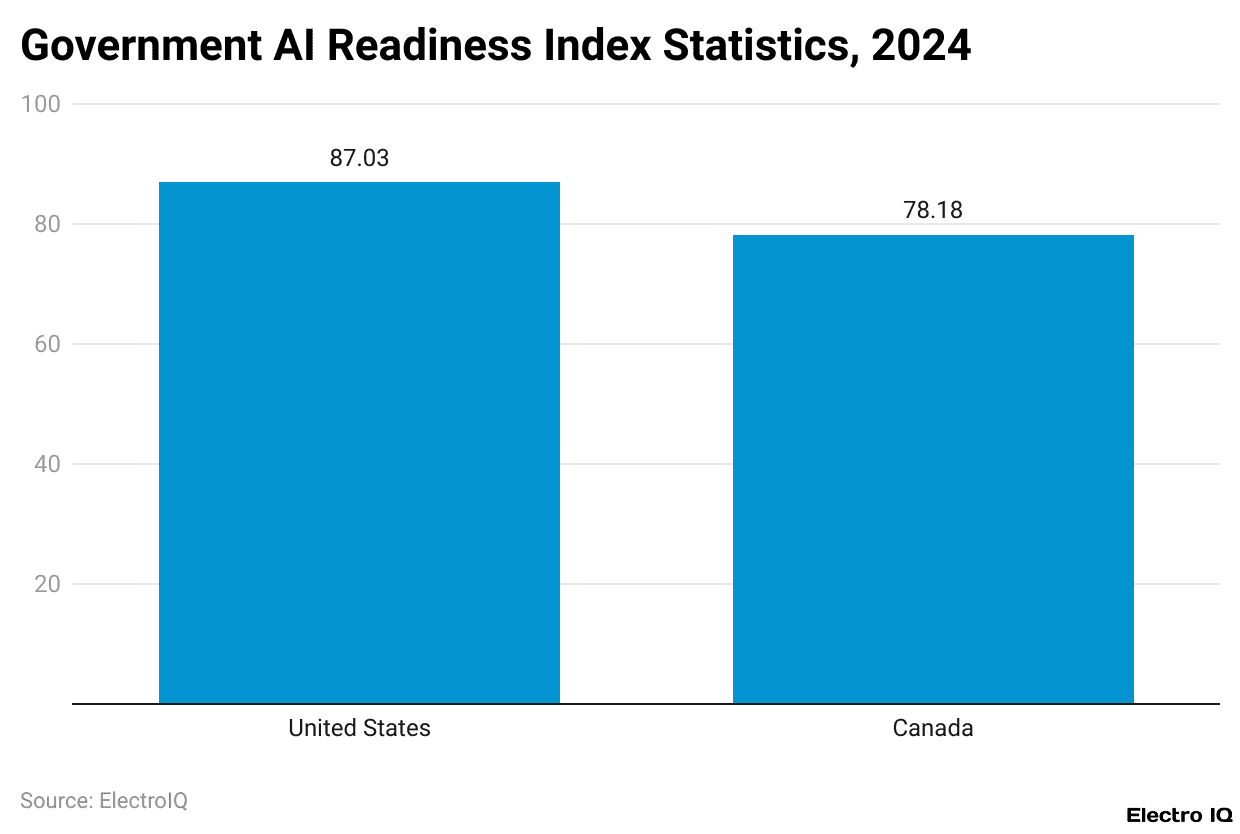
- Oxfordinsights.com report further states that North America leads the Government AI Readiness Index, with the United States scoring 87.03.
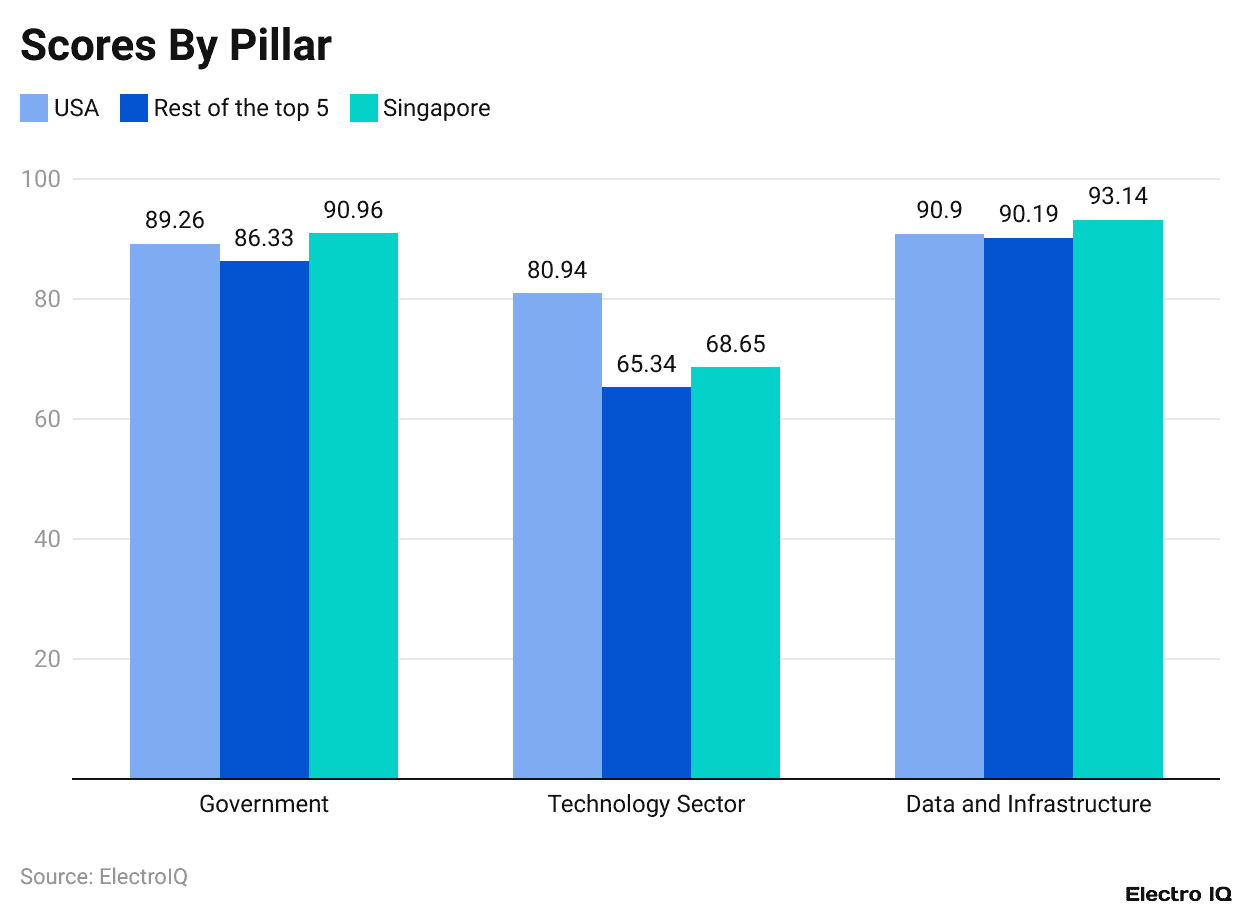
- In Government, Singapore gained the highest score of 90.96 in 2024, followed by the U.S. at 89.26 and rest of the top 5 at 86.33.
- In the U.S. Government Accountability Office, federal agencies’ reported AI use cases nearly doubled from 571 (2023) to 1,110 (2024), while generative-AI cases jumped from 32 to 282 across 11 agencies.
- McKinsey’s 2025 State of AI survey says 28% of AI-using organisations put the CEO in charge of governance and 17% assign oversight to the board.
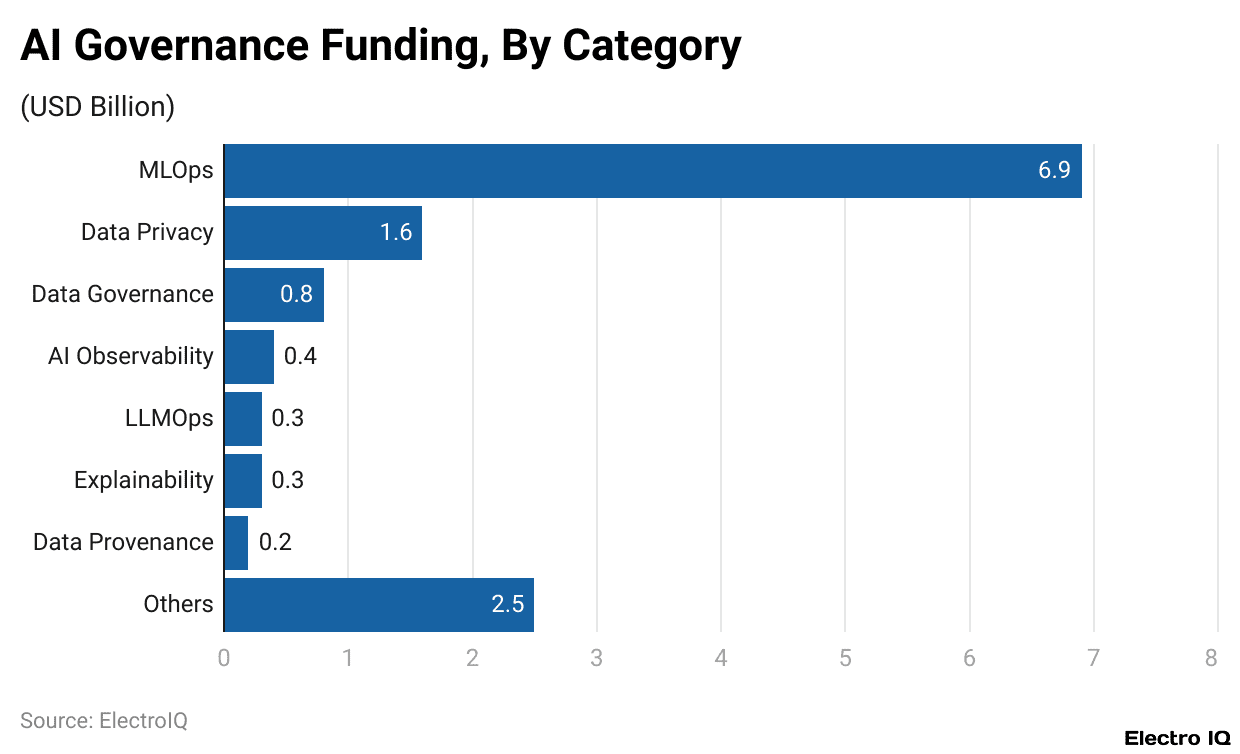
- By the end of 2023. MLOps attracted the most AI-governance funding at USD 6.9 billion.
AI Governance Market Size
(Reference: precedenceresearch.com)
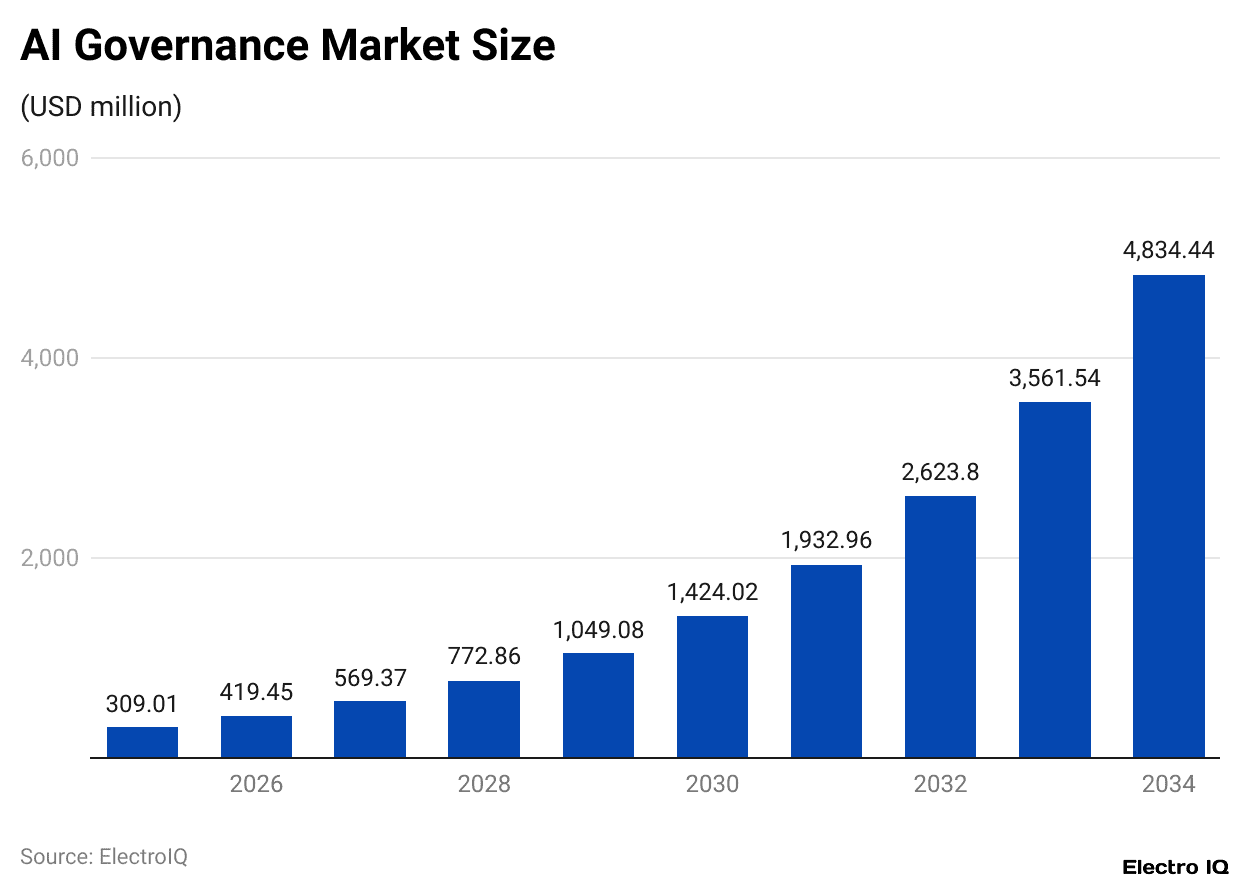
- The global market size of AI Governance is expected to reach up to USD 309.01 million by 2025, an increase from 2024, resulting in USD 227.65 million.
- In the coming years, the market size will reach up to USD 419.45 million by 2026, followed by USD 569.37 million (2027), USD 772.86 million (2028), USD 1,049.08 million (2029), USD 1,424.02 million (2030), USD 1,932.96 million (2031), USD 2,623.80 million (2032), USD 3,561.54 million (2033), and USD 4,834.44 million (2034).
- The market will expand with a CAGR of 35.74% from 2025 to 2034.
United States AI Governance Market Size
(Reference: precedenceresearch.com)
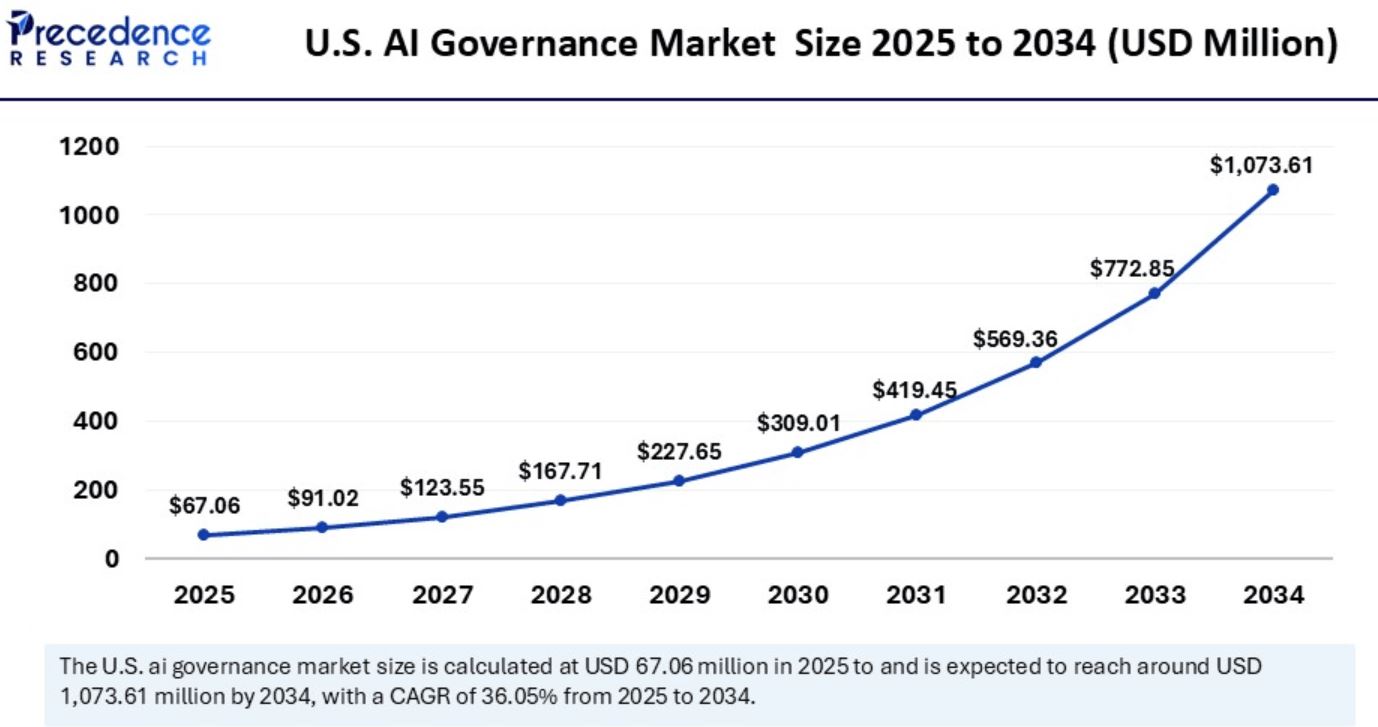
- The U.S.’s AI Governance market valuation will reach around USD 67.06 million by 2025.
- Furthermore, in the coming year, the market sizes are estimated as 91.02 million (2026), USD 123.55 million (2027), USD 167.71 million (2028), USD 227.65 million (2029), USD 309.01 million (2030), USD 419.45 million (2031), USD 569.36 million (2032), USD 772.85 million (2033), and USD 1,073.61 million (2034).
- The compound annual growth rate of the market will grow by 36.05% from 2025 to 2034.
(Reference: coherentmarketinsights.com)
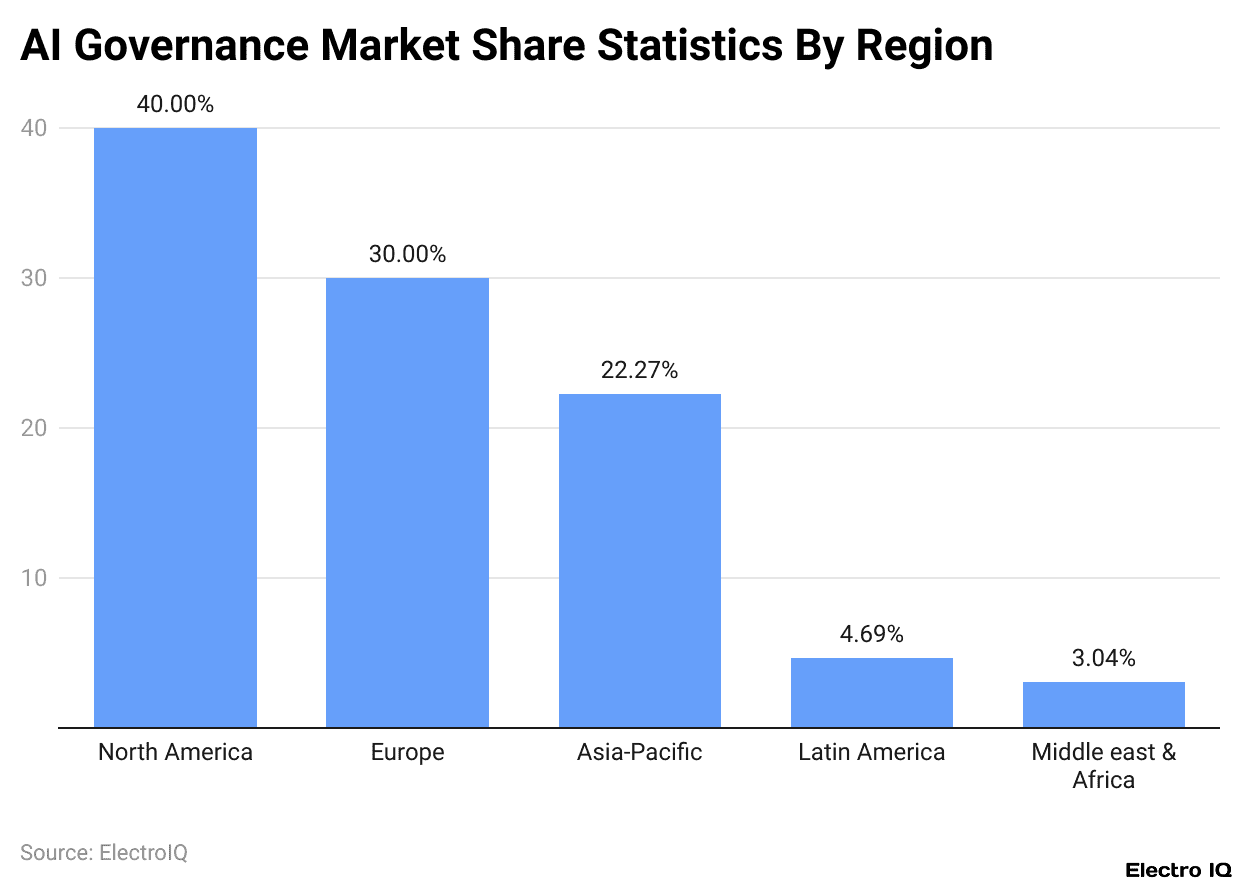
- As of 2025, the North American region captured the highest market share of AI governance with 40%, followed by Europe with 30%.
- Moreover, the market shares of other regions are mentioned as Asia Pacific (22.27%), Latin America (4.69%), and the Middle East & Africa (3.04%).
By Components
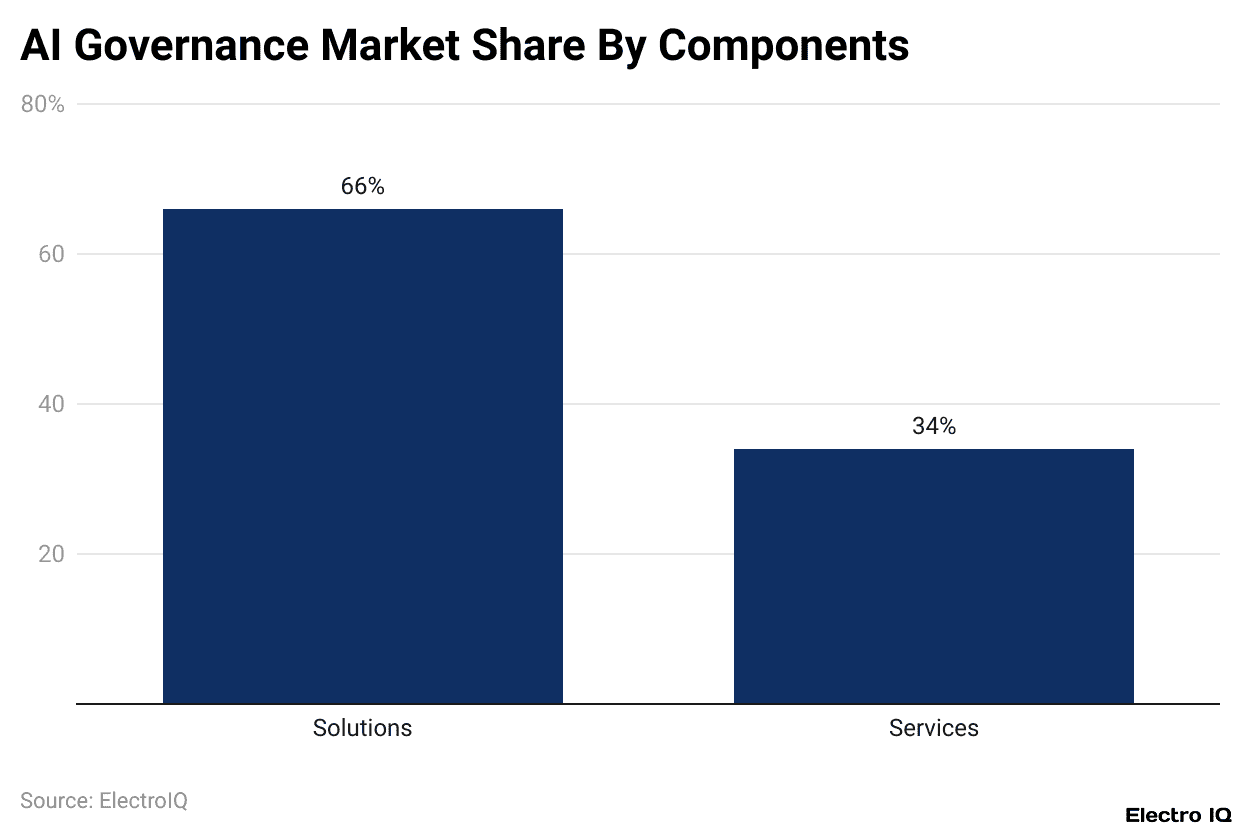
(Reference: precedenceresearch.com)
- AI Governance Statistics also show that in 2024, the solution segment of the AI Governance market accounted for a share of 66%.
- Besides, the service segment captured a share of 34%.
By Deployment Mode
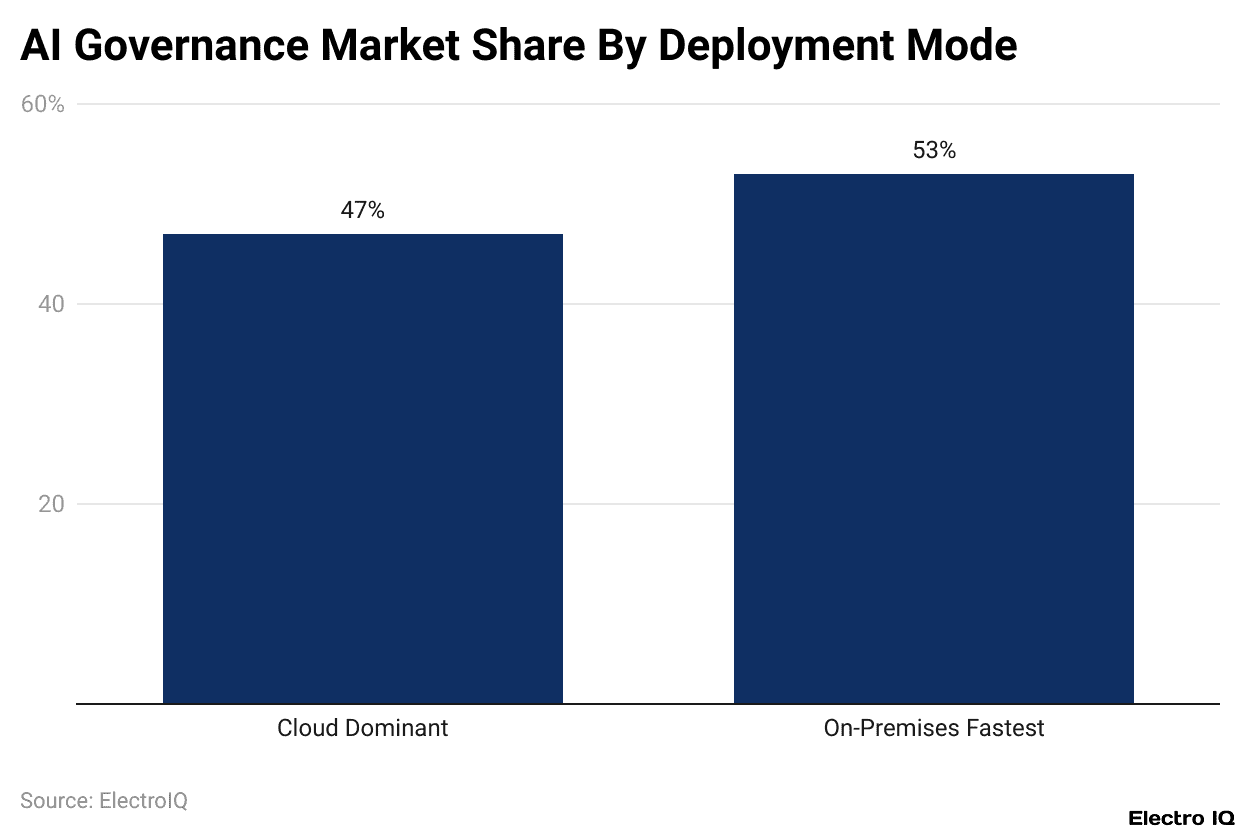
(Reference: precedenceresearch.com)
- The on-premises segment captures the highest share of 53% in 2024.
- Meanwhile, the Cloud Dominant segment made up the remaining share of 47%.
By Organisation Size
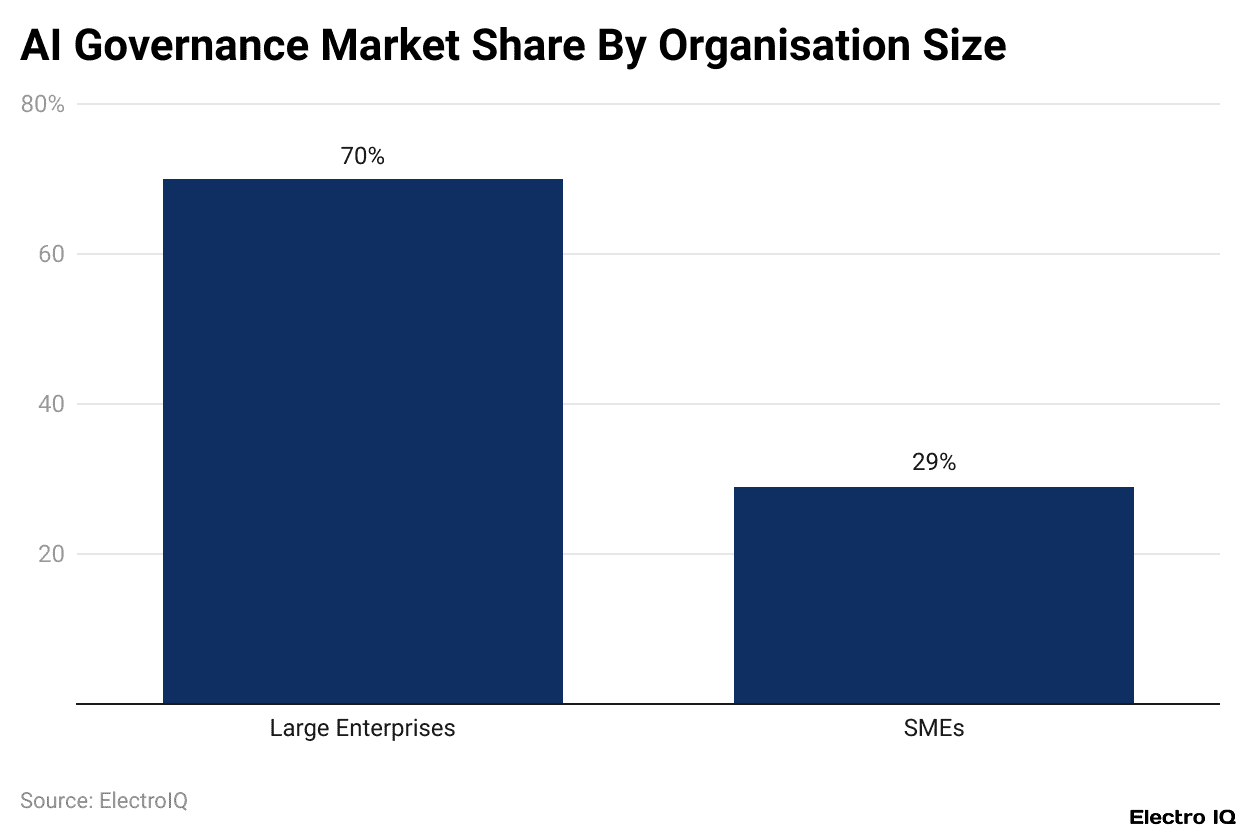
(Reference: precedenceresearch.com)
- In AI Governance, the highest market share was held by the large enterprises with 70%.
- On the other hand, small & medium enterprises accounted for 29% of the share.
Global Responsible AI Governance Consulting Market Size
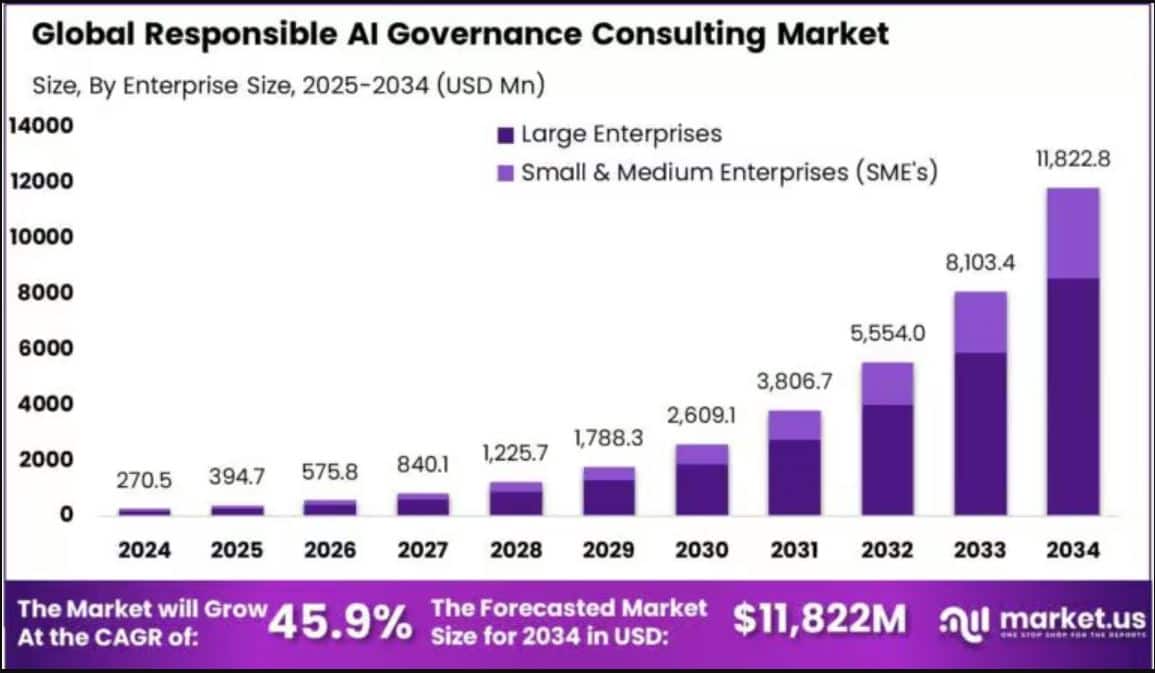
- The global Responsible AI Governance Consulting market size is expected to reach around USD 394.7 million by 2025.
- Furthermore, the estimated market valuation in the coming years is as follows: USD 575.8 million (2026), USD 840.1 million (2027), USD 1,225.7 million (2028), USD 1,788.3 million (2029), USD 2,609.1 million (2030), USD 3,806.7 million (2031), USD 5,554 million (2032), USD 8,103.4 million (2033), and USD 11,822.8 million (2034).
- The market is expected to reflect a CAGR of 45.90% from 2025 to 2034.
- In 2024, Risk Management Consulting led the field, taking over 30.7% of the market.
- Large Enterprises dominated with more than 72.5% share, while the BFSI sector contributed over 28.6%.
- North America was ahead, holding more than 38.4% and generating about USD 103.8 million.
- The United States alone was valued at USD 83.1 million in 2024 and is projected to grow at a strong 35.8% CAGR in the Responsible AI Governance Consulting market.
Regulation and Enforcement Capacity
- According to the European Commission’s EU Digital Strategy, the EU AI Act took effect on August 1, 2024.
- Bans on “unacceptable-risk” AI begin Feb 2, 2025, generative-AI transparency rules (GPAI) start Aug 2, 2025, and most high-risk requirements roll in between Aug 2, 2026, and Aug 2, 2027 (European Commission).
- The European Parliament states penalties can reach €35 million or 7% of global turnover for prohibited uses, €15 million or 3% for other breaches, and €7.5 million or 1% for misleading information (European Parliament).
- The EU AI Office has “more than 125 staff,” with additional hiring planned in 2025.
Public Sector Transparency and Controls
- In the U.S. Government Accountability Office, federal agencies’ reported AI use cases nearly doubled from 571 (2023) to 1,110 (2024), while generative-AI cases jumped from 32 to 282 across 11 agencies.
- In the UK, the Algorithmic Transparency Recording Standard is mandatory across central government, with 59 records published by May 8, 2025.
- On July 16, 2025, the Netherlands’ National Algorithm Register logged in its 1,000th public-sector algorithm.
- Canada’s Algorithmic Impact Assessment contains 65 risk and 41 mitigation questions and is required for automated decision systems.
Corporate Governance and Adoption
- McKinsey’s 2025 State of AI survey says 28% of AI-using organisations put the CEO in charge of governance and 17% assign oversight to the board.
- Stanford HAI’s 2025 AI Index reports that enterprise AI usage reached 78% in 2024.
- IBM’s 2025 Cost of a Data Breach finds 13% of organisations suffered breaches involving AI models/apps, and 97% of those lacked proper AI access controls.
AI Governance Pillar Scores Statistics
(Reference: oxfordinsights.com)
- In 2024’s Government pillar, Singapore ranked top with 90.96, followed by the U.S. (89.26), and the remaining top five averaged 86.33.
- In the Technology Sector pillar, the U.S. ( 80.94), Singapore’s (68.65), and an average of 65.34 for the others.
- For Data and Infrastructure, Singapore secured the highest score of 93.14, followed by the U.S (90.90), and the rest ( 90.19).
Country-Wise Government AI Readiness Index Statistics, 2024
In North America:
(Reference: oxfordinsights.com)
- North America leads the Government AI Readiness Index, with the United States scoring 87.03 (1st) and Canada 78.18 (6th) globally.
In Western Europe:
| Country | Government AI Readiness Index |
| France | 79.36 |
| United Kingdom | 78.88 |
| Netherlands | 77.23 |
| Germany | 76.90 |
| Finland | 76.48 |
| Norway | 76.12 |
| Sweden | 75.4 |
| Denmark | 74.71 |
| Ireland | 73.18 |
| Austria | 72.84 |
In Eastern Europe:
| Country | Government AI Readiness Index |
| Estonia | 72.62 |
| Czechia | 70.23 |
| Lithuania | 67.8 |
| Poland | 67.51 |
| Slovenia | 65.85 |
| Russian Federation | 64.72 |
| Slovakia | 63.69 |
| Hungary | 63.63 |
| Latvia | 61.87 |
| Bulgaria | 60.64 |
In East Asia:
| Country | Government AI Readiness Index |
| Singapore | 84.25 |
| Republic of Korea | 79.98 |
| Japan | 75.75 |
| Taiwan | 74.58 |
| China | 72.01 |
| Malaysia | 71.40 |
| Thailand | 66.17 |
| Indonesia | 65.85 |
| Vietnam | 61.42 |
| Philippines | 58.51 |
In the Middle East and North Africa:
| Country | Government AI Readiness Index |
| United Arab Emirates | 75.66 |
| Israel | 74.52 |
| Saudi Arabia | 72.36 |
| Qatar | 68.22 |
| Oman | 62.91 |
| Jordan | 61.57 |
| Egypt | 55.63 |
| Bahrain | 54.33 |
| Kuwait | 51.26 |
| Lebanon | 46.67 |
In Latin America and the Caribbean
| Country | Government AI Readiness Index |
| Brazil | 65.89 |
| Chile | 63.19 |
| Uruguay | 62.21 |
| Colombia | 59.33 |
| Peru | 57.11 |
| Costa Rica | 56.85 |
| Argentina | 56.40 |
| Mexico | 53.29 |
| Dominican Republic | 52.69 |
| Cuba | 42.43 |
In the Pacific:
| Country | Government AI Readiness Index |
| Australia | 76.45 |
| New Zealand | 63.98 |
| Fiji | 44.22 |
| Vanuatu | 39.04 |
| Tonga | 38.63 |
| Marshall Island | 37.62 |
| Samoa | 37.16 |
| Kiribati | 34.45 |
| Solomon Islands | 32.71 |
In South and Central Asia:
| Country | Government AI Readiness Index |
| India | 62.81 |
| Turkiye | 60.63 |
| Uzbekistan | 53.45 |
| Kazakhstan | 51.41 |
| Bangladesh | 47.12 |
| Georgia | 46.92 |
| Sri Lanka | 45.29 |
| Armenia | 44.51 |
| Pakistan | 40.47 |
In Sub-Saharan Africa:
| Country | Government AI Readiness Index |
| Mauritius | 53.94 |
| South Africa | 52.91 |
| Rwanda | 51.25 |
| Senegal | 46.11 |
| Seychelles | 44.77 |
| Kenya | 43.56 |
| Nigeria | 43.33 |
| Ghana | 43.3 |
| Benin | 42.97 |
Category-Wise AI Governance Funding Statistics
(Reference: marketsandmarkets.com)
- By the end of 2023, MLOps attracted the most AI-governance funding at USD 6.9 billion.
- Furthermore, others are stated as data privacy with USD 1.6 billion funding, followed by data governance (USD 0.8 billion), AI observability (USD 0.4 billion), LLMOps and model explainability (USD 0.3 billion each), and data provenance (USD 0.2 billion).
- The rest captured a smaller funding of USD 2.5 billion.
AI Governance – Board Readiness By Sector
(Reference: corpgov.law.harvard.edu)
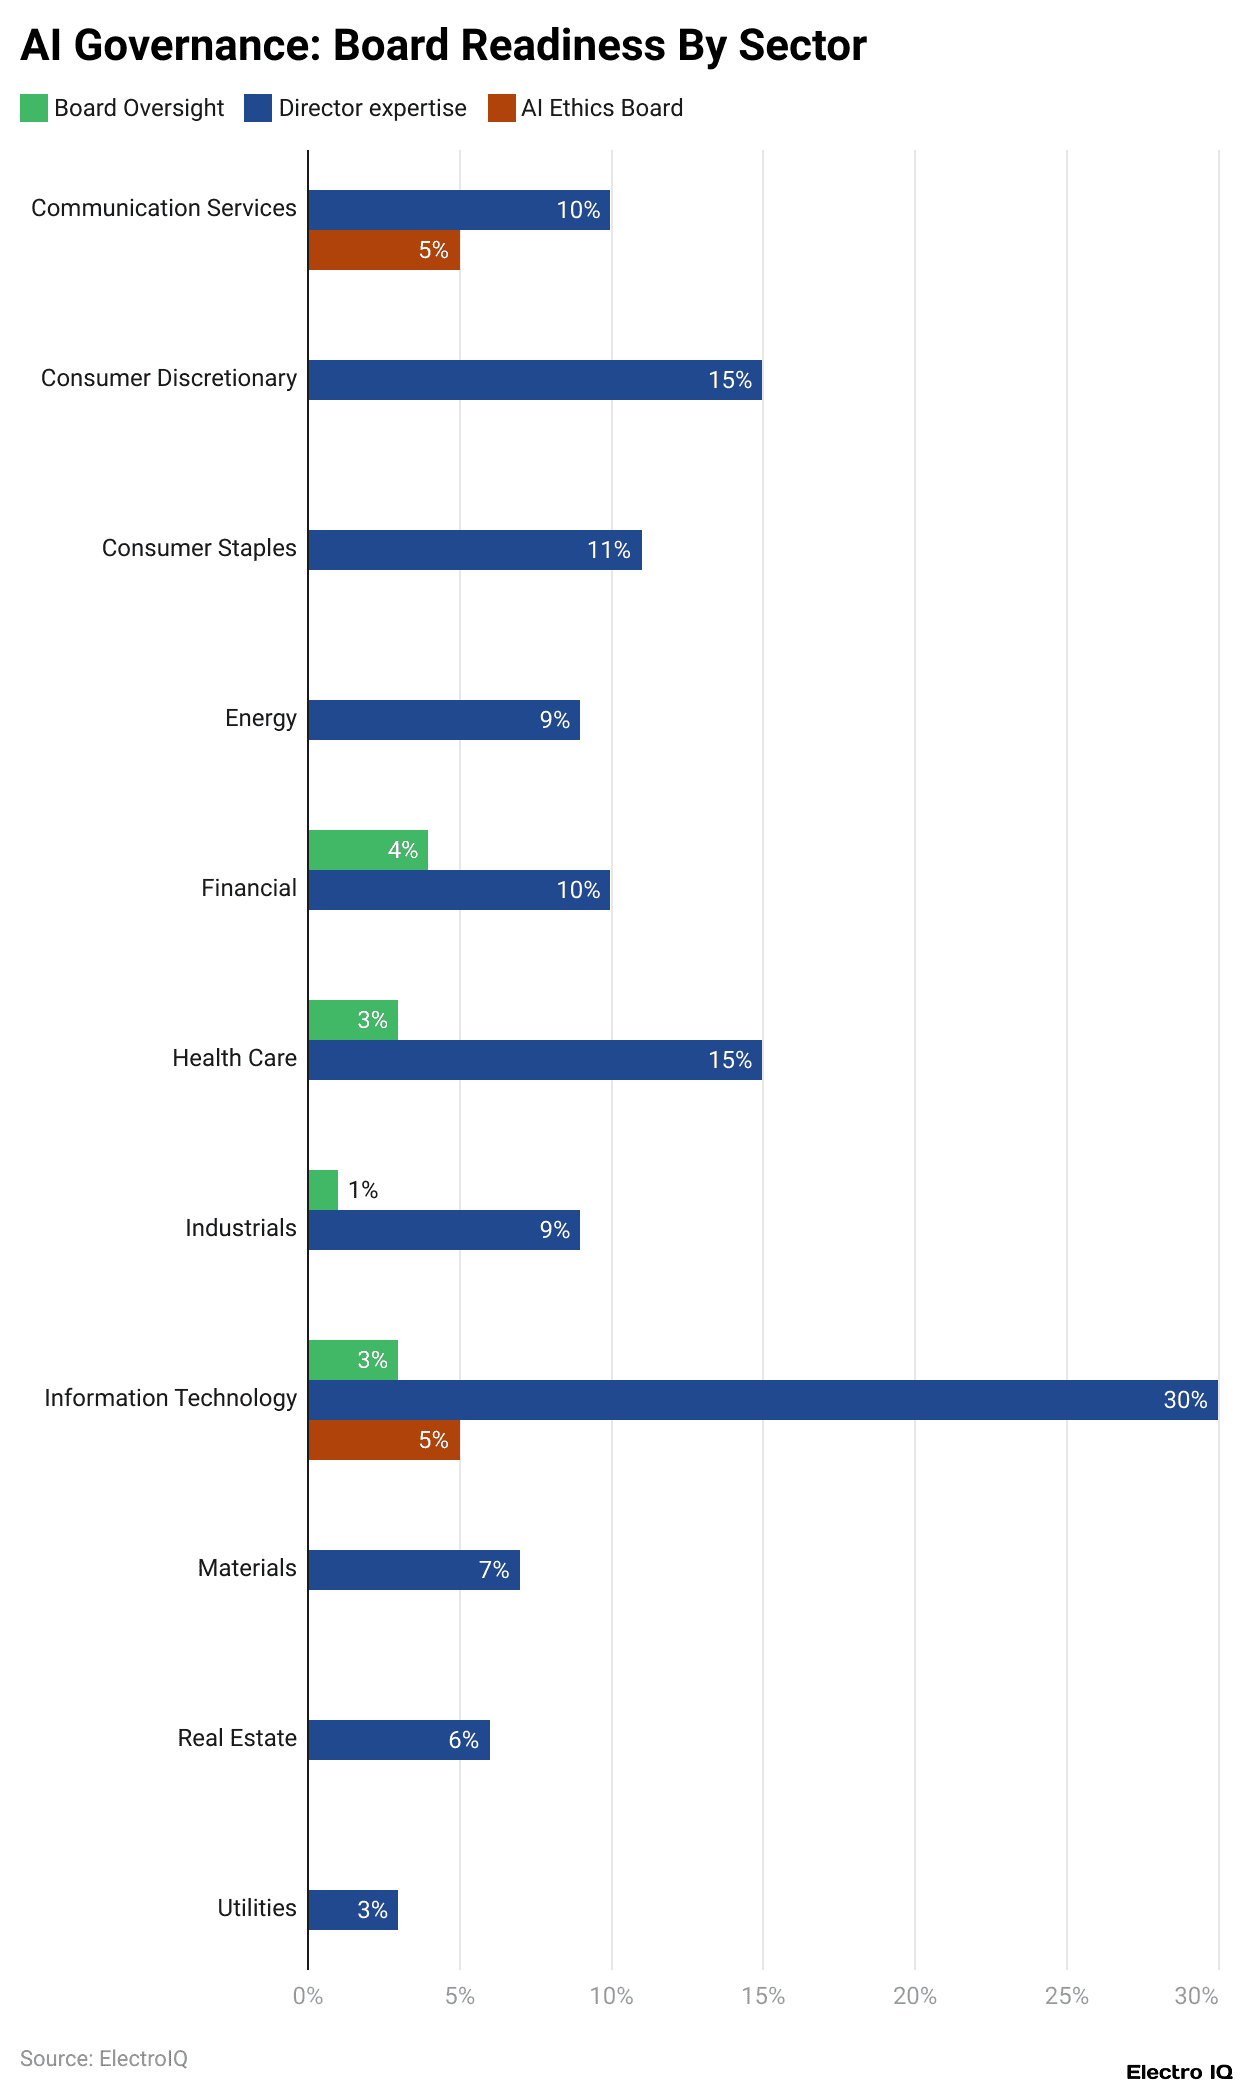
- Information Technology leads with 30% of directors showing AI expertise, followed by Consumer Discretionary and Health Care at 15% each, then Consumer Staples at 11%.
- The rest sit in single digits: Energy 9%, Industrials 9%, Materials 7%, Real Estate 6%, Utilities 3%.
- Board-level oversight remains uncommon at 1% to 5% (Financials 4%, Health Care 3%, IT 3%, Industrials 1%).
Conclusion
After completing the article, it can be concluded that AI governance has moved from an optional segment to an essential one as it provides a safe, useful, and scalable backbone for the overall market. All the above statistics show that teams that document models, assign clear owners, test for bias and robustness, and track outcomes consistently beat ad-hoc efforts.
FAQ.
A cross-functional group led by a senior exec (CIO/CTO/CRO/CISO/GC) with members from engineering/ML, product, security, privacy, legal, risk, and ethics.
AI governance ensures ethical use of AI to make it transparent, safe, private, accountable, and unbiased for everyone.
- Use case allows/denies list.
- Guardrails (prompt filtering, safety policies)
- Retrieval-grounding and citation rules
- Output controls (PII/PHI filters, toxicity checks)
- Content authenticity (watermarks, provenance)
- Human review for sensitive actions
Log prompts/outputs safely, detect drift, watch for policy violations, set alerts/SLOs, run shadow tests, and schedule periodic re-validation.
AI improves governance by automating oversight, detecting risks, enhancing transparency, compliance, audits, and accountability reporting.

Maitrayee Dey has a background in Electrical Engineering and has worked in various technical roles before transitioning to writing. Specializing in technology and Artificial Intelligence, she has served as an Academic Research Analyst and Freelance Writer, particularly focusing on education and healthcare in Australia. Maitrayee's lifelong passions for writing and painting led her to pursue a full-time writing career. She is also the creator of a cooking YouTube channel, where she shares her culinary adventures. At Smartphone Thoughts, Maitrayee brings her expertise in technology to provide in-depth smartphone reviews and app-related statistics, making complex topics easy to understand for all readers.


