Shopping Application Statistics By User Demographics and Facts (2025)
Updated · Dec 08, 2025


Table of Contents
- Introduction
- Editor’s Choice
- Global E-commerce Sales Statistics
- Global Retail E-commerce Sales By Geography
- Mobile Shopping Apps Statistics
- Mobile App ROI and Cost Economics
- Retention and Lifetime Value Of App Shoppers
- Shopping Application User Demographics Statistics
- Major Shopping Apps User Statistics In India
- United States Shopping Application Analysis
- Walmart App Statistics
- Temu Apps Statistics
- SHEIN Apps Statistics
- eBay Statistics
- Target Statistics
- AliExpress Statistics
- Ad It Up Statistics
- Conclusion
Introduction
Shopping Application Statistics: Shopping applications changed how people find, compare, and buy things. A few taps let users browse many products, check ratings, and pay safely anytime. These apps generate large amounts of data on tastes, buying habits, and how often people use them. Looking at these numbers helps businesses make the app easier to use, market smarter, and sell more. Simple measures like download numbers, how many people use the app, how many visits turn into buys, and the average spend per order show what matters to shoppers. Recent reports show downloads keep rising. Sensor Tower.
This article examines key shopping app statistics and shows how companies can turn raw figures into actionable insights and a lasting edge in today’s market.
Editor’s Choice
- The top 10 shopping apps in the United States in 2025 are Amazon, Walmart, Temu, SHEIN, eBay, Target, AliExpress, Ad It Up, Fetch, and Shopify.
- Global sales on the e-commerce platform are expected to reach around USD 6.56 trillion by 2025, with a growth rate of 6.8% from last year.
- According to Shopify.com, China accounts for 50.0% of global retail ecommerce sales.
- In the U.S., 76.5% of smartphone users, about 164 million people, regularly use shopping apps in 2025.
- In the first quarter of 2025, Brand A (Wellness apps) earned USD 2.07 million in revenue, including USD 1,500 per month and USD 4,500 per quarter, achieving a 459 times ROI.
- On average, a customer who shops through the app is worth 2.8 to 5 times as much as someone who only uses the website.
- In 2025, Sellers Commerce reported that 76% of U.S. adults shop online using smartphones, while 92% of mobile shoppers under 50 regularly make online purchases.
- As of 2025, Amazon dominates e-commerce in the U.S. and UK, and Amazon India now has over 200 million active customers.
- According to Blogging Wizard, as of 2025, the Walmart app had surpassed 50 million Google Play downloads and maintained a strong 4.7-star rating from over 3.52 million reviews.
- By the second quarter of 2025, Temu’s total app downloads reached 1 billion, rising to about 1.2 billion by the end of October.
- Shein reached 85.73 million global app downloads as of July 2025.
- According to chargeflow.io, the eBay shopping app was downloaded around 2.7 million times in March 2025.
Global E-commerce Sales Statistics
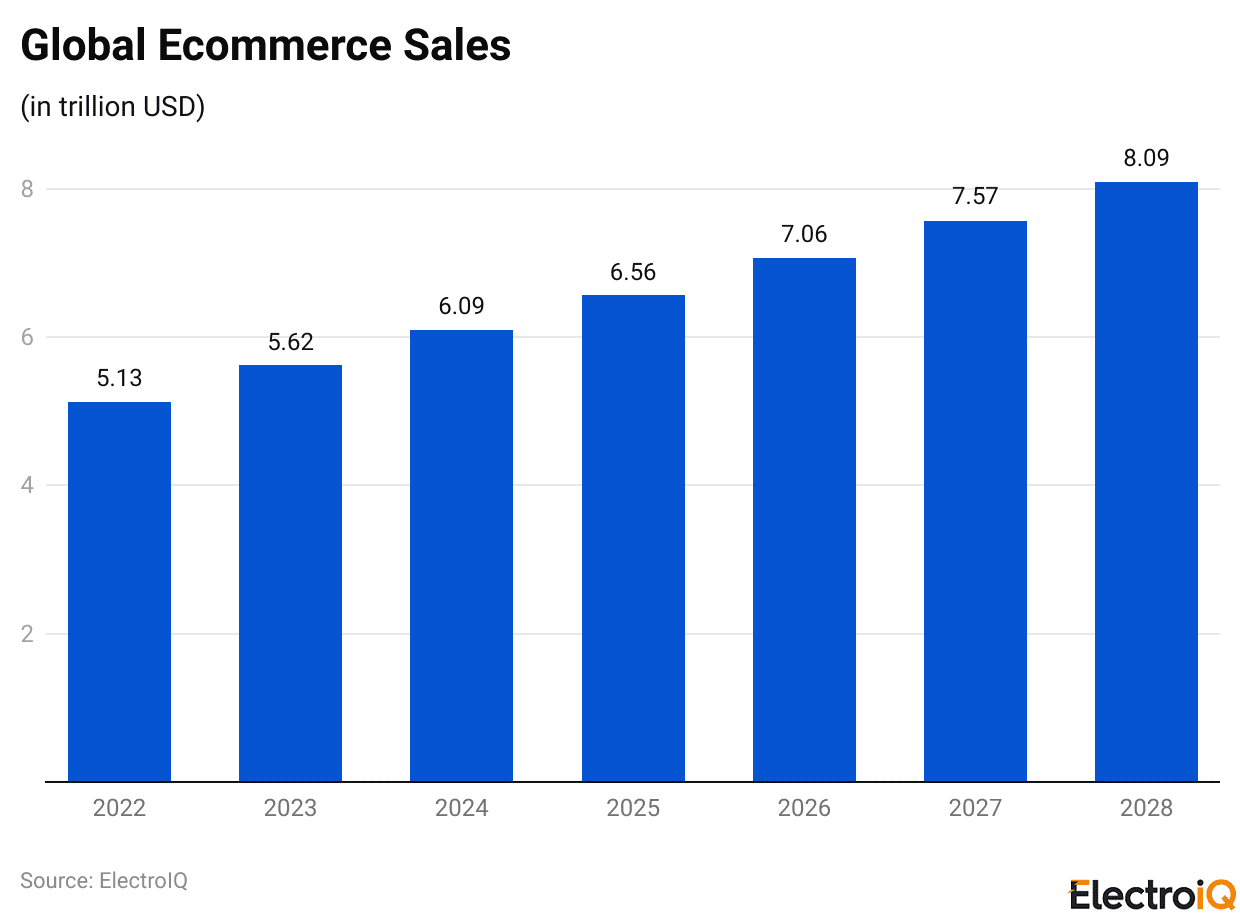
(Reference: shopify.com)
- Global e-commerce sales are expected to reach about USD 6.56 trillion in 2025, and this reflects a growth of 6.8% compared with the previous year. This steady expansion shows how online retail continues to shape shopping behaviour across major regions.
- Retail e-commerce sales in 2026 are projected to rise to USD 7.06 trillion, supported by a 7.2% increase driven by higher digital adoption, cross-border purchasing, and wider payment options.
- In 2027, global online sales are anticipated to reach USD 7.57 trillion, reflecting another 7.2% rise as more consumers in developing markets shift to digital shopping, supported by improved logistics networks.
- By 2028, retail e-commerce sales are expected to touch USD 8.09 trillion, and the 6.9% growth rate indicates a stable and mature phase of expansion across major economies.
- In the United States, e-commerce spending crossed USD 1.1 trillion in recent years, and strong demand continues to be observed in categories such as electronics, fashion, and home improvement, supported by faster same-day delivery options.
- China remains the largest global market, with annual online retail sales exceeding USD 3 trillion, driven by mobile commerce adoption and large shopping events that attract millions of buyers within hours.
- The United Kingdom records some of the highest digital spending per shopper, reaching above USD 150 billion annually, supported by strong penetration of online grocery, fashion, and subscription-based retail models.
- India continues to show fast momentum, with online retail sales now crossing USD 100 billion, and significant growth is being observed in tier two and tier three cities where smartphone and digital payment adoption is rising quickly.
- Germany maintains a stable digital retail environment, with annual e-commerce revenue moving beyond USD 120 billion, supported by high trust in online payments and efficient logistics services.
- A notable fact is that more than 20% of global retail spending is now conducted digitally, and mobile commerce accounts for over 60% of total online transactions, showing how smartphones influence purchasing behaviour at scale.
- Another key trend is the rise of cross-border e-commerce, where shoppers from Asia, Europe, and North America increasingly purchase products from overseas sellers. This activity now contributes more than USD 100 billion each year to global online trade.
The estimated online sales analysis is stated in the table below:
| Year | Retail ecommerce sales (USD trillion) |
Change Rate |
| 2026 | 7.06 | 7.2% |
| 2027 | 7.57 | 7.2% |
| 2028 | 8.09 | 6.9% |
Global Retail E-commerce Sales By Geography
- According to Shopify.com, China accounts for 50.0% of global retail ecommerce sales.
- Followed by the United States with 20.0% and Western Europe with 10.5%, together accounting for 80.5% of worldwide online retail.
- Meanwhile, others include Central and Eastern Europe (3.1%), Latin America (3%), Japan (2.7%), Southeast Asia (2.2%), India (2.1%), and the Middle East & Africa (1.8%).
Mobile Shopping Apps Statistics
- According to mobiloud.com, in the U.S., 76.5% of smartphone users, about 164 million people, regularly use shopping apps in 2025.
- Around the world, 78% of consumers now shop through mobile apps.
- Users spend about 201.8 minutes each month in shopping apps, but only 10.9 minutes on mobile shopping websites.
- 56% of global consumers buy something on mobile at least once a week.
- In higher-income families, 82% use shopping apps.
- Millennials are the most active: 61% have downloaded retail apps, and 58% prefer buying through apps rather than other channels.
Mobile App ROI and Cost Economics
- In the first quarter of 2025, wellness apps in selected countries reported strong financial performance as Brand A generated USD 2.07 million in revenue. The monthly app cost stood at USD 1,500, while the quarterly cost reached USD 4,500, and this supported an impressive 459x return on investment, indicating highly efficient spending relative to earned income in major markets such as the United States, the United Kingdom, and Australia.
- Fashion apps also demonstrated notable profitability in markets like Canada and Germany, where Brand B recorded USD 194 thousand in app revenue during the same quarter. The monthly operating cost was USD 600, and quarterly spending amounted to USD 1,800, resulting in a 108x return on investment. This reflects a strong consumer inclination toward mobile shopping in developed economies.
- The cosmetics category observed significant economic gains as Brand C produced USD 1.82 million in revenue across regions such as Japan and South Korea during Q1 2025. The monthly app cost reached USD 2,000, bringing quarterly expenditure to USD 6,000, and this translated into a 303x return on investment, showing strong app engagement among beauty-focused consumers.
| Brand | App Revenue (USD) |
Monthly App Cost (USD) |
Q1 App Cost | Q1 ROI |
| Brand B (Fashion) | 194 thousand | 600 | 1,800 | 108x |
| Brand C (Cosmetics) | 1.82 million | 2,000 | 6,000 | 303x |
- A notable fact from Q1 2025 indicates that wellness and cosmetics apps together contributed more than USD 3.89 million in revenue across leading markets, showing that consumer sectors linked with personal care continue to outperform broader app categories. These financial outcomes underline the strategic importance of mobile platforms in countries with strong digital economies.
Retention and Lifetime Value Of App Shoppers
- On average, a customer who shops through the app is worth 2.8 to 5 times as much as someone who only uses the website.
- Around 60% of people who buy once on the app come back and buy again.
- App users also place orders about 1.3 times as often as non-app users.
- In a year, about 60% of app shoppers buy multiple times.
- Meanwhile, only around 40% of mobile website shoppers do this.
Shopping Application User Demographics Statistics
- In 2025, Sellers Commerce reported that 76% of U.S. adults shop online using smartphones, while 92% of mobile shoppers under 50 regularly make online purchases.
- UniformMarket data shows that globally, the 25- to 34-year-old group leads mobile commerce usage at 27.6%.
- Followed by 35 to 44 at 20.7%, with additional shares of 18.8% (18 to 24), 14.6% (45 to 54), 10.4% (55 to 64), and 5.8% (65+).
- A Digital Silk survey found that 90% of Americans have multiple shopping apps, with 48% installing 2 to 4, 29% installing 5 to 9, and 13% installing 10+ apps, and 31% preferring apps over physical stores.
- Meanwhile, DemandSage estimates that there will be 1.65 billion global smartphone shoppers by 2025.
Major Shopping Apps User Statistics In India
- As of 2025, Amazon dominates e-commerce in the U.S. and UK, and Amazon India now has over 200 million active customers.
- Flipkart is another big all-purpose marketplace, with about 180 million monthly active users.
- JioMart focuses on groceries and local delivery, reaching around 90 million monthly users through a fast-growing quick-commerce network.
- Myntra centres on fashion and lifestyle and reports roughly 60 million monthly active users.
- Meesho is a social-commerce, value-shopping app with over 50 million monthly users (from smaller Indian cities).
United States Shopping Application Analysis
Amazon App Statistics
- According to yaguara.co, the Amazon app had over 310 million active users globally in 2025, with more than 80% about 230 million users, based in the United States.
- In 2024, Amazon also recorded 2.72 billion unique monthly visitors.
- The Amazon app itself has around 197 million monthly active users.
- Amazon Shoppers spend significantly on the platform: the average American spends USD 91.75 per month.
- In contrast, Tennessee residents spend the most at USD 124.22, and West Virginia residents spend the least at USD 56.10.
- Amazon is also central to product research: 51% of users start their searches there.
- Shoppers choose Amazon mainly for fast and free shipping (80%), followed by its broad selection (69%), Prime membership benefits (65.7%), and best pricing (49.2%).
- On the seller side, Amazon hosts over 9.7 million sellers, of whom 2 million are actively selling.
- About 82% use Fulfilled by Amazon, while 22% use a hybrid model.
- Meanwhile, the United States alone has 1.9 million sellers on Amazon, followed by California (21.1%), New York (10.2%), Florida (10.2%), and Texas (6.8%).
Walmart App Statistics
- According to Blogging Wizard, as of 2025, the Walmart app had surpassed 50 million Google Play downloads and maintained a strong 4.7-star rating from over 3.52 million reviews.
- Walmart also ranked among the top free shopping apps of 2025, reflecting its consistent mobile dominance.
- A report by Capital One Shopping shows that Walmart.com attracted an average of 438 million monthly shoppers.
- In fiscal 2025, Walmart’s online revenue grew, achieving a 6.7% share of the global e-commerce market, while its grocery-commerce segment was projected to hit USD 69.4 billion.
- E-commerce accounted for approximately 18% of Walmart’s total revenue.
- Overall, Walmart served around 255 million customer visits per week across global channels in 2025, according to DemandSage.
Temu Apps Statistics
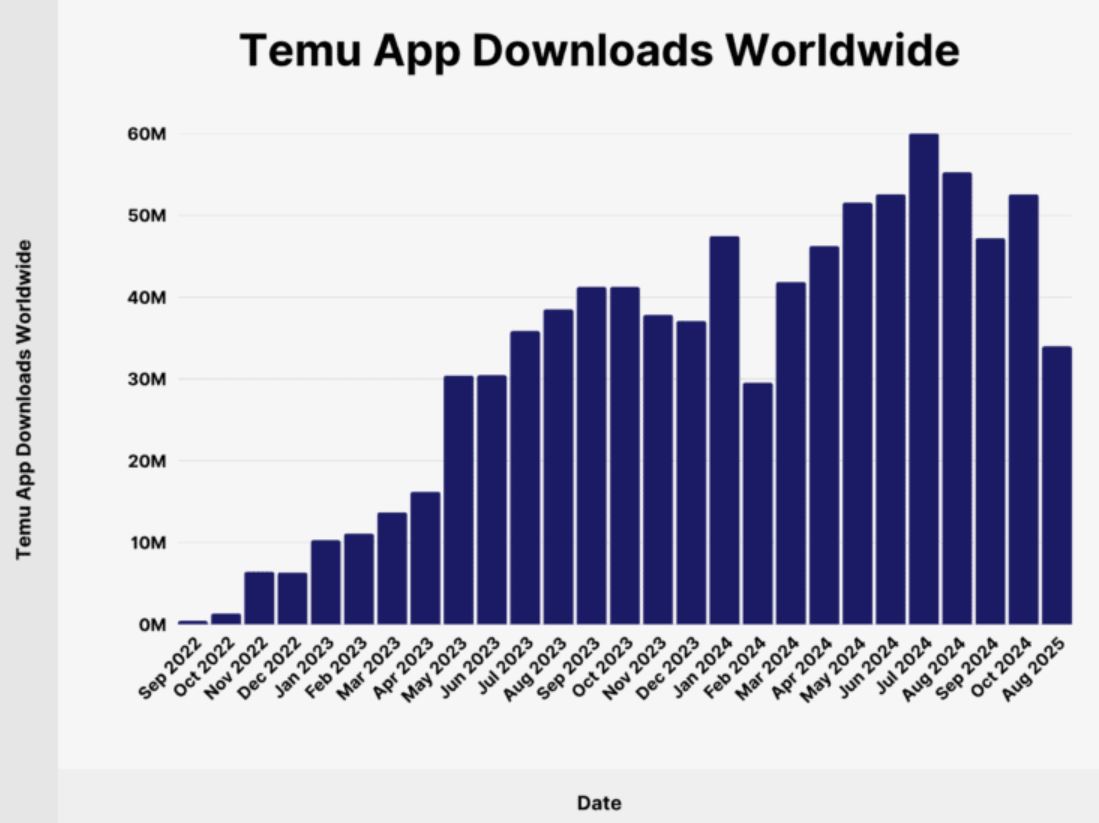
(Source: backlinko.com)
- By Q2 2025, Temu had reached about 1 billion downloads, rising to roughly 1.2 billion by October
- 2025, following 484.31 million global installs in 2024 alone.
- Temu.com reached 1.8 billion visits in September 2025.
- Temu’s total users spent an average of 21 minutes per day on the mobile app.
- Temu’s sales grew to USD 70.8 billion in 2024, far above the USD 18 billion made in 2023.
- Awareness was high in the United States, with 86% of adults aware of Temu in 2025.
- Among Gen-Z in the U.S., Temu became the most-downloaded app in early 2024, with nearly 42 million downloads from users aged 18 to 24.
SHEIN Apps Statistics
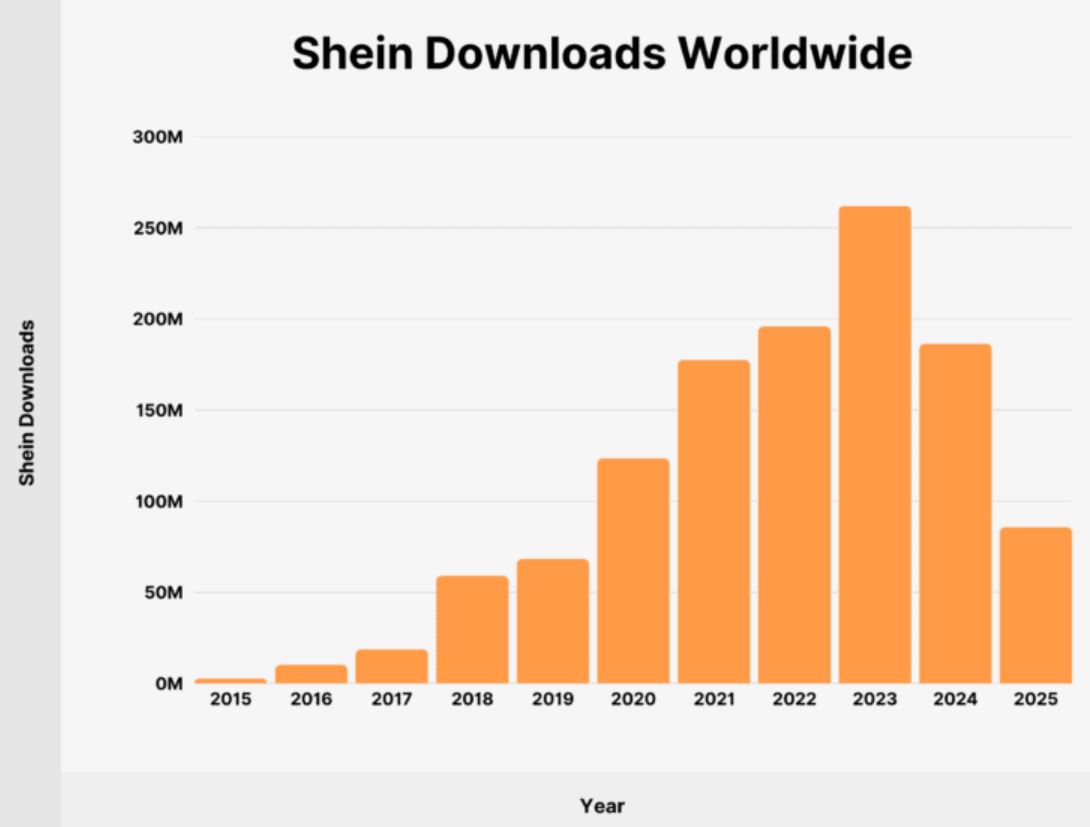
(Source: backlinko.com)
- Shein reached 85.73 million global app downloads as of July 2025.
- During the first quarter of 2025, the company earned almost USD 10 billion in revenue.
- In 2024, Shein’s worldwide sales totalled USD 38 billion.
- In the United States, the app averages about 25.7 million monthly active users.
- Shein also holds around 18% of the global fast-fashion market, and roughly 1 in 4 Americans say they have shopped there in the past year.
- The company employs close to 10,000 people.
- Between June and August 2025, Shein recorded 5.3 million downloads in the U.S., making up 13.95% of its total downloads.
- Brazil followed with 4.4 million downloads (11.58%), and Mexico with 2.7 million (7.1%).
- Regionally, Latin America accounted for 33.16% of Shein’s global downloads, while Europe accounted for 20.26% and North America for15.26%.
- Temu, by comparison, had about 25.7 million users in May 2025, down from 29.2 million in March.
eBay Statistics
- According to chargeflow.io, in March 2025, the eBay shopping app was downloaded about 2.7 million times.
- In the first quarter of the year, eBay reached 134 million active buyers globally.
- The company reported USD 18.8 billion in Gross Merchandise Volume, with 48% of that coming from international markets.
- Most of eBay’s mobile shoppers are young, with nearly 75% aged 18 to 34.
- In the United States, about 31% of Gen Z shoppers said they purchased something on eBay in the last three months.
- In 2025, eBay’s operating expenses grew 1.71% year over year to USD 1.24 billion, and accounted for USD 2.7 billion available for share buybacks.
Target Statistics
- A report published by altindex.com stated that Target’s estimated month-over-month mobile app downloads in November 2025 were around 15,667, up 21.9%.
| Months (2025) | Downloads | Growth Rate (from previous month) |
| October | 12,849 | 22.40% |
| September | 16,555 | 10.20% |
| August | 15,016 | 9.8% |
| July | 13,678 | – |
- In 2025, Target’s app ranked in the 91st percentile for overall downloads.
- Sensor Tower’s 2025 report shows Target averages approximately 10 million monthly active users and generated 25 billion retail-media impressions through its app.
- According to Target Corporation, the 2024 relaunch of Target Circle 360 led members to spend 3 times more, while subscribers spent 8 times more, helping its media arm Roundel deliver nearly USD 2 billion in value.
- In October 2025, target.com recorded 194.49 million visits with an average session time of 07:34, reflecting a 17.45% increase in traffic from September.
AliExpress Statistics
- In March 2024, techjury.net reported that the AliExpress app reached 8.18 million global users, reflecting a 130% YoY increase.
- The eCommerce Data Bank noted that in 2025, the platform generated USD 51,849 million in GMV, up from USD 51,849 million in 2024.
- GrabOn’s 2025 analysis recorded 615.5 million monthly visits in Q2 2025.
- The app reached 8.18 million monthly users, a 130% increase from the previous year.
- International orders rose by 60%, driven by the growth of AliExpress Choice.
- App Store Spy indicated the app has surpassed 500 million Android installs.
- Sensor Tower showed that in the second quarter of 2024, the United States’ weekly active users fell to 4.5 million in mid-May but rose to 5.1 million, and downloads peaked at around 295,000 in late June.
- Miracuves Solutions added that 2025 logistics upgrades cut delivery times to 7 to 12 days from 30 to 45 days previously.
Ad It Up Statistics
- As of early 2025, Google Play reports that Ad It Up users have saved over USD 30 million on bills.
- AppBrain indicates the app has approximately 810,000 Android downloads, averaging 470 daily installs, with 19,000 downloads in the latest month and a total range of 790,000 to 810,000.
- The same source lists a 4.6/5 rating from 37,000 users.
- According to metrobyt-mobile.com, the app rewards users for games, ads, shopping, and offers, redeemable as bill credits.
- Meanwhile, Ad It Up is free and categorised under Shopping/Savings in the U.S. store.
Conclusion
The Shopping Application makes buying things simple from start to finish. In one easy app, users can search for products, pay safely, and check their orders. Shoppers get comfort, speed, and suggestions that match their interests. Store owners can reach more people and study customer habits to improve sales. The app is built to handle growth, protect user data, and work well on different devices. Overall, it improves the shopping experience, saves time, and shows how technology can make everyday buying smarter and easier.
FAQ.
Plan features, design screens, choose a tech stack, build the backend and app, integrate payments, test thoroughly, then publish.
Download and open the app, tap Sign Up, enter details, verify your phone or email, then confirm.
Use the search bar, filters, and categories to browse items, compare options, read reviews, and make a decision.
There’s no single best app; compare Amazon, Flipkart, and local apps for price, delivery, and service.
Organisations use shopping apps to sell products, manage orders, track buyers, and understand customer demand.

Maitrayee Dey has a background in Electrical Engineering and has worked in various technical roles before transitioning to writing. Specializing in technology and Artificial Intelligence, she has served as an Academic Research Analyst and Freelance Writer, particularly focusing on education and healthcare in Australia. Maitrayee's lifelong passions for writing and painting led her to pursue a full-time writing career. She is also the creator of a cooking YouTube channel, where she shares her culinary adventures. At Smartphone Thoughts, Maitrayee brings her expertise in technology to provide in-depth smartphone reviews and app-related statistics, making complex topics easy to understand for all readers.


