ASOS Statistics By Revenue, Performance And Facts (2026)
Updated · Mar 14, 2026

Table of Contents
- Introduction
- Editor’s Choice
- ASOS Company Overview & History
- ASOS Revenue By Segment
- ASOS Revenue By Region 2025
- ASOS Gross Profit
- Share of Global ASOS Website Visitors By Gender
- ASOS Adjusted EBIT
- ASOS Regional Performance By Market
- ASOS Earnings Per Share
- ASOS Free Cash Flow
- ASOS Borrowings
- Market Capitalization Of ASOS
- Conclusion
Introduction
ASOS Statistics: The year 2025 marked a critical moment for ASOS plc, which operates as a UK-based online fashion leader. The company faced three major challenges. These challenges include changes in consumer behavior, increased international competition, and efforts to achieve profitability through operational changes. ASOS has established itself as the leading fast-fashion online retailer. Now, it faces declining revenue streams and a reduced customer base while ultra-competitive companies like Shein and Temu increase their market share. The company achieved its 2025 financial results through early stabilization efforts. These efforts involved better margins and cost management and increased full-price revenue streams.
The article presents an analysis of ASOS 2025 statistics, which provide numerical data about the company’s revenue and profit, customer behavior, and international sales and operational difficulties that affect its online fashion business.
Editor’s Choice
- ASOS plc revenue declined to £2,477.8m in FY25, down from £2,905.8m in FY24, reflecting demand softness and restructuring impact.
- The company generated base sales of approximately 94%, which produced total revenue of £2339.5 million according to its primary ecommerce business model.
- The UK market generated £1211.8 million, which accounts for about 49% of total sales, showing that the company focuses on domestic markets.
- The EU market generated £819.3 million, which represents approximately 33%, while the US market produced £257.7 million, showing international market challenges.
- The company achieved gross profit of £1 166.7 million, which resulted in gross margin increase from 40.0% to 47.1% through the year.
- The company achieved a 60% reduction in its adjusted EBIT loss, which decreased from £81.5 million to £32.2 million.
- The company achieved an adjusted EBITDA increase to £131.6 million, which shows that its cash business operations became more profitable.
- The number of active customers decreased by 8%, which brings the total to 6.5 million, but customer retention showed better results during the second half of the year.
- Europe experienced a 16% decline in gross merchandise value because of 20% reduction in orders, which happened due to an overall market demand decline.
- US GMV declined 18% YoY, but ABV rose 8%, which showed that the company achieved a better product mix and pricing control.
- The basic and diluted loss per share decreased from 284.4p to 250.1p, which showed that net losses had decreased.
- Generated free cash flow of £14.1m, which represented a decline from the previous year’s total of £37.7m.
- Achieved a 27% reduction in total borrowings which decreased to £503.6m from £688.1m as part of its debt reduction strategy.
- As of late February 2026, the market cap was approximately £336 million (~$424 million).
ASOS Company Overview & History
- Founding date (June 2000), founders (Nick Robertson, Andrew Regan, Quentin Griffiths)
- Current CEO: José Antonio Ramos Calamonte (since June 2022)
- Headquarters: London, UK; listed on LSE as ASC
- Employees: ~2,800
- Business model: Pure-play online fashion retailer, 40% own brand / 60% partner brands
- Key brands: ASOS DESIGN, COLLUSION, Topshop, Topman
- Markets served: 150+ countries, 17 million active customers
ASOS Revenue By Segment
(Source: asosplc.com)
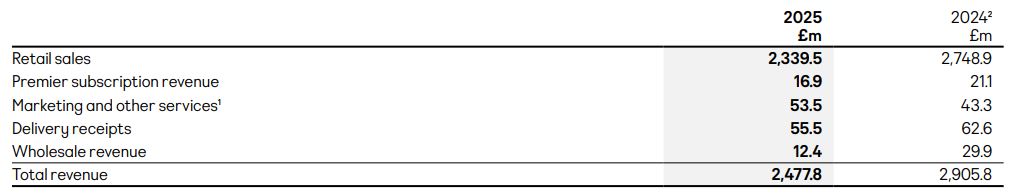
- The current ASOS plc breakdown showed the company is undergoing a process of operational changes.
- The total revenue for the company decreased from £2,905.8m in 2024 to £2,477.8m in 2025 because of weaker consumer spending and their organization-wide operational updates.
- The company generated £2,339.5m from retail sales, which accounted for approximately 94% of its total revenue despite a decrease from the previous year.
- The Premier subscription revenue increased to £16.9 million, which showed the company maintained customer loyalty even during challenging economic conditions.
- Marketing and other services revenue declined to £53.5 million, while delivery receipts fell to £55.5 million due to lower order volumes.
- The wholesale revenue dropped to £12.4 million, which indicates businesses are decreasing their stock and ending their distribution contracts.
- The company’s 2025 annual report shows that inventory control and cost management continue to drive recovery efforts.
- ASOS Statistics show the company has changed its business operations to improve efficiency, which will help the brand achieve sustainable growth over an extended period.
ASOS Revenue By Region 2025
(Source: asosplc.com)
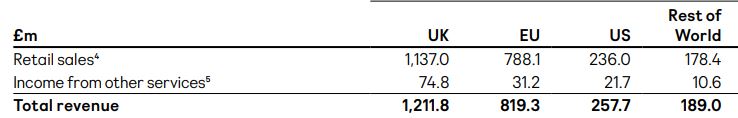
- The 2025 regional split of ASOS plc shows that the company generates most of its revenue from the UK market while maintaining some international business operations.
- The company generated £1,211.8 million in total revenue from the UK market, which accounted for almost 49 % of its total revenue, proving that the domestic market functions as the company’s primary source of profits.
- The EU generated £819.3 million, which accounted for approximately 33 % of total revenue, while the US market produced £257.7 million and the Rest of World markets contributed £189.0 million.
- The retail sector leads all markets because retail sales make up the majority of revenues, with UK markets producing £1,137.0 million in sales.
- The company achieves revenue diversification through its other services, which produce additional income, especially in the UK market (£74.8 million) and the EU market (£31.2 million).
- Its annual disclosures indicate that overseas operations experienced negative effects because of currency fluctuations and a decrease in discretionary spending.
- The ASOS Statistics demonstrate two patterns that show how geographic concentration risk affects the company while showing how the brand maintains its strength.
ASOS Gross Profit
(Source: asosplc.com)
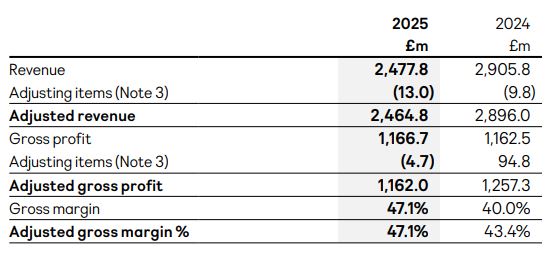
- The latest profitability update from ASOS plc shows a controlled margin recovery process which the company follows.
- The company experienced a revenue drop, which reached £2,477.8m in 2025 after it achieved £2,905.8m in 2024 but its gross profit increased to £1,166.7 m, and its gross margin rose to 47.1% from 40.0% during the year.
- It achieved adjusted gross profit of £1,162.0m while maintaining adjusted gross margin at 47.1%, which represents an increase from 43.4% that existed before.
- Its 2025 Annual Report showed that the organization achieved these improvements through its combination of decreased product discounts, better inventory management, and enhanced purchasing processes.
- The organization achieved lower operating expenses through its expenses, which went down from £94.8m to £4.7m for the period.
- ASOS Statistics show through investor presentations that operational changes will lead to greater margin improvements while revenue decreases.
(Reference: statista.com)
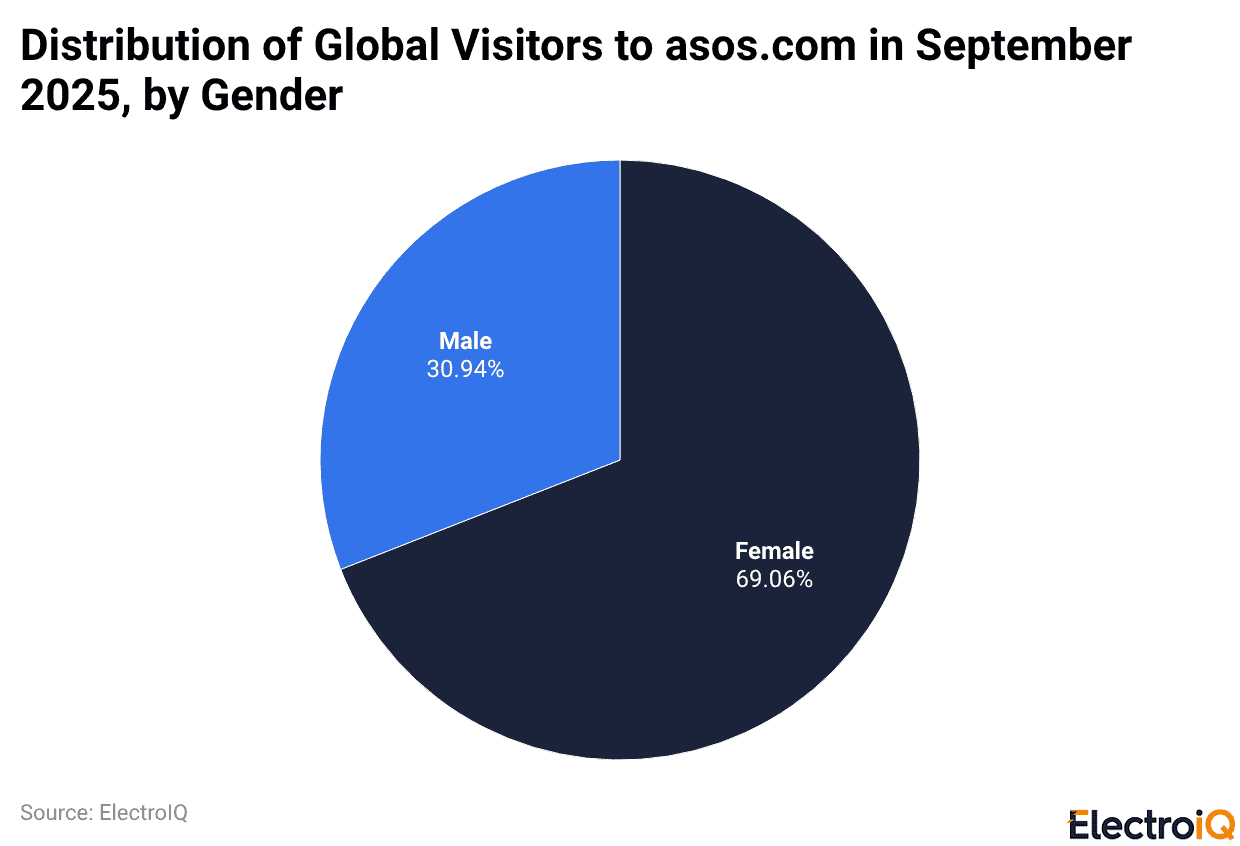
- The traffic data from September 2025 shows a pronounced gender imbalance because 69% of global visitors to asos.com are women, while 31% are men.
- ASOS Statistics provide evidence from Multipleweb, which shows that the brand has a strong appeal to female customers, while its menswear category shows potential for future expansion.
ASOS Adjusted EBIT
(Source: asosplc.com)
- The latest earnings profile from ASOS plc shows that the company has achieved important operational stability.
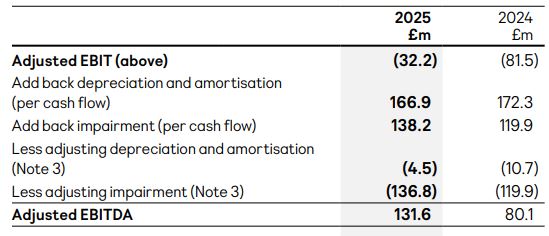
- The 2025 adjusted EBIT result showed substantial improvement after reporting a £32.2 million loss, which was less than the £81.5 million loss that occurred in 2024—the financial result showed a 60% improvement year-over-year.
- The company reported an increase in adjusted EBITDA, which reached £131.6 million after rising from £80.1 million, demonstrating better cash profitability from its core operations.
- The 2025 Annual Report showed that depreciation and amortisation costs reached £166.9 million, which remained almost unchanged from the previous year’s £172.3 million.
- Impairment charges increased to £138.2 million, according to information presented in the company’s 2025 Annual Report.
- The management team explained to investors during presentations that restructuring and cost optimization efforts formed the essential basis for the company’s recovery process.
- ASOS Statistics show that the company has achieved better earnings performance through enhanced expense management, which leads to profit margin recovery as its primary method for maintaining long-term business success.
ASOS Regional Performance By Market
(Source: asosplc.com)
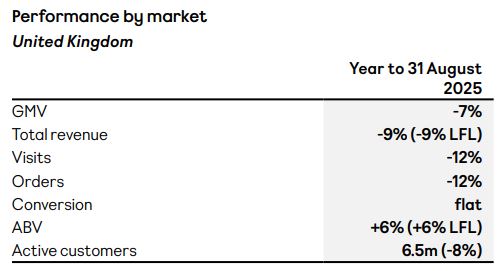
- ASOS plc demonstrated a stronger UK performance during FY25 because the company experienced a 7% GMV decrease, which happened because of lower customer traffic and their decreased buying behavior that occurred during times of restrained consumer spending.
- The company achieved higher execution through its “Test & React” model and established better own-brand distribution, which resulted in increased sell-through rates, grew average basket value and improved profit margins according to the company’s FY25 Annual Report.
- The active customer base decreased by 8% to reach 6.5 million, while the retention rates improved because customers used flexible fulfilment options and participated in specific brand partnerships.
- The ASOS Statistics demonstrate that conversion rates have reached a stable point even though the company reduced its promotional activities.
(Source: asosplc.com)
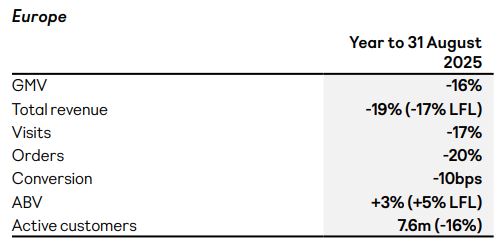
- ASOS plc experienced significant revenue declines in Europe until August 31, 2025.
- The company reported that GMV dropped 16% while revenue decreased 19% and orders fell 20%, according to their FY25 report.
- The 3% increase in ABV demonstrated better product distribution across different product categories. ASOS Statistics show the current market demand with effective cost control measures.
(Source: asosplc.com)
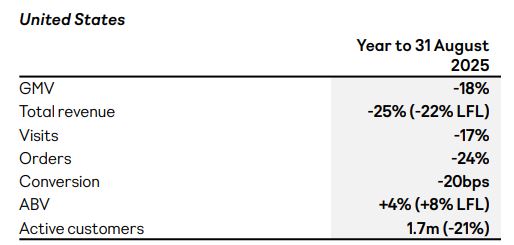
- ASOS plc focused on building sustainable profit structures as its main goal in its US operations.
- The company experienced an 18% decrease in GMV compared to the previous year because customer traffic dropped and the conversion rate reduced by 20 basis points.
- The 8% ABV increase brought partial relief to the business pressure because it showed better product distribution and price management abilities.
- FY25 Annual Report shows that decisive actions about fulfillment shifts to the UK, performance marketing optimization, and returns policy tightening and markdown reductions created better results for H2 business operations.
- The GMV decreased to 7% during H2 of the year, while the active customer base declined from 31% to 21% during H1.
- Customer retention rates improved throughout Q4 because new customer declines reached a stable point.
(Source: asosplc.com)
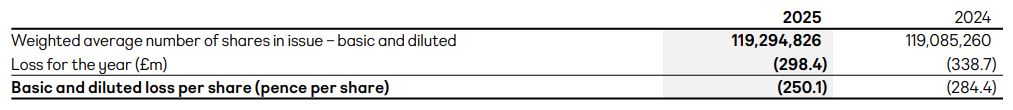
- ASOS plc reported a modest improvement in per-share performance for 2025.
- The weighted average shares outstanding increased slightly to 119.3 million from 119.1 million in 2024.
- The annual loss decreased to £298.4m from the previous total of £338.7m, which resulted in basic and diluted loss per share decreasing to 250.1p from 284.4p.
- The company sustained lower operating losses because its gross margin improved and its expenses became more strictly controlled, according to the FY25 Annual Report.
- ASOS Statistics show that the company has achieved financial stability, which demonstrates that its operational restructuring process has started to improve results for shareholders.
ASOS Free Cash Flow
(Source: asosplc.com)
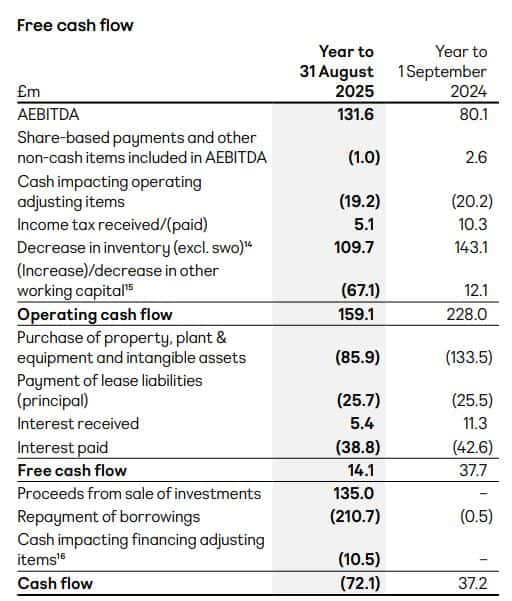
- ASOS plc showed a substantial change in its cash operations during the period that ended on August 31 2025.
- The operating cash flow value reached £159.1 million, which marked a decline from the previous year’s total of £228.0 million because of reduced working capital cash flows, although EBITDA increased to £131.6 million.
- Cash release of £109.7 million through inventory reduction that served as a primary cash release method according to its FY25 Annual Report.
- The company spent £85.9 million on capital projects and paid £25.7 million to cover lease principal obligations.
- The free cash flow decreased to £14.1 million from the previous year’s total of £37.7 million because the company continued to spend money on investments and restructuring activities.
- The company reported a negative net cash flow of £72.1 million, which resulted mainly from its obligations to repay £210.7 million in loans.
- The ASOS Statistics demonstrated effective cash reduction efforts and proper management of available funds, which indicates that the company intends to enhance its financial structure while maintaining its current business recovery process.
ASOS Borrowings
(Source: asosplc.com)
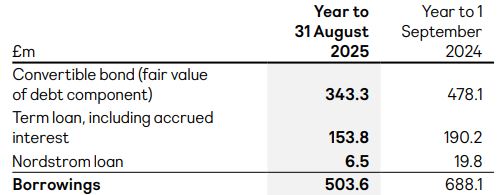
- ASOS plc achieved its first financial goal for capital structure transformation during its fiscal year 2025.
- The company reported total borrowings of £503.6 million, which represented a 27% decrease from its 2024 total of £688.1 million, according to the company’s FY25 Annual Report.
- The convertible bond remains the largest component at £343.3m, down from £478.1m, while the term loan eased to £153.8m from £190.2m.
- Current borrowings increased to £96.4 million from their previous amount of £1.6 million because of a reclassification error, which did not increase actual debt levels.
- The company achieved a significant reduction in its non-current borrowings, which now stand at £407.2 million.
- The ASOS Statistics demonstrate the company’s commitment to debt reduction while maintaining effective financial oversight of its operations.
- The company ensures financial strength by reducing total debt while decreasing its dependence on refinancing, as explained in the latest investor reports, which show that profitability will become stable and cash flow will start to develop.
Market Capitalization Of ASOS
| Year | Marketcap | Change |
| 2026 | ₹42.02 B | 7.95% |
| 2025 | ₹38.92 B | -30.28% |
| 2024 | ₹55.83 B | 3.63% |
| 2023 | ₹53.88 B | 5.26% |
| 2022 | ₹51.18 B | -78.68% |
| 2021 | ₹240.08 B | -49.57% |
| 2020 | ₹476.02 B | 79.76% |
(Source: companiesmarketcap.com)
- ASOS plc experiences post-pandemic market capitalization movements that display strong fluctuations.
- The valuation reached its highest point of ₹476.02B during 2020 but experienced a 79.76% increase before it fell to ₹240.08B in 2021, which represented a 49.57% decline, and further decreased to ₹51.18B in 2022 which showed a 78.68% reduction.
- The period from 2023 to 2024 saw the asset value increase to ₹55.83B, after which the value dropped by 30.28% to reach ₹38.92B in 2025.
- The projection for 2026 indicates a 7.95% increase, which will bring the value to ₹42.02B.
- The stock exchange filings, together with financial market data platforms like the London Stock Exchange and Companies Market Cap, show that these market changes represent shifts in investor sentiment, together with the financial performance and sector assessments of the market.
- The ASOS statistics demonstrate that macroeconomic factors and changes in operational processes directly impact the company’s stock value while showing that the brand maintains its stabilization process on public markets.
Conclusion
The ASOS statistics for 2025 show that the company is undergoing a complex transformation process. The company faces ongoing sales challenges that impact its revenue numbers. Yet, its profitability has improved through enhanced gross margin results and better inventory management practices. ASOS established its potential for long-term recovery through three strategic actions. These actions included driving full-price sales and using artificial intelligence to improve customer experience and refinancing debt to enhance its financial stability.
ASOS has developed a new business model, which enables better operational performance and higher EBITDA results. This creates a path towards 2025 as a turning point when the company will start to achieve financial success through declining revenue. The upcoming year will determine whether ASOS can establish itself as a dependable global e-commerce player through its current turnaround efforts. Otherwise, it may encounter more fundamental issues in the future.
Sources
FAQ.
ASOS plc reported £2,477.8 million in revenue in FY2025, down from £2,905.8 million in 2024 due to softer demand and restructuring efforts.
The retail sales segment generated £2,339.5 million, which accounted for about 94% of the total revenue in 2025.
The UK market accounts for 49% of total revenue in FY2025 because it generated £1,211.8 million in revenue for ASOS.
ASOS achieved a 47.1% gross margin in 2025, which exceeded the 40.0% mark that the company achieved in 2024 because of its lower markdowns and better inventory management practices.
ASOS reported 6.5 million active customers in 2025, reflecting an 8% year-on-year decline.
ASOS market cap rebounded to ₹42.02 billion in 2026, up 7.95% after significant post-pandemic volatility.

I hold an MBA in Finance and Marketing, bringing a unique blend of business acumen and creative communication skills. With experience as a content in crafting statistical and research-backed content across multiple domains, including education, technology, product reviews, and company website analytics, I specialize in producing engaging, informative, and SEO-optimized content tailored to diverse audiences. My work bridges technical accuracy with compelling storytelling, helping brands educate, inform, and connect with their target markets.