Pinterest Statistics By Annual Revenue, Net Income, Social Media Traffic, Sales And Market
Updated · Nov 07, 2024
Table of Contents
- Introduction
- Editor’s Choice
- Pinterest Annual Revenue
- Pinterest Revenue By Region
- Pinterest Research And Development Expenditure
- Sales And Market Expenditure of Pinterest
- Pinterest Advertising Expenditure
- Pinterest EBITDA
- Pinterest Net Income
- Pinterest Reaches in Countries
- Social Media Traffic Reference to Pinterest
- Pinterest’s Growth in Wellness-Related Searches
- Pinterest Overview
- Conclusion
Introduction
Pinterest Statistics: Pinterest is a social media platform that publishes and posts user information. It has emerged as a pivotal player in the social media landscape, transforming from a visual discovery platform into a comprehensive digital ecosystem that combines inspiration, commerce, and community engagement. It is characterized by strategic investments across multiple fronts, from substantial R&D expenditure to targeted marketing initiatives.
By examining Pinterest’s statistics, we can gain valuable insights into its current market position, growth trajectory, and potential future developments in the evolving social media landscape.
Editor’s Choice
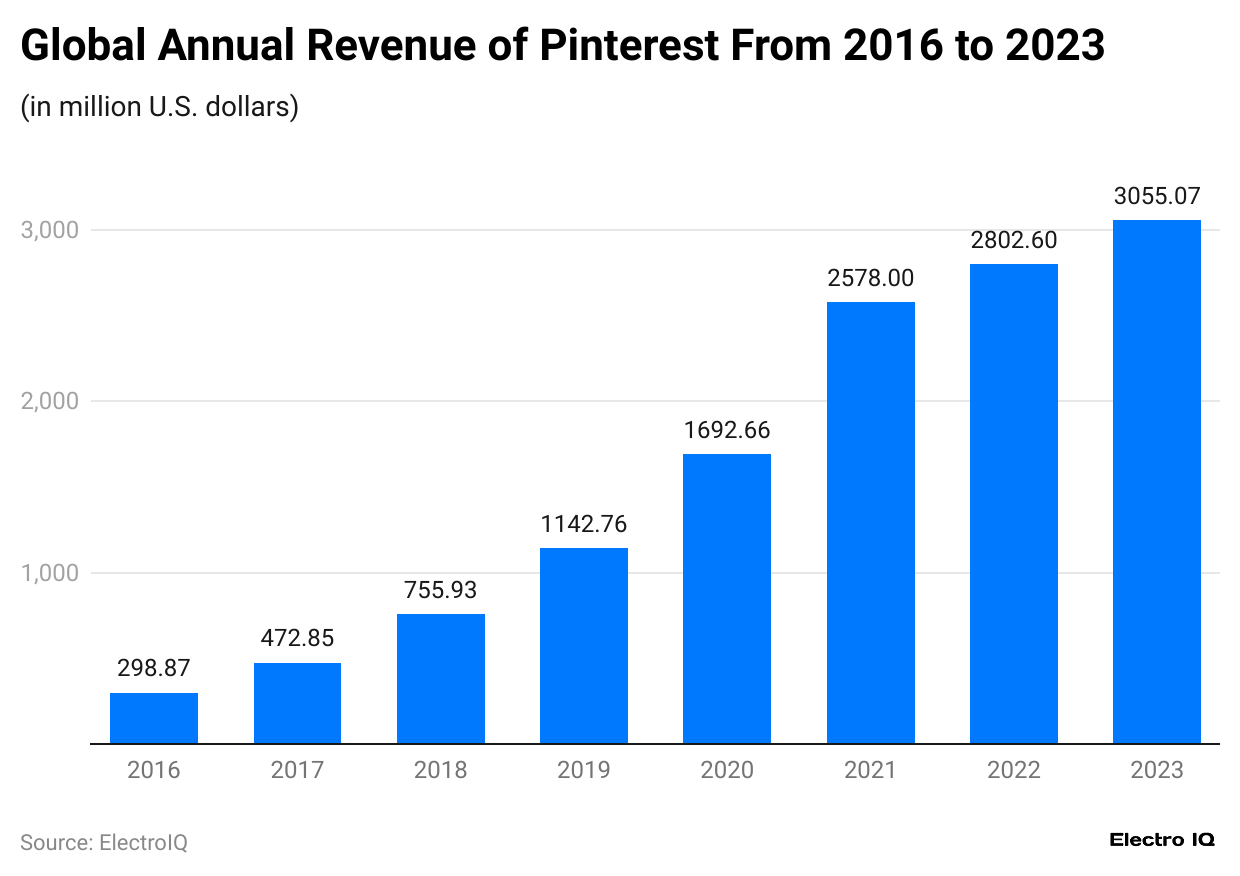
- Pinterest’s revenue grew from $298.87 million in 2016 to $3055.07 million in 2023
- The United States and Canada generated the highest revenue of $2448 million in 2023
- R&D expenditure reached $1.07 billion in 2023, showing strong investment in innovation
- The Netherlands has the highest Pinterest penetration rate at 41.3% of the population.
- YouTube drives 38.28% of social media traffic to Pinterest.
Pinterest Annual Revenue
(Reference: statista.com)
- Pinterest Statistics show that the company’s revenue steadily increases yearly, indicating strong business growth, an expanding user base, and improved monetization strategies.
- While in 2016, the revenue was $298.87 million, it has increased to $3055.07 million by the end of 2023.
Pinterest Revenue By Region
(Reference: statista.com)
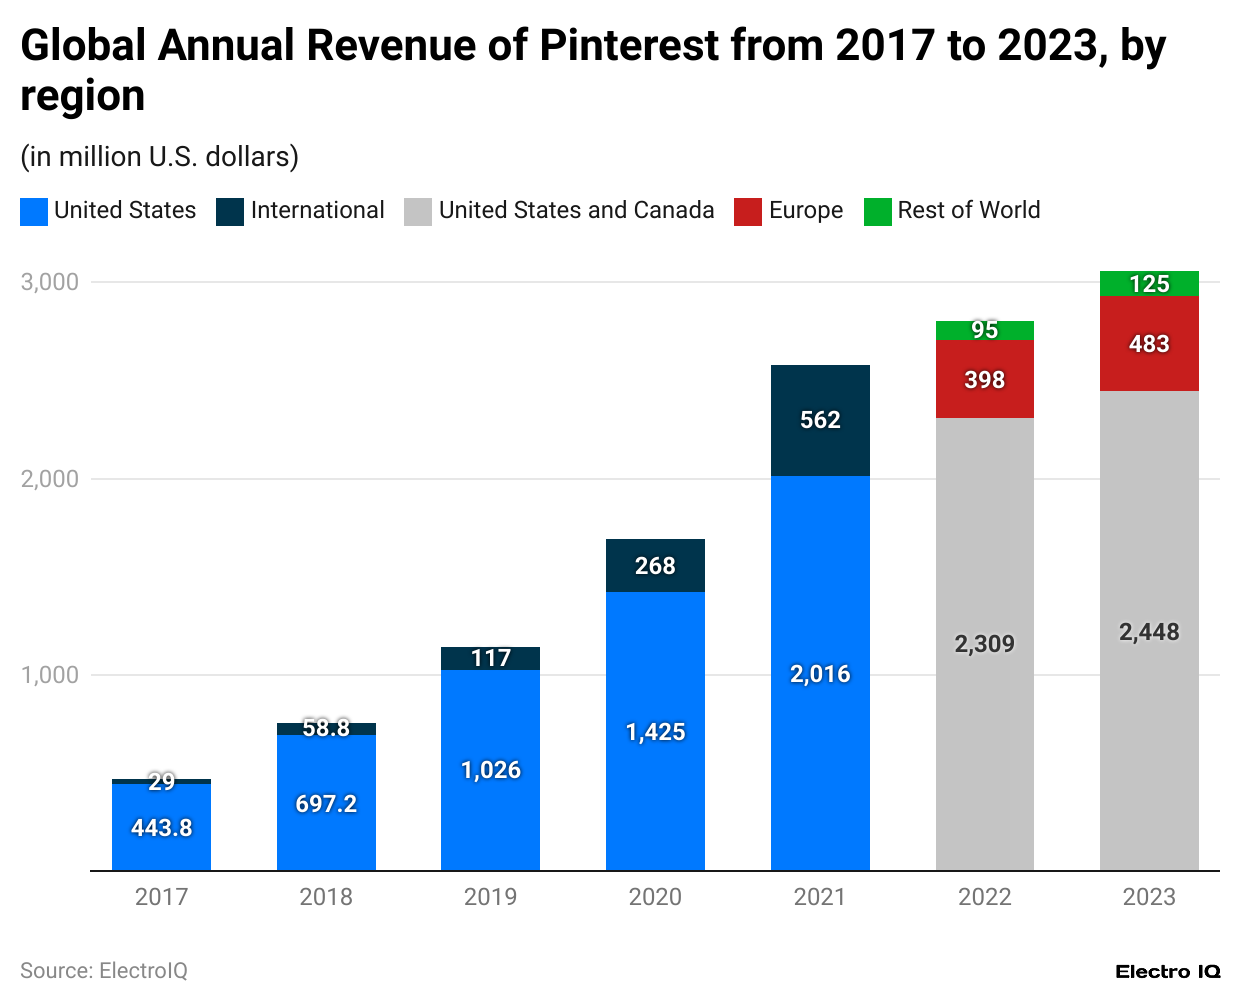
- Pinterest Statistics show that Pinterest’s revenue data from 2017 to 2023 show that the company has experienced steady and robust growth in the United States and internationally.
- The revenue from the U.S. jumped from around $1.4 billion in 2020 to over $2 billion in 2021, marking a significant increase.
- In 2022, Pinterest generated $398 million from Europe and $95 million from the Rest of the World. This trend continued in 2023, with Europe’s revenue increasing to $483 million and the Rest of the World’s reaching $123 million, indicating rising adoption outside the U.S.
- In 2023, the United States and Canada had the highest revenue, with $2448 million; Europe, with $483 million; and the rest, with $125 million.
Pinterest Research And Development Expenditure
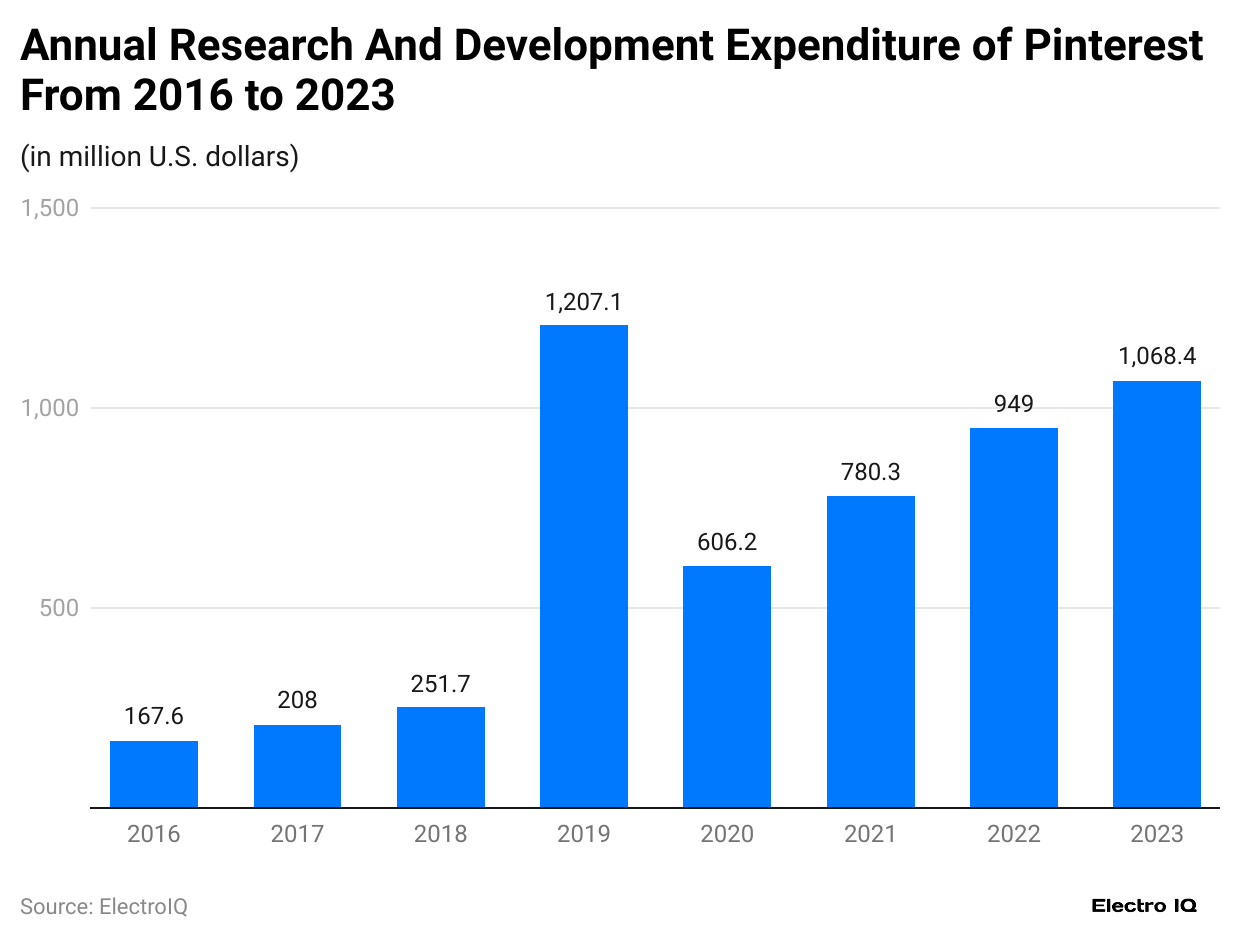
(Reference: statista.com)
- Pinterest Statistics show that the company’s R&D spending has consistently increased over the years, indicating a strong focus on innovation, platform development, and competitive differentiation.
- Following Pinterest’s IPO in 2019, R&D spending remained relatively high, with expenditures over $600 million annually from 2020 onwards, highlighting Pinterest’s commitment to reinvest in its growth.
- In 2023, Pinterest’s R&D expenditure rose to approximately $1.07 billion, showing a renewed investment push, potentially in response to increased competition or new feature developments.
Sales And Market Expenditure of Pinterest
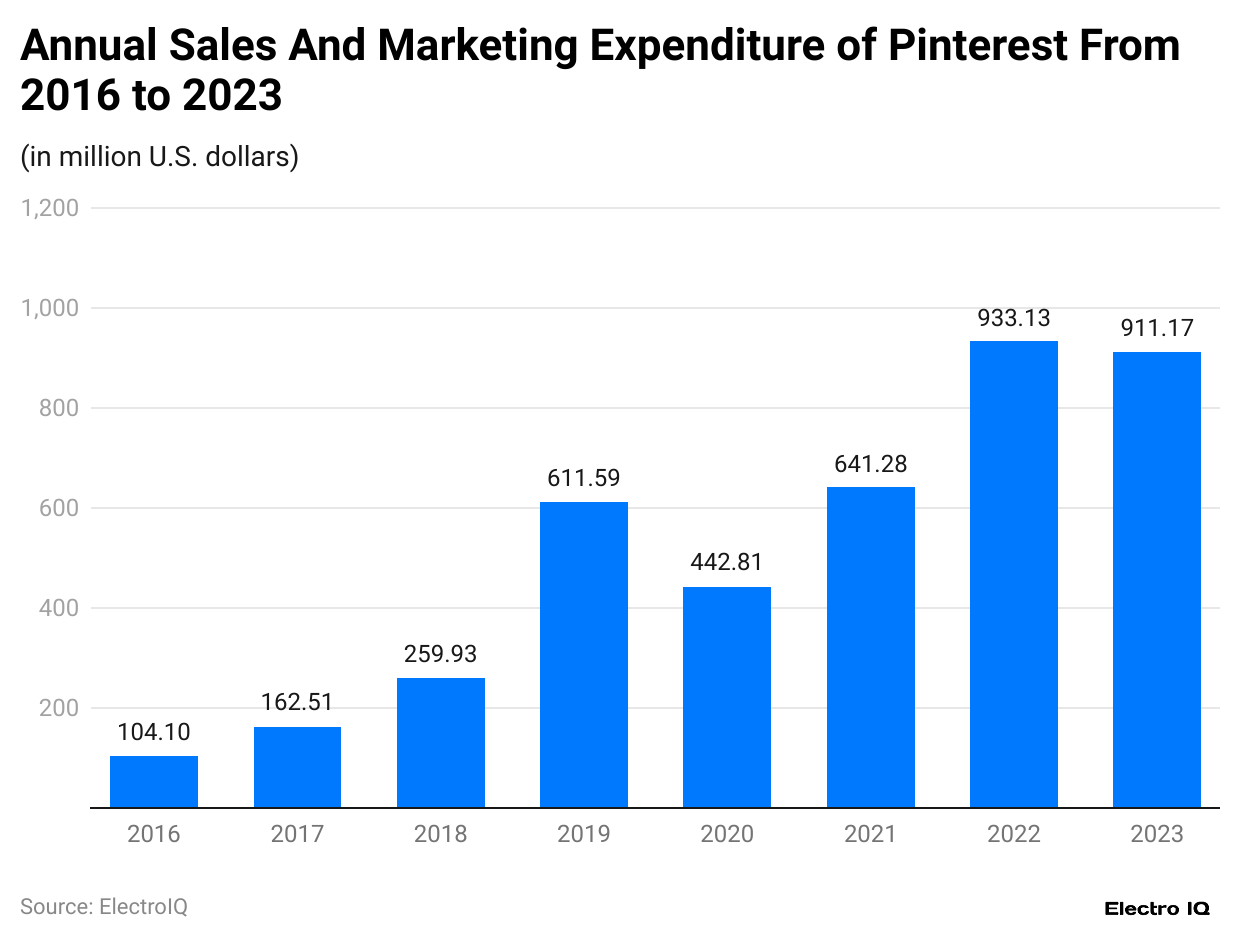
(Reference: statista.com)
- Pinterest Statistics show that the company’s spending on sales and marketing has generally increased over the years, indicating its commitment to expanding its user base and brand presence.
- Expenditure increased significantly from 2016 ($104.1 million) to 2019 ($611.59 million).
- In 2023, spending slightly decreased to around $911 million.
Pinterest Advertising Expenditure
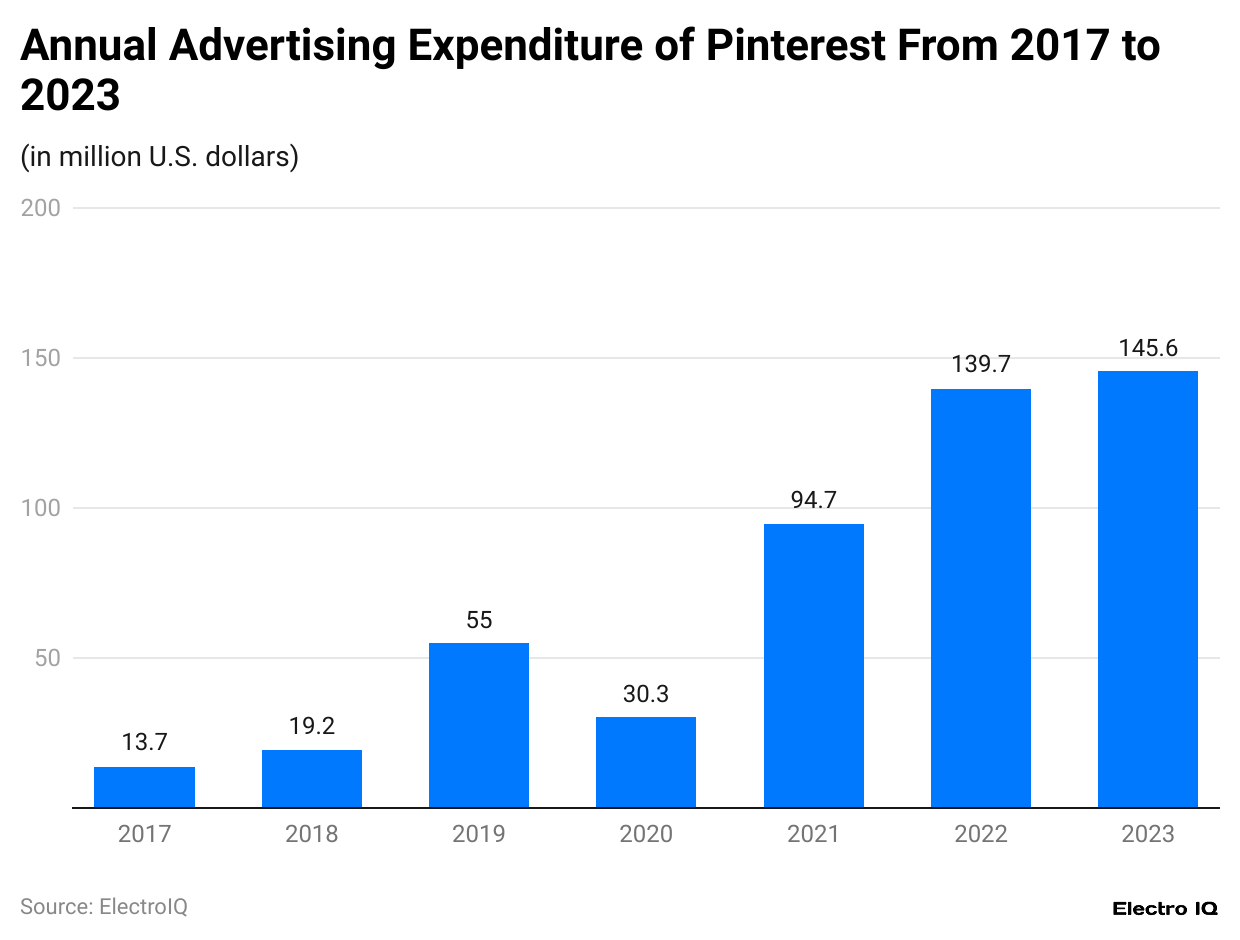
(Reference: statista.com)
- Pinterest Statistics show that the company’s advertising expenditure has consistently increased over the years, reflecting its commitment to promoting the platform and attracting more users and advertisers.
- In 2017, the advertising expenditure was $13.7 million. It increased to $145.6 million by the end of 2023.
- Overall, the insights highlight Pinterest’s progressive investment in advertising to drive growth and visibility. The continued rise in advertising expenditure aligns with its strategy to attract more users and maintain a competitive edge in the social media landscape.
Pinterest EBITDA
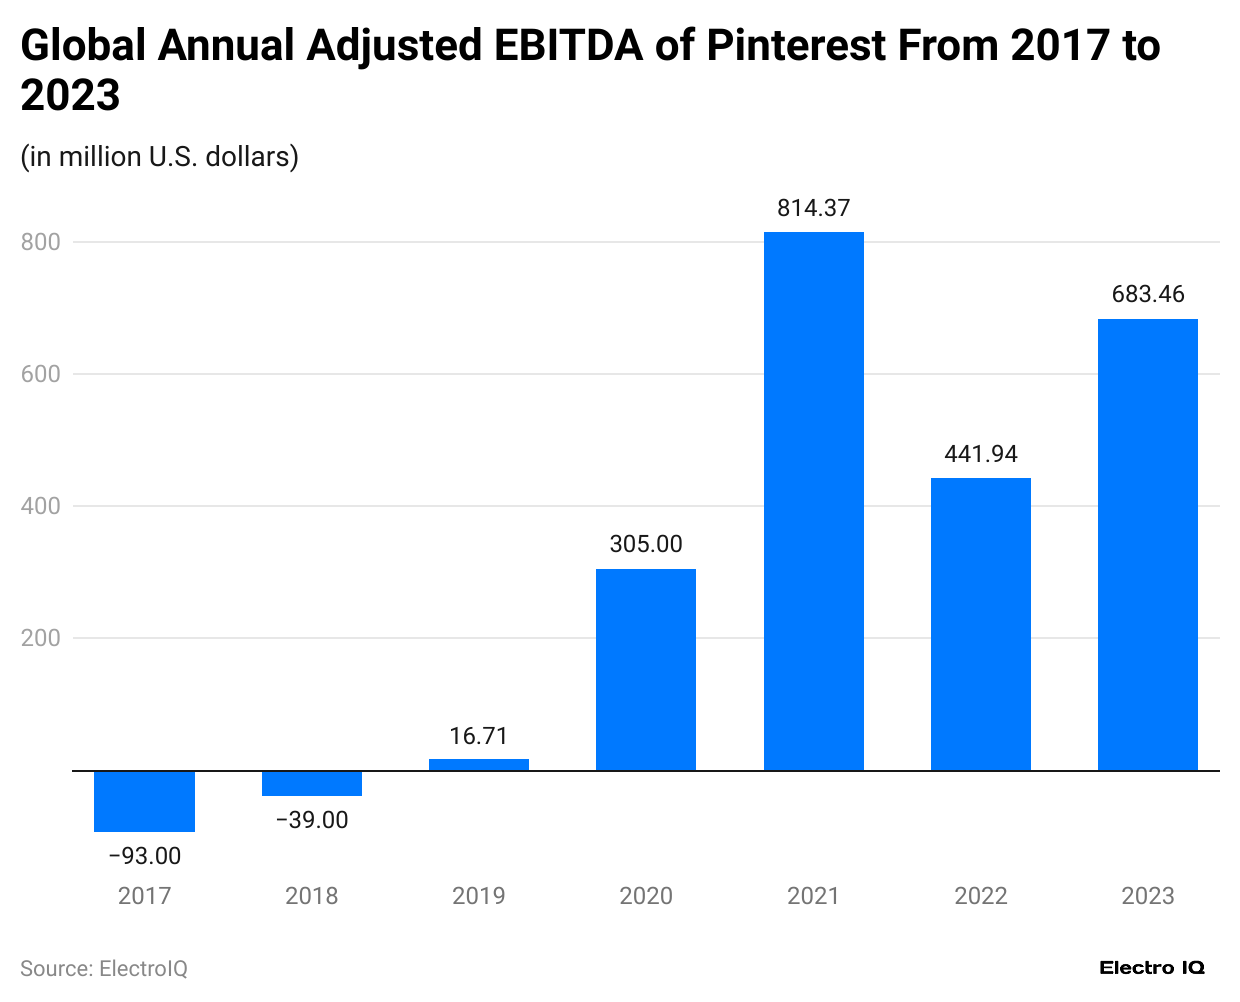
(Reference: statista.com)
- Pinterest Statistics show that the company’s EBITDA transitioned from negative values in 2017 and 2018 to positive figures in 2019, indicating significant financial performance and operational efficiency improvements.
- Pinterest achieved its peak EBITDA in 2021, reaching approximately $814.37 million. This high performance may be attributed to strong post-pandemic engagement and improved monetization strategies.
- EBITDA declined to $441.94 million in 2022 from the previous year’s peak, suggesting increased expenses or challenges in maintaining the same profitability level as in 2021.EBITDA rose again to $683.46 million in 2023, indicating Pinterest’s resilience and possible adjustments in operational strategies to regain profitability after the decline in 2022.
Pinterest Net Income
(Reference: statista.com)
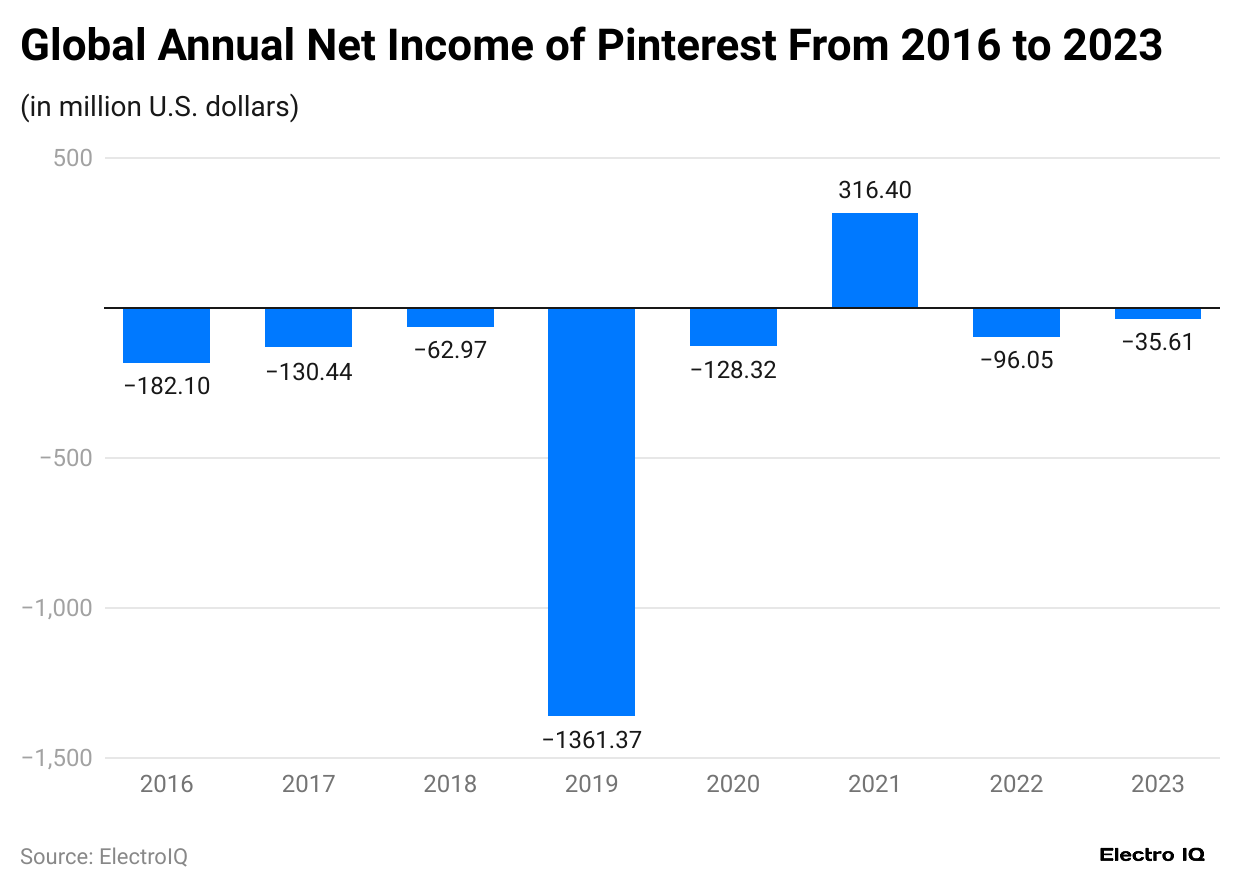
- Pinterest Statistics show that the company has mostly reported net losses throughout the observed period, indicating ongoing challenges in achieving net profitability despite growth in revenue and adjusted EBITDA.
- Pinterest recorded its highest net loss in 2019, amounting to -$1.36 billion, likely associated with high expenditures around its IPO and increased investments in R&D, sales, and marketing.
- By 2023, Pinterest’s net loss further decreased to around -$35.61 million, showing progress toward reducing losses and potentially approaching sustained profitability.
(Reference: statista.com)
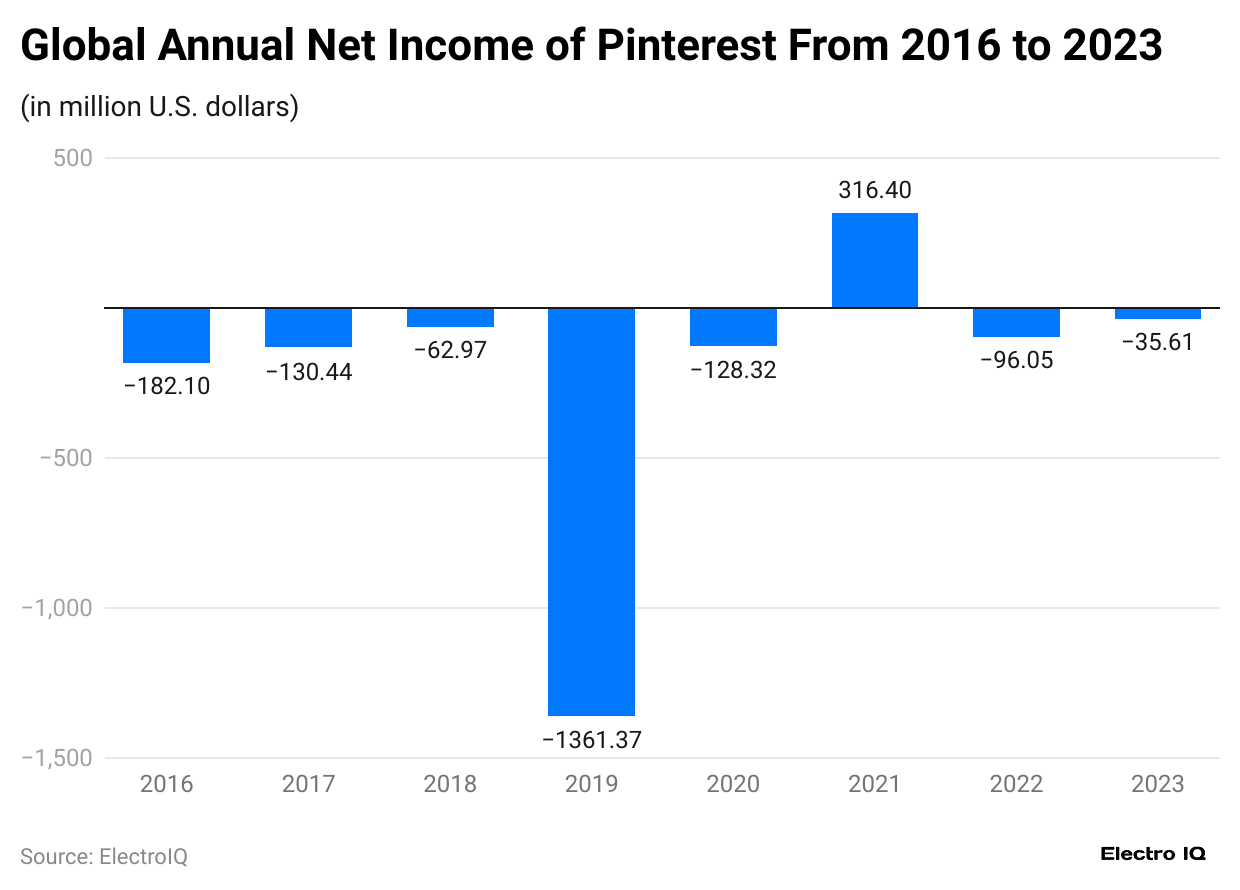
- Pinterest Statistics show that the company has been narrowing its losses over time, indicating efforts to improve financial performance and reduce operational costs.
- The most substantial net loss occurred in 2019, with a loss of -$1.36 billion. This loss spike could be linked to high expenses associated with Pinterest’s IPO and investments in scaling the business.
- By 2023, Pinterest had reduced its net loss to approximately$35.61 million, reflecting a strong trend towards financial stability and the possibility of achieving sustained profitability soon.
Pinterest Reaches in Countries
(Reference: statista.com)
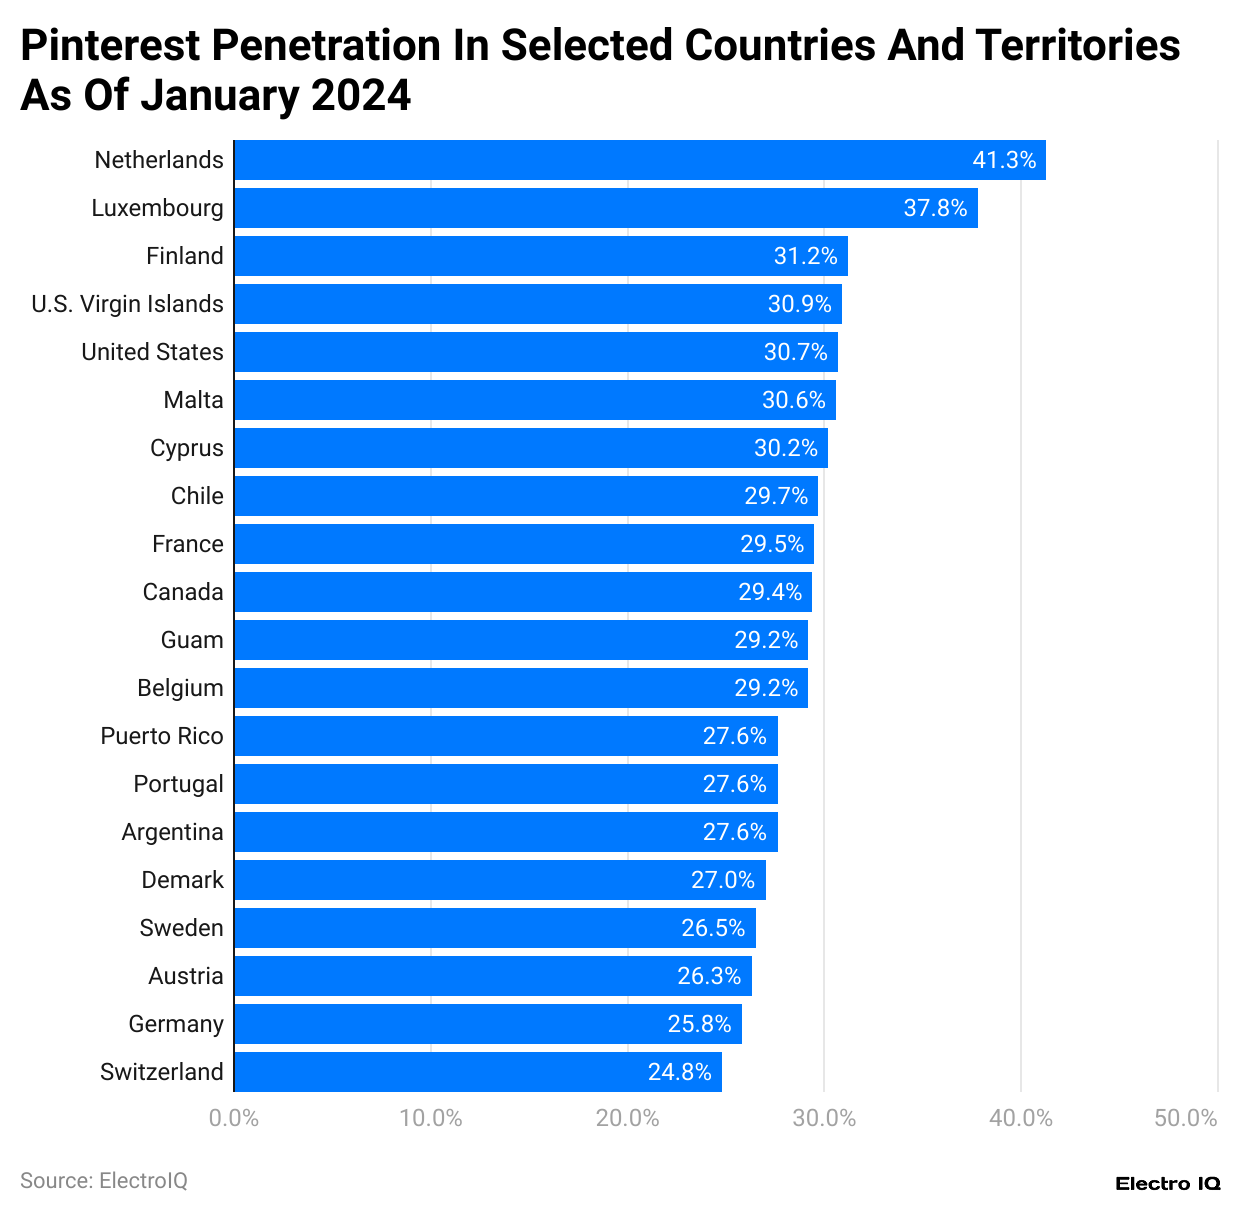
- Pinterest Statistics show that there are notably high penetration rates in several Western and Northern European countries, indicating strong engagement and popularity in these regions.
- The Netherlands leads with the highest penetration rate, closely followed by Luxembourg and Finland, with the following population share: 41.3%,37.8%, and 31.2%.
- Switzerland has the lowest penetration ratio among countries, with 24.8% of the population.
Social Media Traffic Reference to Pinterest
(Reference: statista.com)
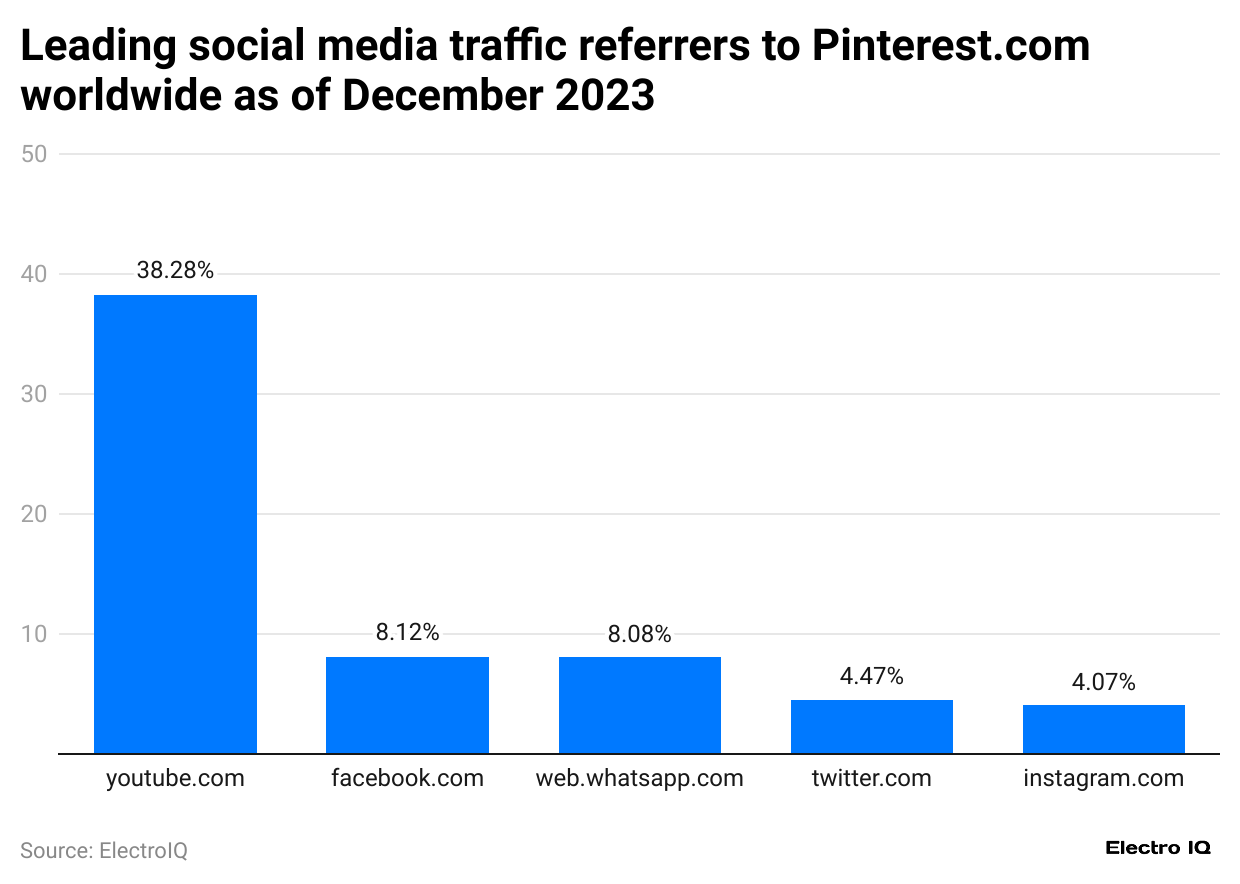
- Pinterest Statistics show that YouTube is the top referrer to Pinterest, accounting for a substantial 38.28% of social media traffic to the platform.
- Facebook and WhatsApp follow with 8.12% and 8.08%, respectively, showing their importance in driving additional traffic, though at a much lower level than YouTube. Twitter (4.47%) and Instagram (4.07%) also contribute traffic, though to a lesser extent.
Pinterest’s Growth in Wellness-Related Searches
(Reference: statista.com)
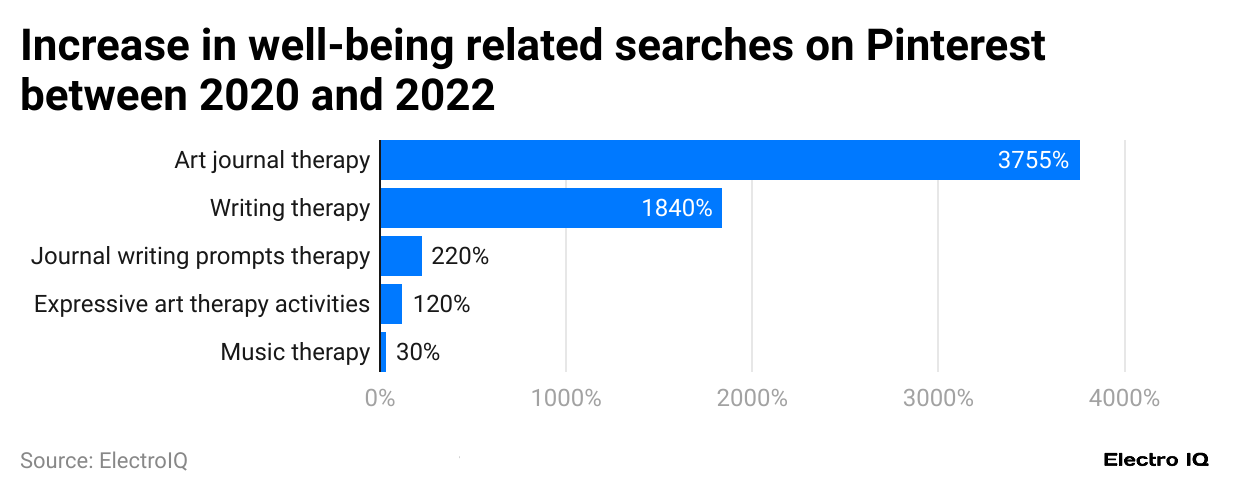
- Pinterest Statistics show a marked increase in searches related to well-being and therapy topics on Pinterest from 2020 to 2022, reflecting a growing interest in mental health, self-care, and therapeutic activities on the platform.
- “Art journal therapy” saw the highest increase, with a 3,755% rise in searches, indicating a strong interest in creative, art-based therapeutic activities.
- Writing therapy” searches rose by 1,840%, highlighting the popularity of expressive writing as a mental health tool.
- “Journal writing prompts therapy” and “Expressive art therapy activities” saw 220% and 120% increases, respectively, showing steady interest in guided and structured therapeutic practices.
- “Music therapy” saw a smaller increase of 30%
Pinterest Overview
- Pinterest Statistics for 2023 and 2024 show key insights into the platform’s revenue, expenditures, user engagement, and global reach. As a market researcher, examining these data points highlights Pinterest’s performance, spending patterns, and popularity in different regions, reflecting its growth and potential challenges.
- In 2023, Pinterest achieved significant growth in global annual revenue, reaching approximately 3.05 billion US dollars. This increase represents steady year-on-year growth from its previous 2.8 billion US dollars in 2022. Pinterest Statistics show that the platform continues to generate revenue primarily through advertising, which has expanded as Pinterest attracts more advertisers and focuses on monetization strategies across different regions. Entering 2024, Pinterest’s financial data and projections indicate that the company may surpass 3.5 billion US dollars in revenue by the end of the year if current growth trends continue. Pinterest Statistics reveal the effectiveness of the company’s efforts to monetize its audience, with users worldwide contributing to its ad revenue base.
- Research and development (R&D) spending is another significant metric in Pinterest Statistics. Pinterest invested approximately 1.07 billion US dollars in R&D in 2023, highlighting its dedication to improving its platform, adding new features, and enhancing user experience. This figure represents a steady increase from 2022 when Pinterest’s R&D expenditure stood at around 948 million US dollars. Pinterest is expected to maintain or slightly increase this investment in 2024, likely to support new feature rollouts and keep up with competitors in social media and digital advertising. The commitment to high R&D spending underlines Pinterest’s innovation strategy, ensuring the platform remains attractive to users and advertisers.
- Sales and marketing expenses are crucial for understanding Pinterest’s brand-building and market expansion approach. In 2023, Pinterest spent 911.17 million US dollars on sales and marketing, slightly decreasing from the 933.13 million US dollars in 2022. Pinterest Statistics suggest that the company may aim to optimize its marketing budget without compromising reach and engagement. For 2024, Pinterest is expected to continue similar spending levels, focusing on effective and targeted marketing to retain its user base while attracting new users in international markets. This stable yet high marketing expenditure will likely force Pinterest’s brand visibility in highly competitive markets.
- Advertising expenditure is another area of Pinterest’s budget, specifically targeting new and existing users. In 2023, Pinterest’s advertising spending rose to 145.6 million US dollars, following an increase from 139.7 million US dollars in 2022. Pinterest Statistics show that this spending is part of the company’s strategy to stay top-of-mind among users and to draw in potential advertisers. As Pinterest continues to expand its reach globally, advertising expenditure in 2024 is anticipated to remain high. With digital advertising becoming more competitive, Pinterest’s focus on maintaining a significant advertising budget reflects the company’s goal of sustaining growth through increased visibility.
- Examining Pinterest’s adjusted EBITDA (Earnings Before Interest, Taxes, Depreciation, and Amortization) provides insights into its operational performance and profitability potential. In 2023, Pinterest’s adjusted EBITDA was approximately 683.46 million US dollars, an increase from the 441.94 million US dollars reported in 2022. This growth in EBITDA highlights Pinterest’s ability to manage expenses and optimize its operations. Pinterest Statistics from recent years show fluctuations in EBITDA, but the overall upward trend reflects improving efficiency and cost management. For 2024, Pinterest aims to continue building on this profitability momentum, which may further enhance investor confidence in the company’s future.
- Analyzing net income data offers a deeper look into Pinterest’s financial health and profit margins. In 2023, Pinterest reported a net loss of about 35.61 million US dollars, significantly lower than its 96.05 million US dollars loss in 2022. Despite remaining in negative territory, Pinterest Statistics reveal that the company is gradually reducing its losses, moving closer to a break-even point. With strategic cost management and increased revenue, Pinterest may be on a path to achieving positive net income in the coming years. For 2024, Pinterest’s financial projections indicate a continued reduction in net losses as the company focuses on balancing expenses with growth initiatives.
- Pinterest’s global reach and user penetration in selected countries are critical to assessing its market expansion. According to Pinterest Statistics, as of January 2024, the Netherlands had the highest penetration rate for Pinterest, followed by Luxembourg and Finland. These countries show high engagement levels, indicating that Pinterest resonates well with Western and Northern European audiences. In the United States, Pinterest also maintains a significant market presence, with a strong user base that contributes substantially to its revenue. Other countries like Canada, France, and Chile show moderate engagement levels, highlighting Pinterest’s appeal across diverse markets. Entering 2024, Pinterest is expected to expand its user base internationally, targeting regions with growth potential, including parts of Latin America and Asia.
- Traffic referrers to Pinterest provide another dimension to Pinterest Statistics. As of December 2023, YouTube emerged as the leading referrer, contributing 38.28% of social media traffic to Pinterest. Other significant sources included Facebook, accounting for 8.12%, and WhatsApp with 8.08%. Twitter and Instagram contributed less, with 4.47% and 4.07%, respectively. This referral traffic indicates the importance of cross-platform integration in Pinterest’s growth strategy, where content from YouTube, Facebook, and WhatsApp helps drive additional users to Pinterest. For 2024, Pinterest is expected to strengthen these referral sources by enhancing content-sharing capabilities and leveraging partnerships.
- Pinterest Statistics from 2020 to 2022 also reveal an increased interest in well-being-related content, particularly in art journal therapy and writing therapy. Searches for “art journal therapy” rose by 3,755%, and “writing therapy” increased by 1,840%. This trend reflects a growing interest in Pinterest’s mental health and self-care content. This niche could capitalize on in 2024 by introducing more tailored content and partnerships with mental health influencers. Other related searches, like “journal writing prompts therapy” and “expressive art therapy activities,” showed moderate increases of 220% and 120%, respectively. As self-care and mental health awareness grow globally, Pinterest is well-positioned to engage audiences interested in well-being topics.
- Examining the number of advertisers and their spending on Pinterest provides a view into the platform’s commercial appeal. In 2023, Pinterest attracted a diverse range of advertisers, from small businesses to large brands, contributing significantly to its ad revenue. Pinterest Statistics indicate that the company’s ad offerings, such as promoted pins and shopping features, appeal to advertisers seeking a visually driven audience. Entering 2024, Pinterest is likely to increase its ad inventory and introduce more targeted ad tools, allowing brands to reach Pinterest’s highly engaged user base more effectively. This move aligns with Pinterest’s strategy to solidify its place as a valuable platform for visual discovery and inspiration.
- From a market researcher’s perspective, these Pinterest Statistics from 2023 and 2024 highlight key financial, operational, and user engagement metrics that reflect Pinterest’s growth trajectory. With increased revenue, strategic spending on R&D and marketing, and a strong focus on user experience, Pinterest is positioning itself as a competitive player in the social media landscape. The data further underscores Pinterest’s adaptability and focus on emerging trends, particularly in well-being content, which resonates with its user base.
Conclusion
Pinterest has demonstrated remarkable growth and resilience in 2023, with significant achievements across multiple business metrics. Pinterest Statistics show that the platform’s revenue reached an impressive $3055.07 million, showing strong monetization capabilities and market expansion. The platform’s global reach continues to expand, with particularly strong penetration in European markets, led by the Netherlands at 41.3%.
As the platform continues to innovate and grow, these trends suggest a promising trajectory for sustained growth and market presence in the coming years.
Sources
FAQ.
Pinterest generated $3,055.07 million in revenue for 2023.
The Netherlands leads with a 41.3% penetration rate.
YouTube is the top referrer, accounting for 38.28% of social media traffic.
Pinterest invested approximately $1.07 billion in R&D during 2023.
Pinterest’s adjusted EBITDA was $683.46 million in 2023.
“Art journal therapy” saw the highest increase with 3,755% growth.
Pinterest reported a net loss of approximately $35.61 million.
Europe generated $483 million in revenue during 2023.

Maitrayee Dey has a background in Electrical Engineering and has worked in various technical roles before transitioning to writing. Specializing in technology and Artificial Intelligence, she has served as an Academic Research Analyst and Freelance Writer, particularly focusing on education and healthcare in Australia. Maitrayee's lifelong passions for writing and painting led her to pursue a full-time writing career. She is also the creator of a cooking YouTube channel, where she shares her culinary adventures. At Smartphone Thoughts, Maitrayee brings her expertise in technology to provide in-depth smartphone reviews and app-related statistics, making complex topics easy to understand for all readers.


