Tea Statistics By Market Size, Region, Consumption, Production, Trend and Facts (2026)
Updated · Mar 14, 2026


Table of Contents
- Introduction
- Editor’s Choice
- Tea Industry Market Size
- Tea Production By Region
- Global Tea Trade Structure And Consumption Patterns
- Export Trends, Disruptions, And Market Pressures
- Consumption Of Tea By Country
- Ready-to-Drink Tea Statistics
- Tea Sales By Country
- Demographic Distribution Of Tea Consumers
- Five Odd Teas Around The world
- Conclusion
Introduction
Tea Statistics: The ancient beverage of tea contains hidden business power that generates billions in profits while it touches the lives of people throughout the globe. The tea industry experienced its most vibrant period of transformation during 2025 because consumer preferences changed, export patterns shifted, and economic forces transformed production and trade systems. The tea industry shows its worldwide economic strength through its statistical data, which shows its consumption patterns in Asia and its health-based usage trends in Western countries.
The article presents 2025 tea statistics, which provide complete data about market size, production, export information, and regional details, and future growth projections, which research and industry reports support.
Editor’s Choice
- The global tea market was valued at USD 28.32 billion in 2024 and is projected to reach USD 54.68 billion by 2034, growing at a 6.8% CAGR.
- China produces 48% of global tea output, maintaining clear structural dominance in global supply.
- India accounts for 20% of world production, reinforcing Asia’s leadership in cultivation.
- Kenya contributes 8%, while Turkiye 4% and Sri Lanka 3% remain key secondary producers.
- Coffee exports require more dependence on international markets because more than 70% of worldwide tea production is used within domestic markets.
- Global tea exports reached 1.94 million metric tons in 2024, representing 27.6% of total production.
- Pakistan led global tea imports at 236,000 metric tons, followed by Russia (129,000 mt) and the U.S. (104,000 mt).
- Chinese exporters provided 309,000 metric tons of green tea, which reached a total export volume of 385,760 metric tons in 2023.
- The agricultural sector maintained its steady production levels, which resulted in tea output reaching 6.7 million tonnes during 2022.
- The global tea market is forecast to reach USD 134.4 billion by 2025, which shows that retailers have successfully penetrated the market.
- China’s domestic tea market reached USD 111 billion in 2023, which was more than six times larger than India’s USD 16.6 billion market. China exported tea worth over USD 2 billion in 2022, which proved its status as the top trading nation.
- The ready-to-drink (RTD) tea market is expected to reach approximately USD 130 billion by 2029, which indicates that premium products and convenient options are becoming more popular.
- Women constitute 53% of tea consumers,s while men make up 47% of tea consumers, which shows that both genders consume tea in equal proportions.
- The age group of 30 to 39 years comprises the largest consumer group at 23%, while the age group of 20 to 29 years makes up 19%.
Tea Industry Market Size
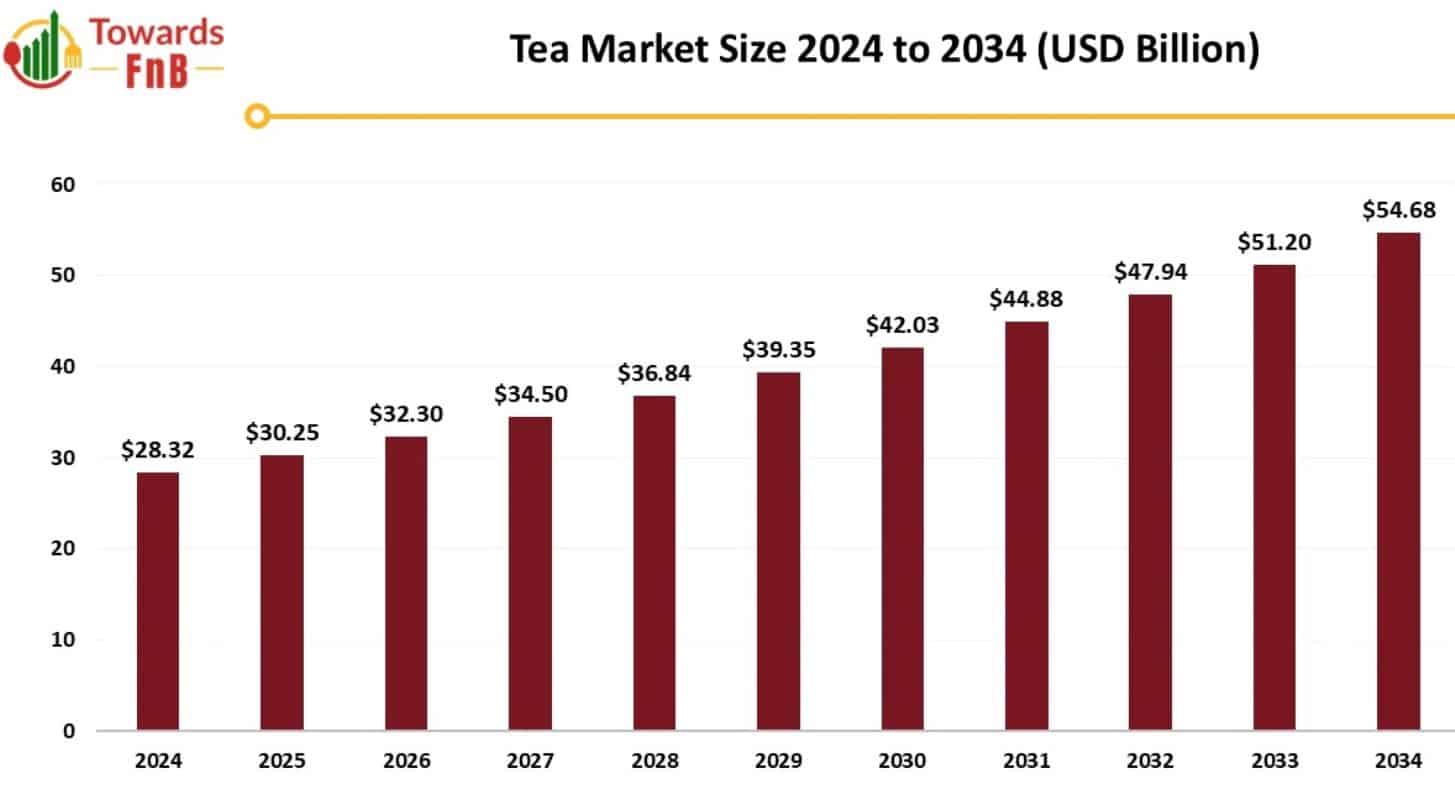
(Source: towardsfnb.com)
- The global tea market reached a valuation of USD 28.32 billion in 2024 and is expected to attain USD 54.68 billion by 2034 through annual growth of 6.8%.
- The demand for herbal and functional blends, which people use to relieve stress and strengthen their immune system,s has led to continuous development of new products in the market.
Tea Production By Region
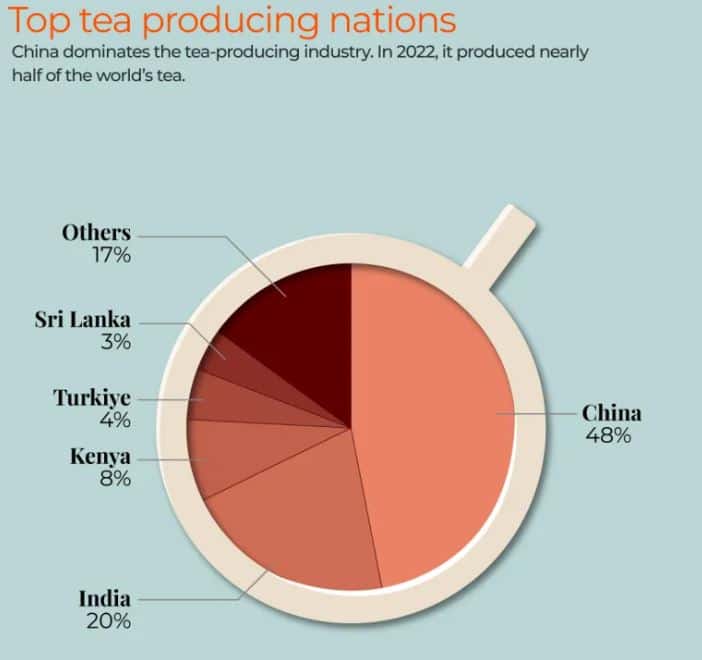
(Source: aljazeera.com)
- Recent Tea statistics show that China produces 48% of the world’s tea, which makes it the largest tea producer in the world. India follows with 20%, while Kenya contributes 8%, Turkiye 4%, and Sri Lanka 3%.
- The remaining 17% comes from other producing nations, highlighting Asia’s production leadership.
- The tea industry maintains its global production capacity through Asian countries, which control the majority of tea production.
- China maintains its position as the top producer with approximately 3.3 million metric tons of tea produced each year, which represents a major portion of worldwide production.
- India holds the position of second-largest tea producer because its industry began to expand during the 19th century, while Kenya and Sri Lanka complete the top-tier supply base.
- The production centres determine international market prices and trade patterns and maintain supply chain security, as shown by the latest Tea statistics.
- The industry undergoes a fundamental transformation through the rapid development of sustainable production methods.
- The worldwide production of UTZ-certified tea reached 1.3 million metric tons in 2023, which shows significant growth from earlier years.
- The growth demonstrates that consumers now prefer to buy products that businesses obtain through ethical means and that have environmentally sustainable practices.
- The current Tea statistics show that sustainability certification has become a key factor in international companies, which now prefer to buy products from suppliers that can provide certified and environmentally responsible materials.
Global Tea Trade Structure And Consumption Patterns
- The global tea economy creates a trade system that functions differently from all other international trading systems.
- Tea maintains its primary use as domestic consumption because more than 80 % of worldwide production remains in its home country markets.
- The tea industry retains more than 70 % of its supply because producers maintain strong cultural ties to tea and their domestic market needs.
- The existing structure of the market system determines how countries set their export prices and conduct their international trade activities.
- According to recent Tea statistics, total global tea exports reached 1.94 million metric tons in 2024, representing 27.6% of total crop production.
- The top five exporting nations—Kenya, China, India, Sri Lanka, and Vietnam—continue to dominate supply flows.
- On the demand side, 2023 import data highlight Pakistan (236,000 mt) as the largest importer, followed by Russia (129,000 mt), the United States (104,000 mt), Egypt (100,000 mt), the United Kingdom (84,000 mt), and Morocco (62,000 mt).
- Tea branding and consumer behavior show different patterns from coffee because the two beverages have different market positions.
- Coffee enjoys a premium brewing culture and urban lifestyle connection, which creates higher value, whereas tea maintains its traditional manual preparation method that people use during leisure time.
Export Trends, Disruptions, And Market Pressures
- Trade patterns have maintained their basic structure because of current macroeconomic instability.
- The COVID-19 pandemic, together with the Russia–Ukraine conflict, created major disruptions in logistics operations, which resulted in shipment delays and supply chain congestion.
- The United States has announced preliminary tariff measures that will create additional challenges for international trade because they will increase import costs for markets that depend on imported goods.
- In 2023, green tea exports reached a total of 385760 metric tons, ns which represented only 20% of the worldwide tea export market.
- China led the segment with 309000 metric tons, while Vietnam followed with 61000 metric tons, which established Asia as the main producer of value-added tea products.
- The retail price increase results from higher production and transportation expenses, which have risen throughout the supply chain.
- Chinese feedback indicates that smaller tea-growing businesses experience reduced profit margins because they cannot transfer rising costs to their customers.
- The industry will see supply patterns change while companies merge into larger entities because of persistent cost challenges despite strong international demand.
Consumption Of Tea By Country
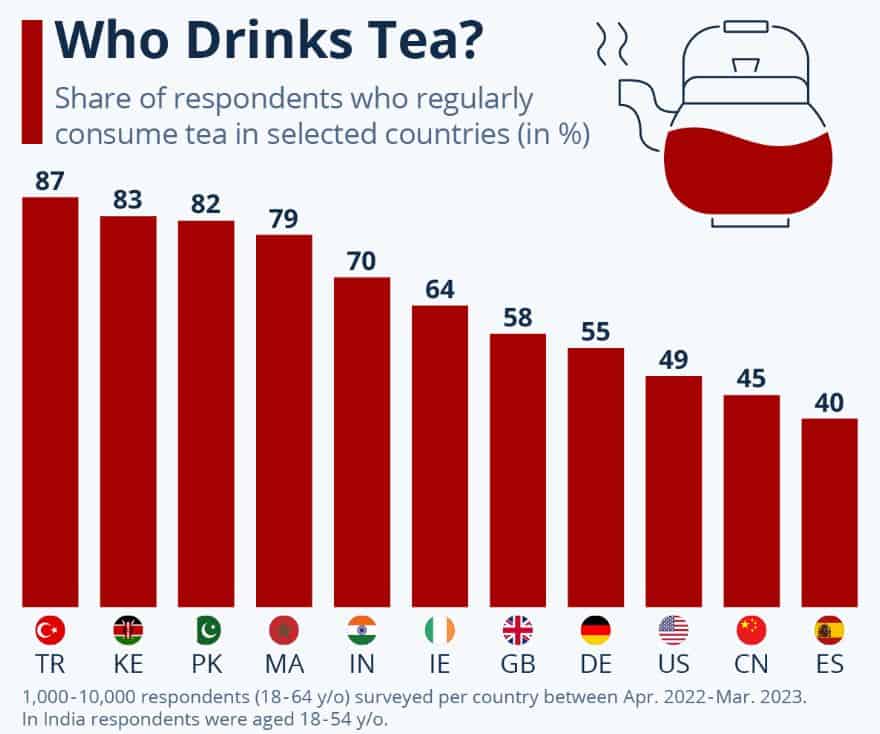
(Source: statista.com)
- The beverage category of tea exists as one of the most culturally entrenched drinks, which continues to endure through time.
- According to FAO estimates, the global production of tea reached approximately 6.7 million tonnes in 2022, making it the second most drunk beverage after water.
- The global tea supply of China, India, Kenya, and Sri Lanka continues to support their role as leading tea-producing countries because they control most tea-growing areas and tea-export operations.
- The commercial scale of the category becomes evident through its projected market value.
- The global tea market is expected to reach USD 134.4 billion by 2025, reflecting strong retail penetration across both emerging and developed economies.
- Recent Tea statistics reveal distinct consumption patterns by geography. Turkey leads globally, with around 90% of surveyed respondents reporting regular tea consumption.
- The country of Kenya exhibits strong domestic tea drinking habits because 83% of its population participates in tea drinking, despite its status as a major tea exporter.
- The United Kingdom shows tea consumption at 58%, which represents a 6% decrease from Ireland, demonstrating how traditional tea-drinking countries maintain their distinct regional drinking customs.
- Spain ranks lower, with approximately 40% of respondents identifying as regular tea drinkers, suggesting stronger competition from alternative beverages such as coffee.
- International Tea Day, which takes place on May 21, highlights how the beverage assists in poverty reduction and hunger elimination while promoting sustainable agricultural practices.
- Tea production generates employment opportunities for many rural workers while supporting the livelihood of millions of smallholder farmers in producing nations.
Ready-to-Drink Tea Statistics
- Current food consumption patterns demonstrate rapid change during the agricultural transformation process.
- The global RTD tea market is projected to reach nearly USD 130 billion by 2029, which demonstrates strong momentum for convenience-driven beverage categories.
- The products provide two beverage options, which include still and sparkling drinks, while offering multiple flavour choices that support urban and portable drinking needs.
- The organization will achieve revenue growth, which will result in increased authority over price changes.
- The average price per litre of RTD tea is forecast to approach USD 4 by 2029, which shows both premiumization and volume expansion.
- Tea statistics show that producers who succeed in combining sustainable agricultural methods with innovative ways to create RTD products will achieve greater market success.
- The tea industry has evolved from its original role as a traditional agricultural commodity market to become a worldwide beverage market that prioritizes sustainability and customer convenience through diverse product offerings.
Tea Sales By Country
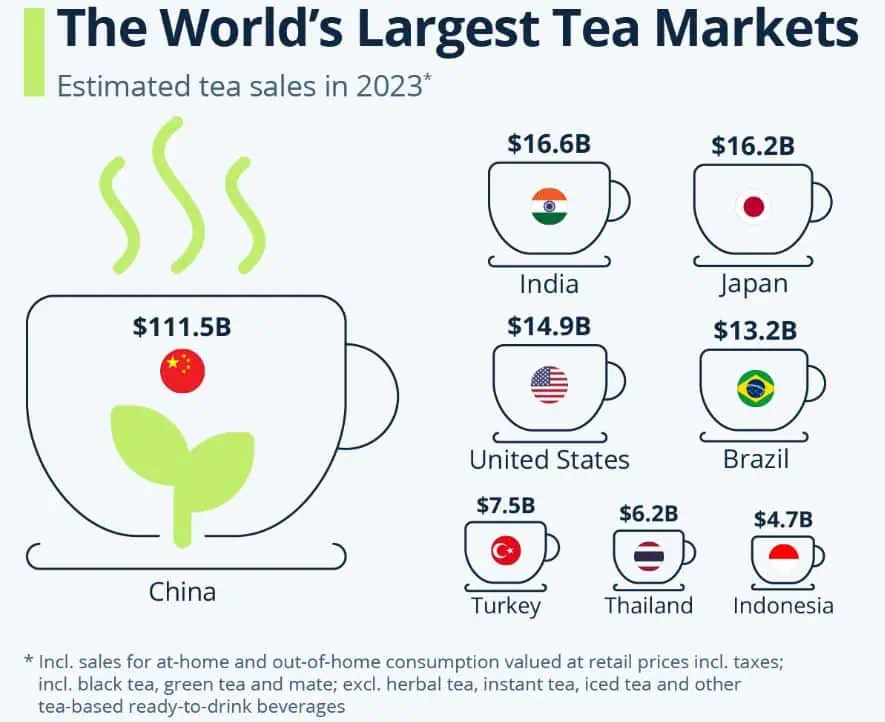
(Source: statista.com)
- International Tea Day represents more than a cultural holiday because it demonstrates how tea production benefits the economy.
- The United Nations designated May 21 to commemorate tea, which generates jobs, creates income and supports sustainable trade in developing countries.
- The “field to cup” framework establishes responsible sourcing and fair remuneration practices as essential elements that drive current tea market development.
- Tea, derived from Camellia sinensis, serves as the second most popular beverage worldwide after water because it has been consumed by people for more than 5000 years since its introduction in China. Production data confirms that Asia remains the leading producer of tea.
- China achieved its status as the top tea producer and exporter by generating 14.5 million tonnes of tea in 2022, while exporting products that exceeded 2 billion dollars.
- Tea statistics show China maintains its position as the largest tea consumption market in the world. The Chinese tea industry generated a retail market value of about 111 billion dollars in 2023, which exceeded the size of India’s 16.6 billion dollar market by six times.
- The top five consumer markets include Japan, the United States and Brazil, which display both traditional tea drinking customs and local beverage traditions like mate in South America.
Demographic Distribution Of Tea Consumers
- Tea statistics reveal a well-balanced yet slightly female-skewed consumer base. Women’s tea consumption reaches 53% while men account for 47%, which shows that both genders drink tea, but the beverage has a broad appeal to all social groups.
- The similarity of these two groups shows that tea remains a drink that people consume everywhere instead of one that only specific groups enjoy.
- Age segmentation provides deeper insight into purchasing power and lifestyle alignment.
- The largest consumer cohort falls within the 30–39 age group, representing 23% of total tea drinkers. This prime working-age demographic typically reflects stable income levels and growing interest in wellness-oriented beverages.
- The 20–29 age group represents 19% of the population because young adults continue to drink tea, while 14% of tea drinkers belong to the under-20 age group, which shows that this group first drinks tea and keeps drinking it as they grow up.
- Midlife demographics remain steady, with 13% each in the 40–49 and 50–59 brackets, demonstrating consistent demand across mature age groups.
- Notably, 18% of tea drinkers are aged 60 and above, reinforcing tea’s strong association with long-standing habits, tradition, and perceived health benefits.
- For brands and retailers, these Tea statistics suggest strategic opportunities in premium wellness blends targeting 30–39 consumers while maintaining loyalty programs for older, habitual drinkers.
Five Odd Teas Around The world
Butter tea (po cha)
- Butter tea (po cha) serves as a demonstration of cultural influence on food consumption.
- The Himalayan people residing in high-altitude areas require their calorie-rich drinks as essential items instead of sweet treats.
- The Tea statistics report that more than 70% of worldwide tea production stays within its producing nations because local customs createa strong domestic demand for po cha.
Kombucha
- Kombucha shows how the global tea market has developed through its premiumization and product range expansion. This fermented tea uses a SCOBY culture to create a beverage that belongs to the growing functional beverage market.
- The global ready-to-drink tea market is expected to reach USD 130 billion by 2029 because Tea statistics indicate that fermented and probiotic tea products connect with Asian-Pacific and North American consumers who seek wellness benefits.
Butterfly pea flower tea
- The caffeine-free infusion, known for its bright blue-to-purple color change, depends on two main factors, which are visual beauty and social media impact.
- Herbal teas account for a minor portion of tea exports. The share of green tea exceeds 20% of total worldwide tea exports.
Baobab leaf tea
- Baobab leaf tea represents the African tea tradition, which displays both nutritional and medicinal value.
- Its earthy taste creates a distinct flavour difference, which helps the product maintain its popularity in local markets.
Guava leaf tea
- Guava leaf tea serves as a wellness connection to traditional medicine for people living in the Philippines, Africa, and Central America.
- The data from analysts shows that health-positioned tea products represent the fastest expanding market segment, which shows how international Tea statistics and consumer confidence in plant-based treatments have changed.
Conclusion
Tea Statistics: The global tea industry in 2025 presents an unusual combination of traditional elements and modern changes. The industry has developed into a premium, sustainable worldwide beverage market, which will reach 54.68 billion dollars by 2034 after starting from 28.32 billion dollars in 2024. The market shows structural stability because Asian countries produce most tea, while China consumes 111 billion dollars worth, and the ready-to-drink segment grows to 130 billion dollars.
The combination of demographic equilibrium with strong domestic consumption establishes a foundation that maintains stable demand. Companies that focus their investments on sustainable sourcing while creating innovative products and health-oriented blends will achieve the greatest success in capturing future market growth.
FAQ.
The global tea market was valued at USD 28.32 billion in 2024.
China leads global production with 48% of total output.
Global tea exports reached 1.94 million metric tons in 2024, which represented 27.6% of total production.
Pakistan is the largest importer of tea, with 236,000 metric tons imported annually.
China’s tea market reached approximately USD 111 billion in 2023.
The ready-to-drink tea market is projected to reach nearly USD 130 billion by 2029.
Over 70% of global tea production is consumed within producing countries.
Global production reached about 6.7 million tonnes in 2022.
Consumers aged 30–39 years represent the largest segment at 23%.

I hold an MBA in Finance and Marketing, bringing a unique blend of business acumen and creative communication skills. With experience as a content in crafting statistical and research-backed content across multiple domains, including education, technology, product reviews, and company website analytics, I specialize in producing engaging, informative, and SEO-optimized content tailored to diverse audiences. My work bridges technical accuracy with compelling storytelling, helping brands educate, inform, and connect with their target markets.