Visme vs Piktochart Statistics By Revenues, Users And Market (2025)
Updated · Jun 24, 2025

Table of Contents
Introduction
Visme vs Piktochart Statistics: In the year 2024, Visme and Piktochart had cemented their roles as the best tools for visual content creation and manipulation. While both are platforms that let one design infographics, presentations, and reports, there are differences between them concerning revenues, users, and markets.
This article provides a Visme vs Piktochart statistics comparison with transparent numerical data on each platform’s strengths, percentage breakdowns, and credible sources.
Editor’s Choice
- In their report for 2024, Visme showed revenues of somewhere between $15 million and $18.1 million, far surpassing Piktochart’s revenues of $5.4 million.
- Piktochart could claim to have more users, up to 14 million, whereas Visme seems to have just around 7,500 paying customers, indicating potential different business models.
- In May 2025, Visme’s weekly website visitors ranged between 473,000 and 488,000, outnumbering Piktochart’s visitors, who ranged between 386,000 and 403,000.
- The U.S. is the most significant traffic source for both platforms, though both have seen double-digit drops from that country.
- Google Analytics showed growth in Russia at 9.3%, and in Brazil at 13.3%, while Piktochart increased its registration barriers in Indonesia at 31.56% and Colombia at 5.15%. There are some slight differences in direct traffic; a full 30.55% is contributed to Visme, in contrast to 26.86% that Piktochart can claim. This suggests stronger levels of brand recall with Visme.
- The most considerable percentage of social traffic for Visme is YouTube-based at 40.19%, while Piktochart favours Pinterest at 16.93% and WhatsApp at 15.23%, respectively.
- Both sites seem to share Facebook traffic, with 7.46% of traffic coming to Visme and 11.34% to Piktochart.
- Gender demographics are nearly balanced for both, Visme being slightly male (51.03%) and Piktochart almost equal (50% male and 49.45% female).
- Both share 5.91% of users aged 65 plus, suggesting equal reach among older demographics.
Revenue Statistics
Visme
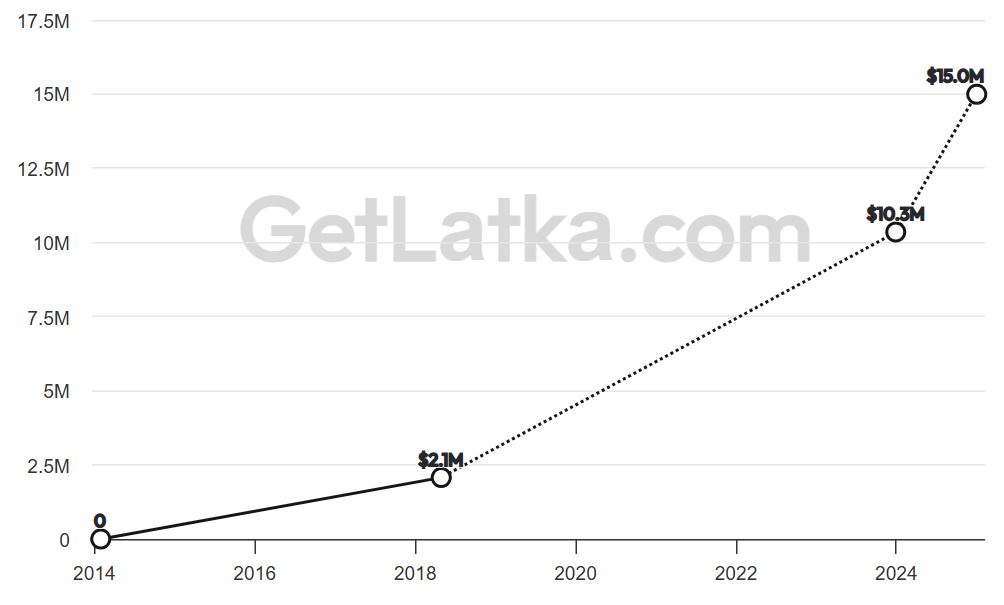
(Source: getlatka.com)
Piktochart
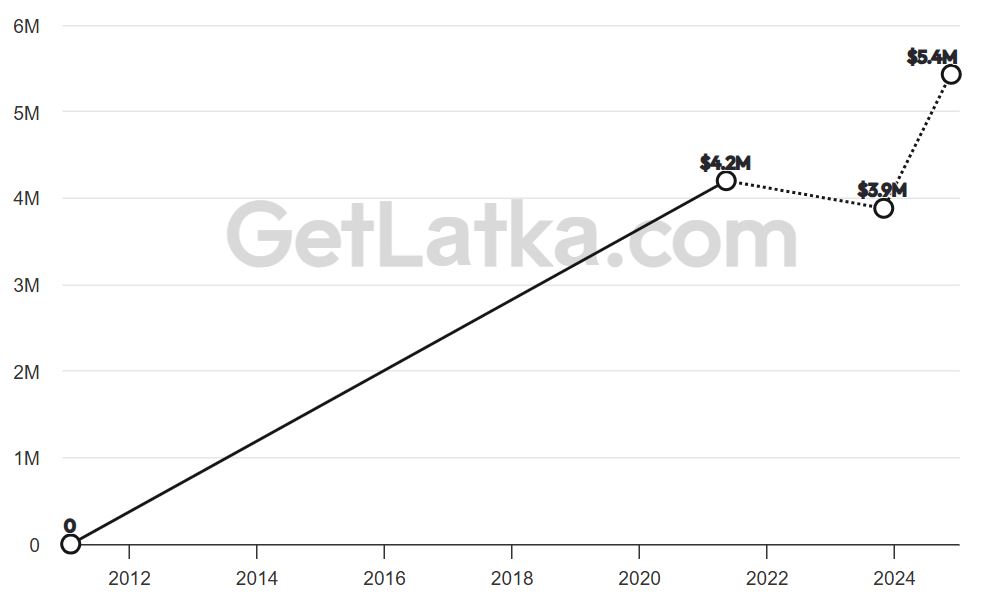
(Source: getlatka.com)
- As per Getlatka, Visme vs Piktochart statistics state that in 2024, Visme’s revenue could constitute $15 million or $18.1 million, with different sources claiming different figures.
- Going by the lower $15 million figure, the company has still witnessed full growth since $10.4 million in 2023.
- Further back, in 2018, the revenue was $2.1 million, showcasing a steady upward trajectory since its inception in 2014.
- This implies strong CAGR with a steady increase in market reach and customer base over the years.
- Piktochart, by contrast, made $5.4 million in revenue in 2024, up from $3.9 million the previous year.
- Yet the amount for 2024 is still marginally lower than the $4.2 million that it recorded as revenue back in 2021, which shows that the company has recently rekindled growth but went into some sort of decline or remained flat in the intervening period.
- Having been set up in 2011, Piktochart has a lengthier history but a much more erratic revenue path compared to Visme.
- In brief, Visme’s revenue accelerations have been more aggressive and linear in recent years compared to Piktochart, which seems to be on the path of recovery after a flat or minor decline phase.
- The contrast depicts Visme as stronger in the professional user and enterprise capturing, while Piktochart perhaps remains stronger among individual and education users, with a low average revenue per user.
Website Visitors
Visme
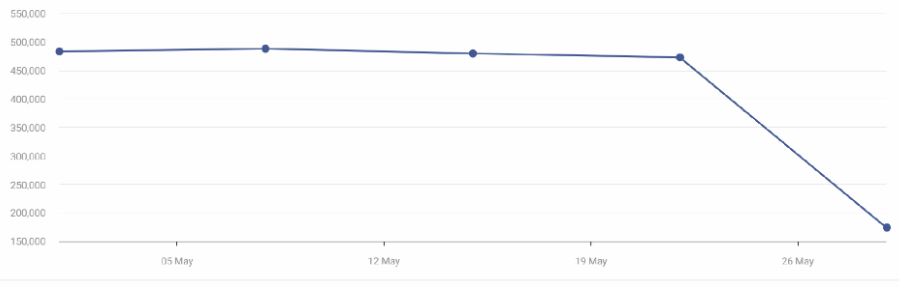
(Source: similarweb.com)
Piktochart
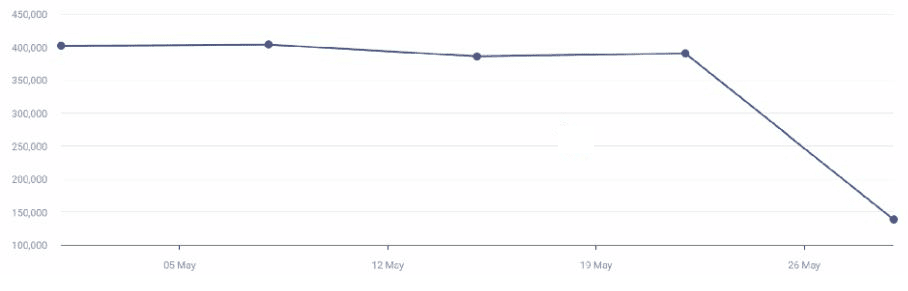
(Source: similarweb.com)
- As per Similaweb, Visme vs Piktochart statistics show that during May 2025, the weekly website visits were more for Visme than for Piktochart. For instance, in the first week (May 1–7), Visme recorded 483,398 visitors, while Piktochart saw only 402,044, making the difference soar beyond 81,000. This pattern continued into the second week of May (8–14), when Visme garnered 488,324 visits against Piktochart’s 403,795.
- For the third week (May 15–21), Visme suffered a slight decline to 479,733, while Piktochart declined more drastically to 386,045. In the fourth week (May 22–28), Visme saw further diminishment, dropping to 473,016, while Piktochart slightly rose to 390,534.
- The last three days of the month (May 29-31) saw Visme logging 173,854 visits against Piktochart’s 139,106.
- Overall, throughout the month, Visme retained a lead in terms of average stronger and steadier weekly traffic, an indication that there was some waxing and waning with both platforms.
Website Traffic By Country
Visme
(Source: similarweb.com)
Piktochart
(Source: similarweb.com)
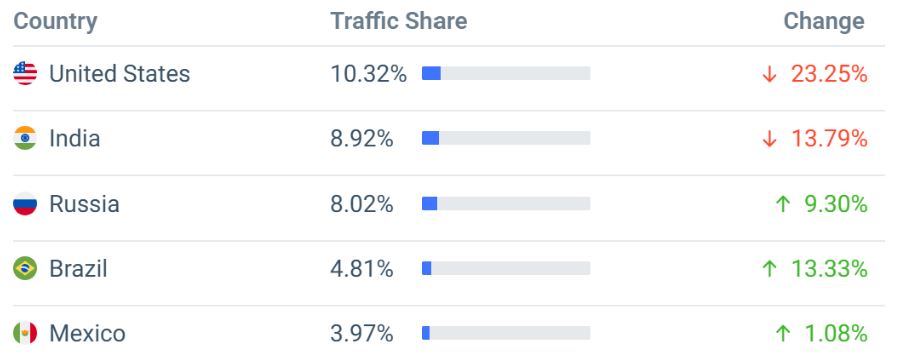
- In the 2024 website-traffic-wise split by countries, both Visme and Piktochart show noteworthy regional variations and shifts. For Visme, the United States is still its biggest traffic source, holding 10.32% of total visits, though the figure has taken a tumble of 23.25% for the period under review.
- Worldwide, after the US, India is at 8.92%, reaching a decline of 13.79%.
- Interestingly enough, Russia is an emerging market for Visme, with 8.02% of the traffic and a 9.30% increase.
- There are positive scenarios for Visme for Brazil and Mexico, with Brazil registering 4.81% (up 13.33%) and Mexico 3.97% (up 1.08%).
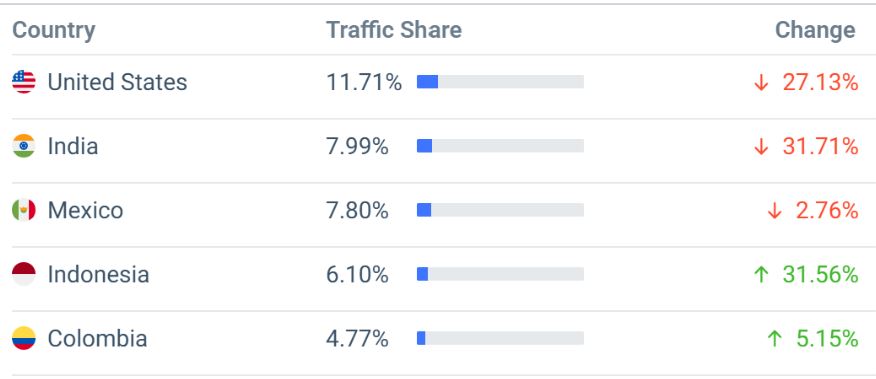
- Piktochart also sees the US as the biggest traffic source, at 11.71%, although there was a downward shock with a 27.13% decrease in traffic.
- Traffic from India, at 7.99%, the second-largest market, declined further at 31.71%. Piktochart, however, is gaining popularity in Indonesia, where traffic rose by 31.56% to constitute 6.10% of its total share.
- Mexico placed third for Piktochart at 7.80%, with a tiny nose dive of 2.76%, while Colombia is slowly growing at 4.77%, up 5.15%.
- Thus, while both platforms lose traffic from big markets such as the U.S. and India, they seem to improve influence in regions like Russia, Brazil, Indonesia, and Colombia.
- This probably hints at growing international clout and a diversification of audience demographics for both tools.
Marketing Channels
Visme
(Source: similarweb.com)
Piktochart
(Source: similarweb.com)
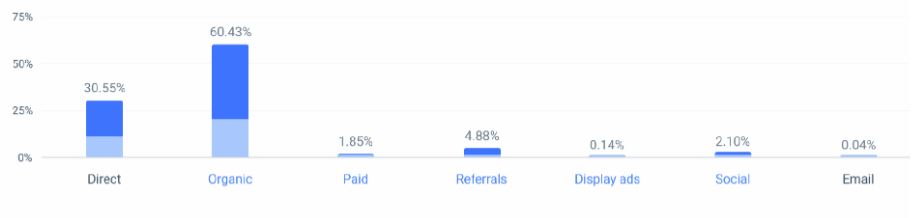
- Visme is highly dependent on organic traffic, with 60.43% of its visitors arriving through search engines.
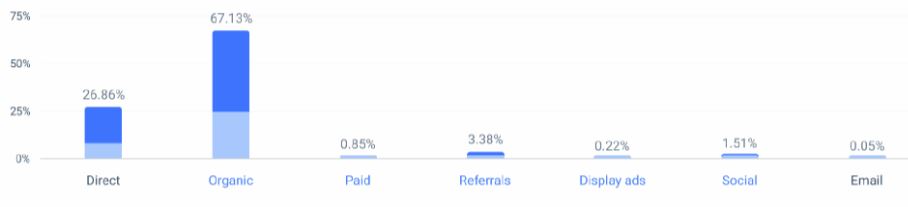
- Piktochart, in turn, beats this with 67.13% of its traffic being organic, denoting greater SEO potential or search visibility.
- Regarding direct traffic, Visme has 30.55%, whereas Piktochart is not far behind with 26.86%, so it could be that Visme does win some tiny bit of traffic from brand recognition or returning users.
- Paid traffic contributes very little, 1.85% of Visme and just under 1% for Piktochart.
- Hence, neither does much in the way of aired advertising. Referral traffic rests somewhat higher for Visme at 4.88% vis-a-vis Piktochart at 3.38%, meaning that more users enter VIA third-party websites or backlinks for Visme.
- Display advertising is negligible-thin for both, coming to just 0.14% for Visme and 0.22% for Piktochart. In contrast, social media sends 2.10% of traffic to Visme, which is higher than Piktochart’s 1.51%, implying that Visme may be performing somewhat better on social channels.
- Finally, email marketing is negligible for both, with Visme at just 0.04% and Piktochart edging ahead a little at 0.05%.
Social Traffic
Visme
(Reference: similarweb.com)
Piktochart
(Reference: similarweb.com)
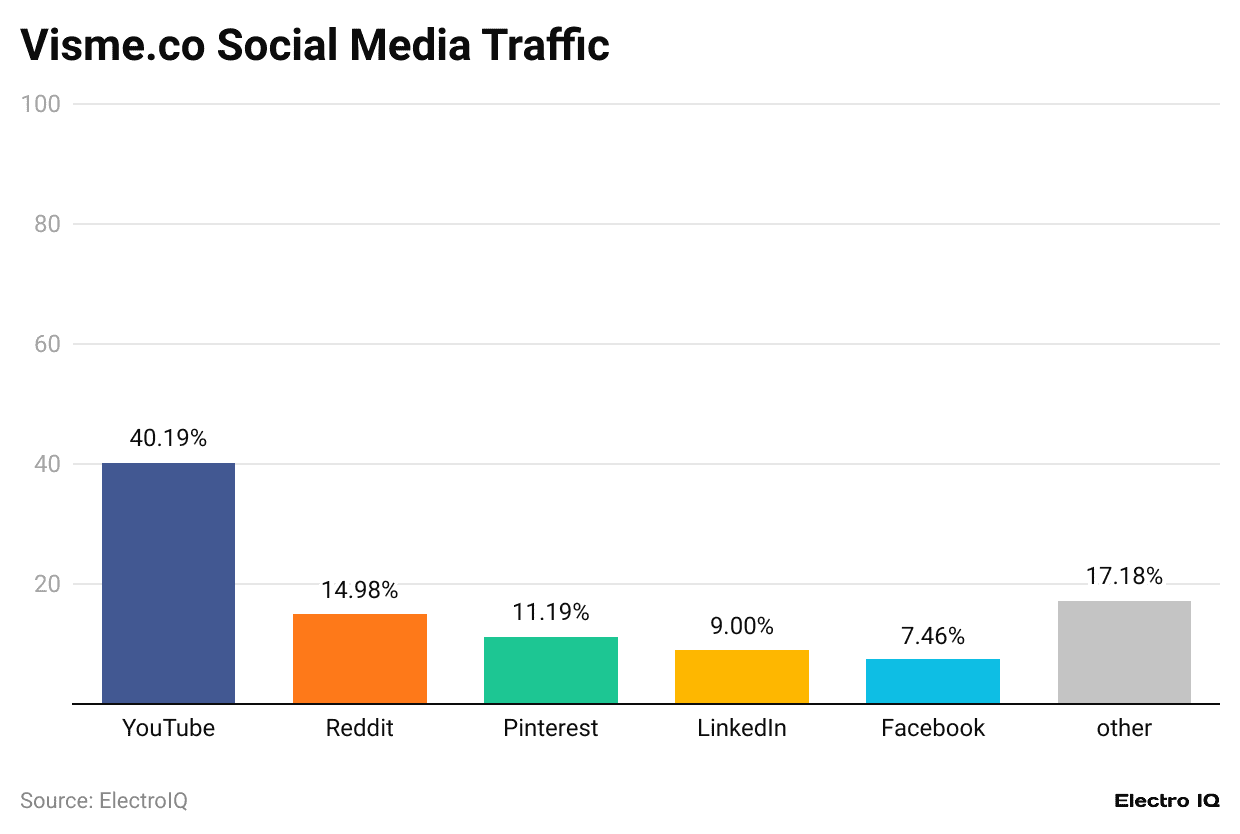
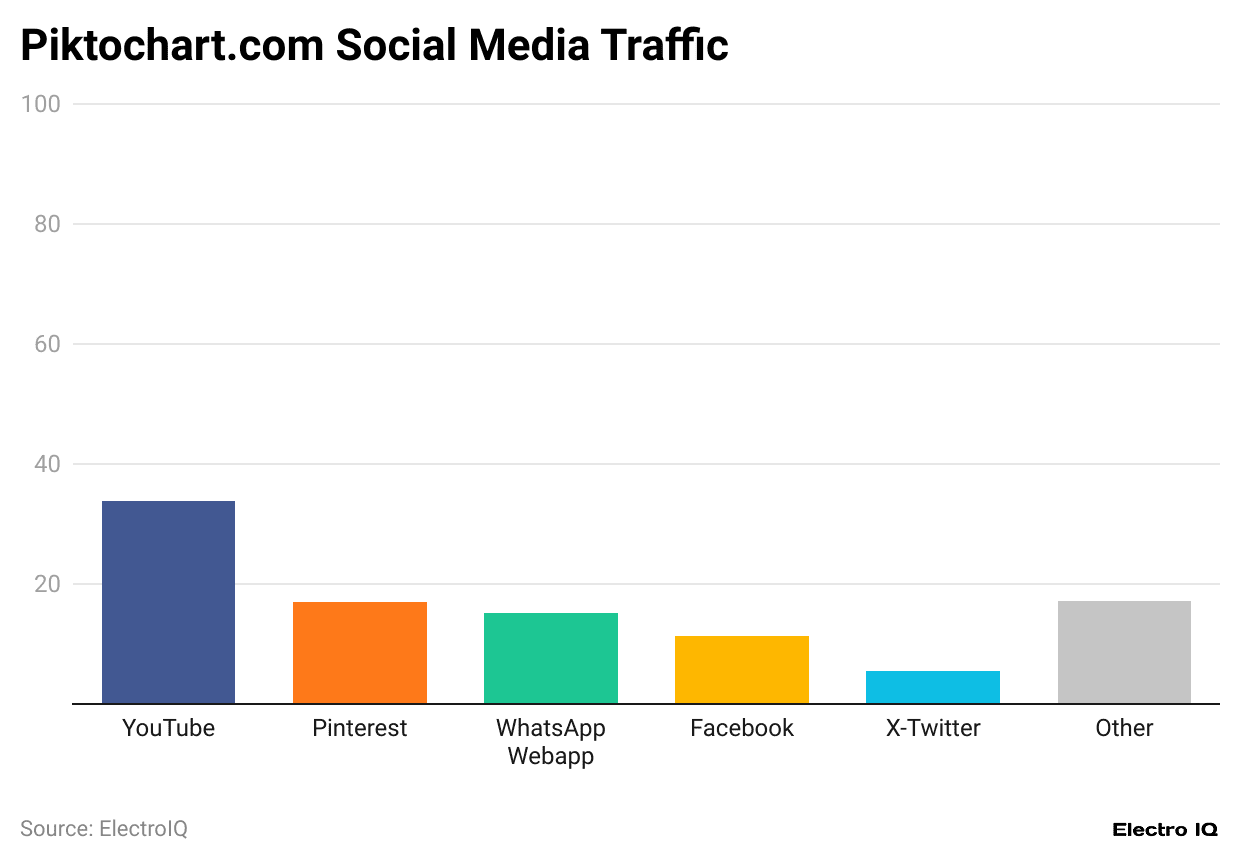
- The bulk of Visme’s social media traffic comes from YouTube, drawing 40.19% of all of its social referrals. This is especially high when compared to Piktochart, whose YouTube traffic makes up 33.85% of its total social visits.
- The next major channel for Visme is Reddit, accounting for 14.98%, while Piktochart seems not to be receiving any notable traffic from Reddit.
- Instead, 15.23% of Piktochart’s traffic comes from WhatsApp, from which Visme receives no considerable amount of visitors.
- Pinterest contributes 11.19% of Visme’s social traffic, just a bit less than Piktochart’s 16.93%, implying that Pinterest is a more significant channel for Piktochart’s users.
- Visme earns 9% from LinkedIn but nothing significant from the latter for Piktochart. In contrast, Piktochart obtains 5.46% from X, formerly Twitter, which is absent from Visme’s major sources.
- Facebook contributes to both platforms in almost equal shares- 7.46% from Visme and 11.34% from Piktochart, the script being just slightly higher for the latter.
- The remaining 17.18% of social traffic for both, from other unspecified sources, indicates a degree of diversification beyond the main platforms.
Website Traffic Demographics
Visme
(Source: similarweb.com)
Piktochart
(Source: similarweb.com)
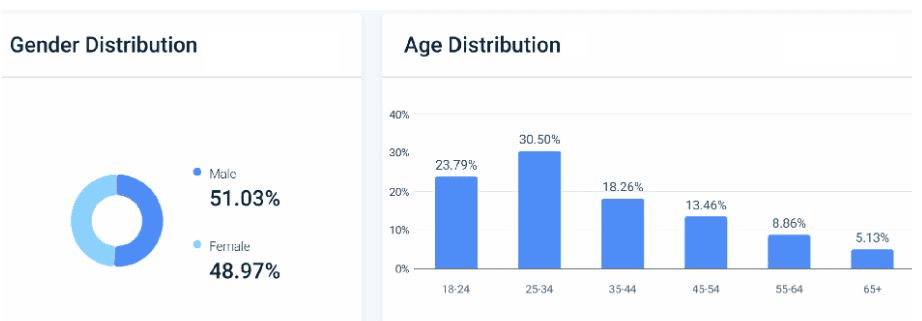
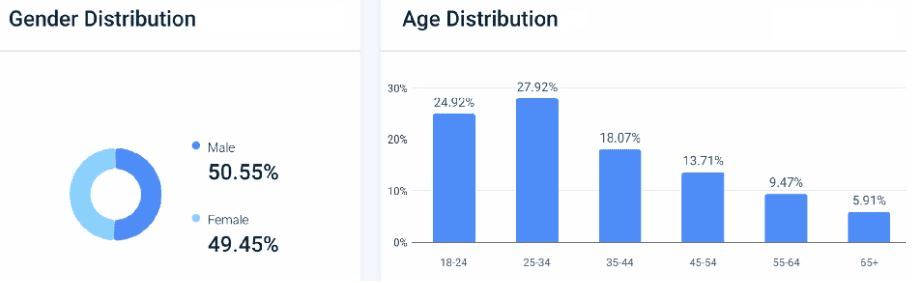
- The two platforms are evenly balanced as far as gender distribution among the website visitors. Visme had a slight male majority, with 51.03% male visitors compared to 48.97% female visitors.
- Again, Piktochart sits on an almost even split with a share of 50% males versus 49.45% females, showing that the platforms can equally attract both genders.
- In terms of age, the largest audience Yontech hosts on both platforms is found in the 25 to 34-year-old age group.
- Visme has a slight edge, holding 30.50% of its users through this age group, with Piktochart very close behind at 27.92%.
- In the 18 to 24 segment, Piktochart again grabs a slightly larger share of 24.92%, versus 23.79% belonging to Visme, giving a hint towards Piktochart-side audiences leaning a bit on the younger side. For 35 to 44, it is a near tie, with Visme at 18.26% and Piktochart at 18.07%.
- This closeness remains in the 45 to 54 category, with Piktochart ranking at 13.71% and Visme at 13.46%.
- With increasing age, Piktochart has a slight advantage over Visme. It is 9.47% in the 55 to 64 category, versus 8.86% of Visme.
- Both platforms share the same proportion of users aged 65 and over: 5.91%.
Conclusion
Visme vs Piktochart statistics: In general, one could say that Visme and Piktochart offer compelling value propositions depending on which segment of the market they target. Visme has dominance in enterprise-level features and certain interactive capabilities, while Piktochart is superior in all things user satisfaction, ease of use, and has an intimidating user interface.
Therefore, the preference would be based on high-level interactivity and marketing tools (Visme) or simplicity, cost, and reach (Piktochart). Both platforms are now integrating AI, making them well-positioned to become big contenders in the visual content domain in 2025 and beyond.
Sources
FAQ.
With revenue ranging between $15 million and $18.1 million in 2024, Visme has taken a larger share of the market compared to Piktochart, revenue pegged at $5.4 million, thus showing that Visme is marketing itself more toward an enterprise and professional patron.
With a user count of 14 million, Piktochart boasts the largest base of users compared to Visa and Musicians, which note only 7,500 paying customers. This is clearly an indication of divergent monetisation strategies: Piktochart looks for a scale, whereas Visme looks for high-value customers.
Through the whole month of May 2025, Visme consistently received greater weekly traffic than Piktochart, getting 473,000-488,000 visits weekly, as opposed to Piktochart’s 386,000-403,000.
Social traffic for Visme mainly comes from YouTube (40.19%) and Reddit (14.98%), while Piktochart drives considerably more engagements from Pinterest (16.93%) and WhatsApp (15.23%). From here on, Facebook remains a common traffic driver for both.
Traffic from the United States and India mostly makes up the bulk of traffic to both platforms; however, such traffic has declined in 2024. Nevertheless, Visme has experienced the most increase in traffic from Russia (+9.3%) and Brazil (+13.3%), while Piktochart seems to be thriving in Indonesia (+31.56%) and Colombia (+5.15%).

Tajammul Pangarkar is the co-founder of a PR firm and the Chief Technology Officer at Prudour Research Firm. With a Bachelor of Engineering in Information Technology from Shivaji University, Tajammul brings over ten years of expertise in digital marketing to his roles. He excels at gathering and analyzing data, producing detailed statistics on various trending topics that help shape industry perspectives. Tajammul's deep-seated experience in mobile technology and industry research often shines through in his insightful analyses. He is keen on decoding tech trends, examining mobile applications, and enhancing general tech awareness. His writings frequently appear in numerous industry-specific magazines and forums, where he shares his knowledge and insights. When he's not immersed in technology, Tajammul enjoys playing table tennis. This hobby provides him with a refreshing break and allows him to engage in something he loves outside of his professional life. Whether he's analyzing data or serving a fast ball, Tajammul demonstrates dedication and passion in every endeavor.