Coffee Industry Statistics By Market Size, Revenue, Brands and Facts (2025)
Updated · Nov 18, 2025

Table of Contents
- Introduction
- Editor’s Choice
- General Coffee Industry Statistics
- Coffee Industry’s Market Analyses
- Coffee Industry Statistics By Top 5 Countries
- Coffee Industry Revenue Statistics By Country
- Specialty Coffee Market Size
- Instant Coffee Market Size
- Roasted Coffee Market Size
- Ready-To-Drink Coffee Market Size
- Coffee Pods And Capsules Market Size
- Coffee Grounds Market Size
- United States Coffee Consumption Statistics
- United States’ Branded Coffee Shop Market Statistics
- Coffee Industry Statistics By Top Brands
- Coffee Consumption Statistics
- Top 10 Most Expensive Coffees Of 2025
- Sustainable Initiatives of The Coffee Industry Analysis
- Conclusion
Introduction
Coffee Industry Statistics: Coffee has become an integral part of our daily lives worldwide. This article on Coffee Industry Statistics includes several current analyses from different sources. They include information on the global market size, financial reports, user demographics, usage patterns, brand information, pricing, imports, exports, and numerous other factors. Additionally, consider steady demand, the rise of specialty coffee, and the growth of ready-to-drink cans, as well as the impact on weather, certifications, shipping costs, and supply chains.
Suppose you are an investor or a coffee enthusiast. In that case, this comprehensive report will provide you with a clear understanding of the current scenario, helping you identify key measures, opportunities, risks, and emerging players.
Editor’s Choice
- According to Statista, the total global revenue from at-home sales (including supermarkets and convenience stores) is expected to reach approximately USD 105.37 billion by 2025.
- At the same time, revenue from out-of-home (including restaurants and bars) will amount to USD 380.22 billion.
- According to Statista, in 2025, the combined revenue of the coffee market (both at-home and out-of-home) in the United States is USD 90.12 billion.
- By the end of 2025, the global specialty coffee market is expected to reach a market valuation of USD 38.2 billion.
- According to Grand View Research, the global market valuation of instant coffee was USD 80.2 billion in 2024 and will reach around USD 110.28 billion by 2030.
- The worldwide Ready-to-Drink Coffee market valuation is estimated to be around USD 38.5 billion in 2025.
- The coffee pods and capsules market is expected to grow from USD 32.62 billion in 2025 to USD 44.38 billion by 2030.
- The coffee grounds market is expected to reach USD 708.3 million in 2025.
- In 2025, approximately 75% of adults had consumed coffee in the past week.
- America’s branded coffee shop market is currently valued at USD 54 billion, with more than 42,700 stores operating under 500 different brands.
- Today, Starbucks has expanded significantly, with approximately 32,000 stores across 80 countries worldwide.
- In November 2025, Nestlé launched a three-year cost reduction plan, aiming to save at least CHF 2.5 billion (USD 2.7 billion) by 2027.
General Coffee Industry Statistics
- A report by worldcoffeeresearch.org indicates that smallholder farmers account for approximately 60% of the global coffee supply.
- Additionally, the coffee industry faces an annual innovation gap of USD 452 million.
- According to a report on precedenceresearch.com, Europe led the global coffee market in 2024, with a 34% share, followed by North America with a 28% share.
- Asia Pacific is set to expand the fastest from 2025 to 2034, with a projected CAGR of 6.2%.
- Looking at product types, roasted coffee made up 54% of the market in 2024.
- By nature, conventional coffee dominated at 84%.
- By distribution channel, B2B sales accounted for the largest share, at 63% of the total across the global coffee trade.
- According to market.us, nearly 50% of people worldwide say they prefer instant coffee.
- Surveys suggest that approximately 30% to 40% of the global population drinks coffee on a daily basis.
- Arabica beans account for approximately 60% of the market by revenue.
- They’re known for their smoother taste, which is attributed to their growth at higher elevations, typically between 3,000 and 6,000 feet.
- Some studies link drinking Robusta to lower risks of liver cancer and type 2 diabetes, though evidence varies, and it isn’t medical advice.
- Speciality coffee is graded on a scale of 100 points, such as 80 to 84.99 (Very Good), 85 to 89.99 (Excellent), and 90 to 100 (Outstanding).
- The commercial and mass-market segments are the largest, accounting for roughly 67% of total sales.
Coffee Industry’s Market Analyses
- According to Statista, the total global revenue from at-home sales (including supermarkets and convenience stores) is expected to reach approximately USD 105.37 billion by 2025.
- This market will grow at a CAGR of 3.68% from 2025 to 2030.
- In the United States, the home coffee industry is expected to generate around USD 13.01 billion in revenue.
- At the same time, revenue from out-of-home (including restaurants and bars) will amount to USD 380.22 billion.
- As of 2025, the total combined revenue is estimated to reach approximately USD 485.59 billion.
- Meanwhile, at-home coffee sales average about USD 13.43 per person.
- Households are set to brew around 6.15 billion kg of coffee.
- Drinking outside the home will reach approximately 1.31 billion kg by 2025.
- During the same period, the total coffee volume (both at home and out-of-home) amounts to 7.46 billion kilograms.
- For 2025, the average at-home amount per person is expected to be 0.78 kg.
- In 2026, the at-home coffee volume is projected to increase by approximately 1.0%.
Coffee Industry Statistics By Top 5 Countries
United States
- By 2025, at-home coffee revenue (from supermarkets and convenience stores) will reach USD 13.01 billion.
- Out-of-home revenue (restaurants and bars) reaches USD 77.11 billion, totalling USD 90.12 billion.
- At-home revenue is projected to grow at a 1.58% CAGR from 2025 to 2030.
- Per person, at-home revenue is expected to be USD 37.46 in 2025.
- At-home coffee volume totals 930.22 million kgs in 2025; out-of-home volume is 216.85 million kgs; combined volume is 1.15 billion kgs.
- In 2026, at-home volume is expected to decline by 0.6%.
- The average at-home volume per person is estimated to be 2.68kg in 2025.
Furthermore, other four countries coffee industry market analyses in 2025 are mentioned below:
| Metrics | Brazil | Germany | Japan | Italy |
| At-home revenue (supermarkets, convenience) | USD 8.71 billion | USD 7.04 billion | USD 6.39 billion | USD 6.27 billion |
| Out-of-home revenue (restaurants, bars) | USD 26.32 billion | USD 15.82 billion | USD 28.67 billion | USD 9.32 billion |
| Combined revenue | USD 35.03 billion | USD 22.85 billion | USD 35.05 billion | USD 15.60 billion |
| At-home revenue growth (CAGR) | 3.85% | 1.95% | 0.09% | 5.36% |
| Per-capita at-home revenue | USD 40.92 | USD 83.70 | USD 51.90 | USD 106.09 |
| At-home volume | 987.55 million kg | 408.15 million kg | 190.90 million kg | 315.33 million kg |
| Out-of-home volume | 179.70 million kg | 57.91 million kg | 40.13 million kg | 85.82 million kg |
| Combined volume | 1.17 billion kg | 466.06 million kg | 231.03 million kg | 401.15 million kg |
| Per-capita at-home volume | 4.64 kg | 4.85 kg | 1.55 kg | 5.33 kg |
| At-home volume growth (2026) | +0.7% | -2% | -1.8% | +6.9% |
By Regions (2025)
| Matrics | Americas | Africa | Asia | Australia & Oceania | Caribbean | Europe |
| Revenue (at-home) | USD 32.25 billion | USD 6.79 billion | USD 27.43 billion | USD 1.94 billion | USD 1.05 billion | USD 36.97 billion |
| Revenue (out-of-home) | USD 141.51 billion | USD 8.52 billion | USD 108.95 billion | USD 12.04 billion | USD 3.71 billion | USD 109.20 billion |
| Revenue (combined) | USD 173.76 billion | USD 15.31 billion | USD 136.37 billion | USD 13.98 billion | USD 4.76 billion | USD 146.17 billion |
| At-home revenue CAGR (2025 to 2030) | 3.18% | 8.27% | 3.64% | 3.53% | 5.54% | 3.21% |
| Per-capita at-home revenue | USD 31.55 | USD 5.05 | USD 5.98 | USD 44.06 | USD 25.95 | USD 43.58 |
| Volume (at-home) | 2.46 billion kg | 453.53 million kg | 1.22 billion kg | 88.06 million kg | 59.19 million kg | 1.92 billion kg |
| Volume (out-of-home) | 521.40 million kg | 45.85 million kg | 266.07 million kg | 30.15 million kg | 15.31 million kg | 443.21 million kg |
| Volume (combined) | 2.98 billion kg | 499.38 million kg | 1.49 billion kg | 118.21 million kg | 74.51 million kg | 2.37 billion kg |
| Average at-home volume per person | 2.41 kg | 0.34 kg | 0.27 kg | 2 kg | 1.46 kg | 2.27 kg |
Coffee Industry Revenue Statistics By Country
- According to Statista, in 2025, the combined coffee market revenue (at-home + out-of-home) is USD 90.12 billion in the United States, USD 35.05 billion in Japan, and USD 33.02 billion in Brazil.
- Meanwhile, Canada records USD 24.47 billion, while Germany posts USD 22.85 billion.
Furthermore, other countries’ revenue in 2025 is stated in the table below:
| Country | Revenue (USD billion) |
| China | 20.42 |
| South Korea | 15.64 |
| Italy | 15.6 |
| Spain | 13.55 |
| Australia | 13 |
| France | 12.91 |
| United Kingdom | 12.32 |
| Indonesia | 11.89 |
| Netherlands | 8.5 |
| Denmark | 7.82 |
| Switzerland | 3.1 |
Specialty Coffee Market Size
(Source: market.us)
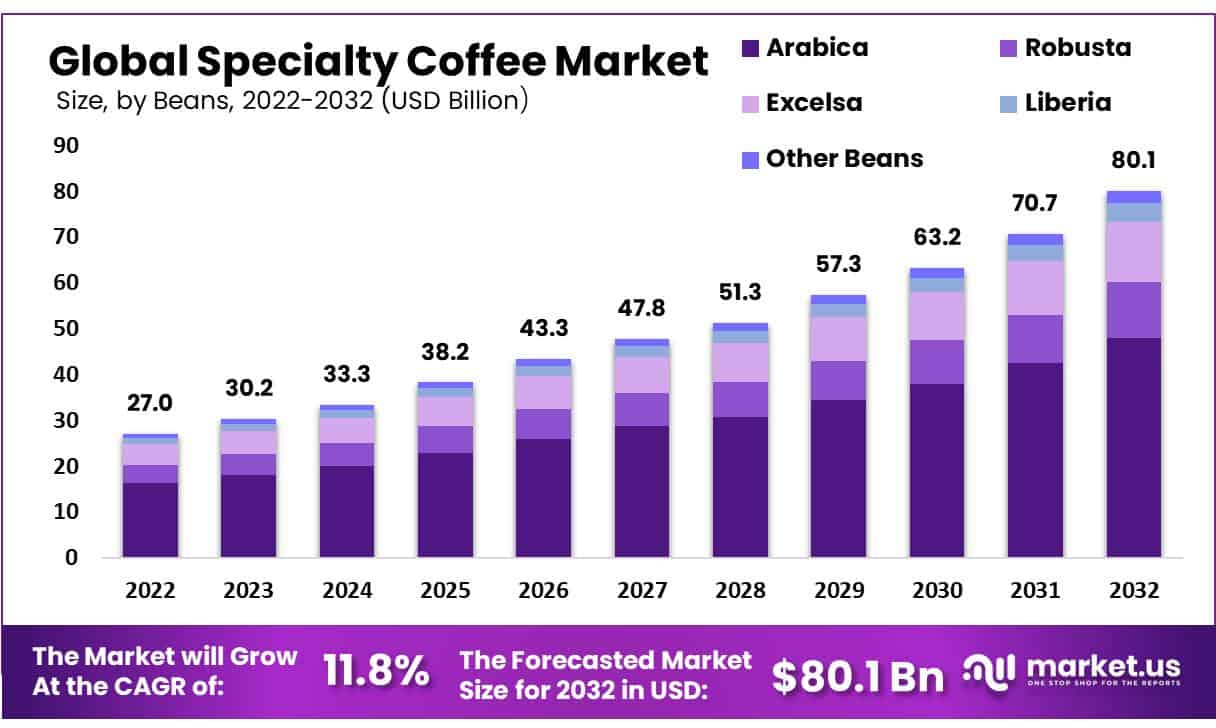
- The global specialty coffee market was valued at USD 27.0 billion in 2022 and is projected to reach USD 80.1 billion by 2032, growing at a steady 11.8% CAGR through the forecast period.
- The market is shaped by different coffee bean types, and Arabica beans hold the strongest position with 60% of global revenue because they offer a smoother taste and higher aroma quality than other beans.
- The quality grade segment shows that the 85 to 89.99 grade category accounted for 39.12% of overall demand, driven mainly by its rich fragrance and balanced flavor profile that appeal to specialty coffee consumers.
- The commercial segment is experiencing rising demand because coffee shops make specialty coffee more accessible, offering a variety of flavors and brewing choices that attract both regular and new customers.
- Online platforms played a significant role in distribution, capturing 32.4% of total revenue in 2022, supported by the convenience of access to a broader range of premium coffee products.
- The market has grown due to changing consumer tastes, increasing interest in high-quality coffee, the proliferation of third-wave coffee culture, and heightened attention to sustainability throughout the supply chain.
- The industry still faces challenges such as price fluctuations resulting from climate-related crop disruptions, the difficulty of maintaining uniform quality across different coffee batches, and competition from established coffee brands.
- Europe led the global specialty coffee market with 30% of total consumption in 2022 because of its strong café culture, high coffee awareness, and preference for premium flavors.
Instant Coffee Market Size
- According to Grand View Research, the global market valuation of instant coffee was USD 80.2 billion in 2024 and will reach around USD 110.28 billion by 2030.
- The market is supposed to grow at a CAGR of 5.4% from 2025 to 2030.
- From 2025 to 2030, the instant coffee market in North America is expected to grow at a 5.5% CAGR, with the United States alone projected to grow at a up to 5.3% CAGR.
- Instant coffee Jars were the top packaging format in 2024, earning 48.70% of revenue.
- Moreover, regular instant coffee held the largest market share with 95.87%.
- The majority of revenue came from business-to-consumer (B2C) sales, which accounted for 80.41% of global revenue.
Roasted Coffee Market Size
- According to a report shared by Future Market Insights, the market valuation of the roasted coffee industry is going to reach around USD 50.4 billion by the end of 2025.
- The compound annual growth rate of the market will grow at a 5.8% CAGR from 2025 to 2035, resulting in USD 88.5 billion.
- Based on types, in 2025, the Arabica coffee secured the leading segment with a share of 61.3%, followed by Robusta with 38.7%.
- Depending on the distribution channel, the B2B and B2C segments captured a market share of 68.7% and 31.3%, respectively.
- Nestlé S.A. captured the highest company share with 23% in 2025.
(Source: futuremarketinsights.com)
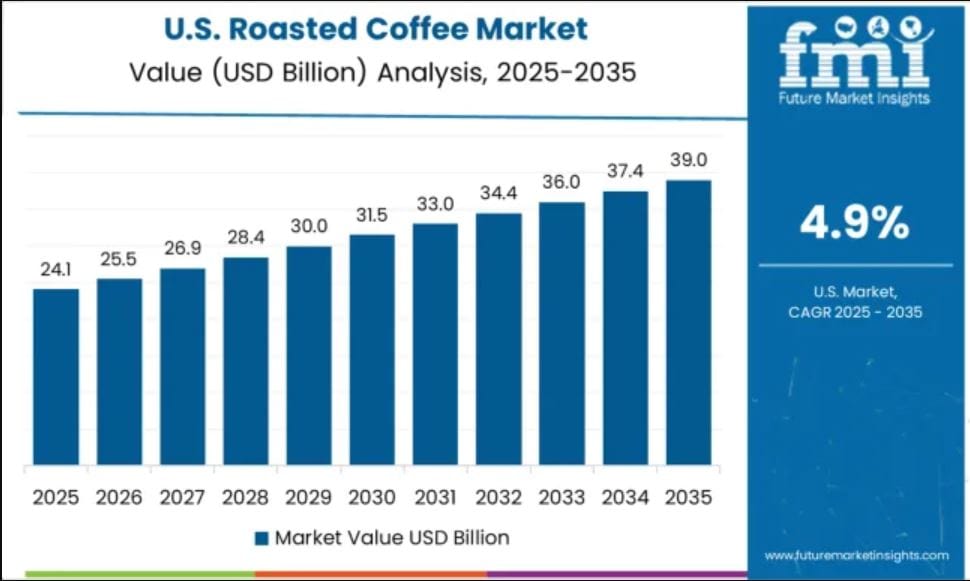
- As of 2025, the market size of the United States’ roasted coffee industry is expected to reach around USD 24.1 billion.
- The expected market value in the coming years is represented as 2026 (USD 25.5 billion), 2027 (USD 26.9 billion), 2028 (USD 28.4 billion), 2029 (USD 30 billion), 2030 (USD 31.5 billion), 2031 (USD 33 billion), 2032 (USD 34.4 billion), 2033 (USD 36 billion), 2034 (USD 37.4 billion), and 2035 (USD 39 billion).
(Source: futuremarketinsights.com)
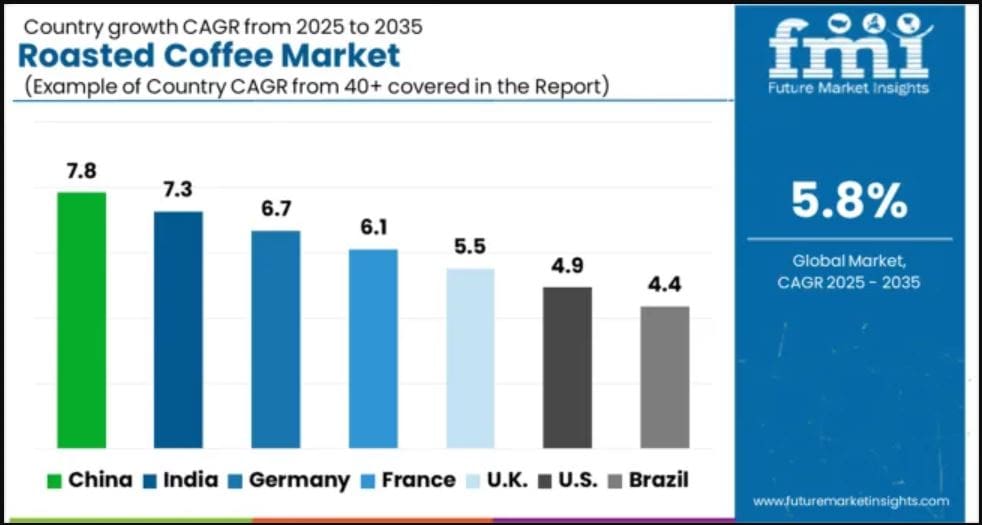
- In the roasted coffee market, the country-wise growth CAGR from 2025 to 2035 is estimated as China (7.8%), India (7.3%), Germany (6.7%), France (6.1%), the UK (5.5%), the U.S. (4.9%), and Brazil (4.4%).
The table below includes the European countries’ roasted coffee market valuation in 2025:
| Country | Market Share |
| Germany | 12.7% |
| France | 9.5% |
| Italy | 8.5% |
| Benelux | 12% |
| Nordic | 12.9% |
| Spain | 17.8% |
| Rest of Europe | 26.6% |
Ready-To-Drink Coffee Market Size
(Source: futuremarketinsights.com)
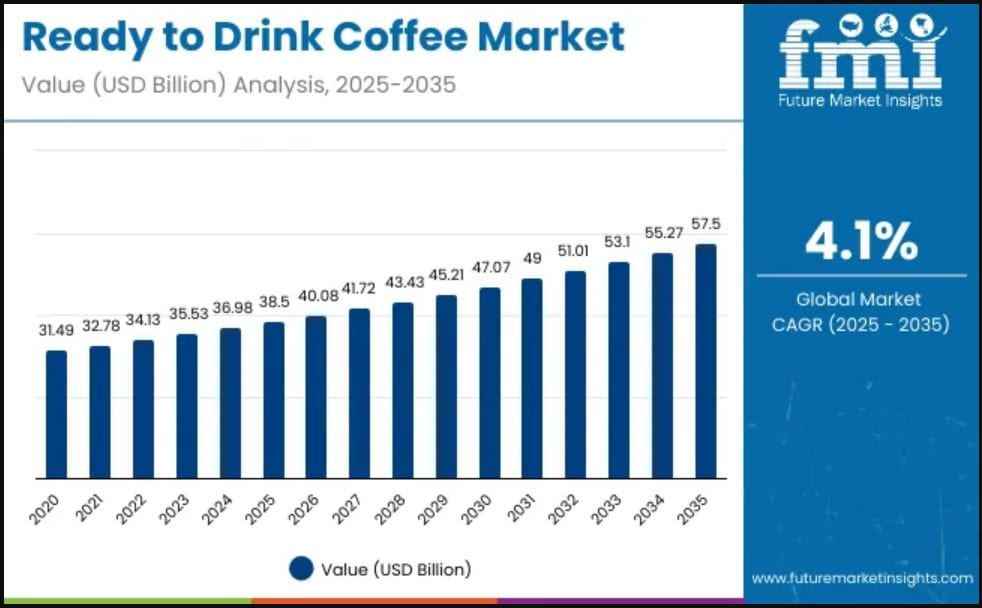
- The worldwide Ready-to-Drink Coffee market valuation is estimated to be around USD 38.5 billion in 2025.
- In the coming years, the market sizes are expected to reach USD 40.08 billion (2026), followed by USD 41.72 billion (2027), USD 43.43 billion (2028), USD 45.21 billion (2029), USD 47.07 billion (2030), USD 49 billion (2031), USD 51.01 billion (2032), USD 53.1 billion (2033), USD 55.27 billion (2034), and USD 57.5 billion (2035).
- The global market is expected to grow at a CAGR of 4.1% from 2025 to 2035.
- As of 2025, the regular segment in the industry is leading the market with a 95% share.
- Espresso-based products hold a 37% market share, popular for their strong flavour and high caffeine content.
- Nestlé captured the highest company share with 18%.
The market growth of Ready-to-Drink Coffee in the different countries mentioned below:
| Country | CAGR (From 2025 to 2035) |
| India | 4.2% |
| China | 3.0% |
| Germany | 2.9% |
| Japan | 3% |
| United Kingdom | 2.4% |
| United States | 2.3% |
| Brazil | 2.2% |
Coffee Pods And Capsules Market Size
(Source: mordorintelligence.com)
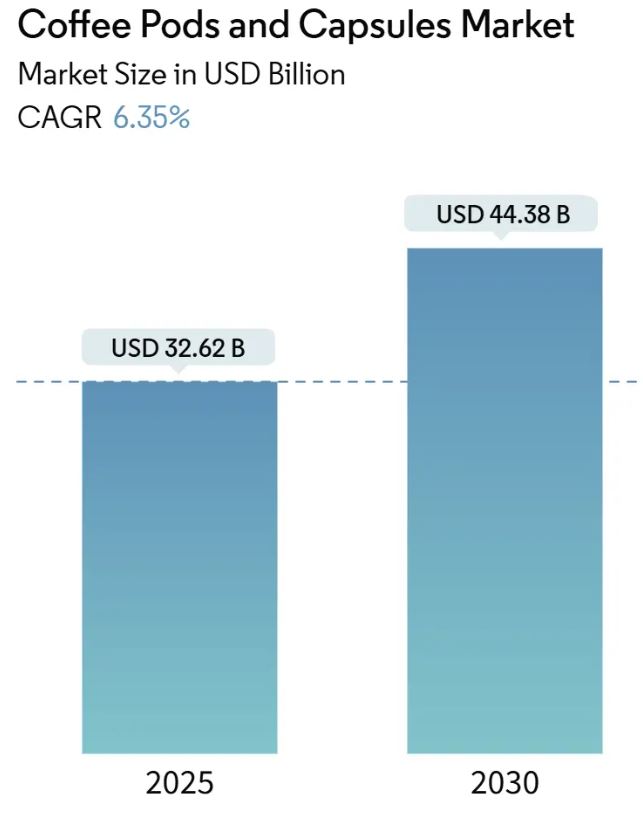
- The coffee pods and capsules market is expected to grow from USD 32.62 billion in 2025 to USD 44.38 billion by 2030.
- This growth is projected at a steady rate of 6.35% annually.
The segmental market shares of this industry are estimated in the table below:
| Segments | Market Share (2024) |
CAGR (2025 to 2030) |
| (Products): Capsules | 52.34% | Pods (6.72%) |
| (Category): Conventional coffee | 83.51% | Organic variants (7.44%) |
| (Packaging Material): Plastic | 54.52% | Aluminium formats (6.94%) |
| (Distribution Channel): Off-trade | 63.12% | On-trade (6.73%) |
| (Geography): Europe | 36.68% | Asia-Pacific (7.23%) |
Coffee Grounds Market Size
(Source: mordorintelligence.com)
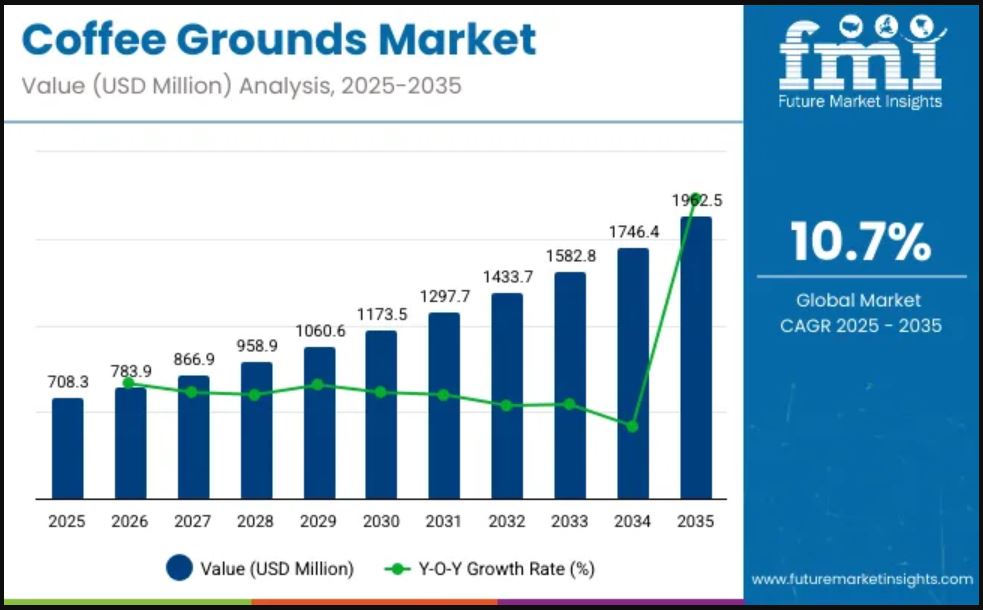
- The coffee grounds market is expected to reach USD 708.3 million in 2025.
- By 2035, it is projected to grow to USD 1,962.5 million, with a CAGR of 10.7%.
- Moreover, market valuations in the coming years are expected to be USD 783.9 million (2026), followed by USD 866.9 million (2027), USD 958.9 million (2028), USD 1060.6 million (2029), USD 1173.5 million (2030), USD 1297.7 million (2031), USD 1433.7 million (2032), USD 1582.8 million (2033), and USD 1746.4 billion (2034).
- By 2025, Arabica coffee grounds are projected to hold a 73.1% market share.
- Additionally, the market share of agricultural use of coffee grounds accounted for 39.3%.
In the Coffee Grounds market’s CAGR by country is mentioned below:
| Country | CAGR (from 2025 to 2035) |
| China | 11.6% |
| Japan | 10.0% |
| United States | 7.9% |
| Germany | 8.7% |
| India | 7.2% |
United States Coffee Consumption Statistics
(Reference: amraandelma.com)
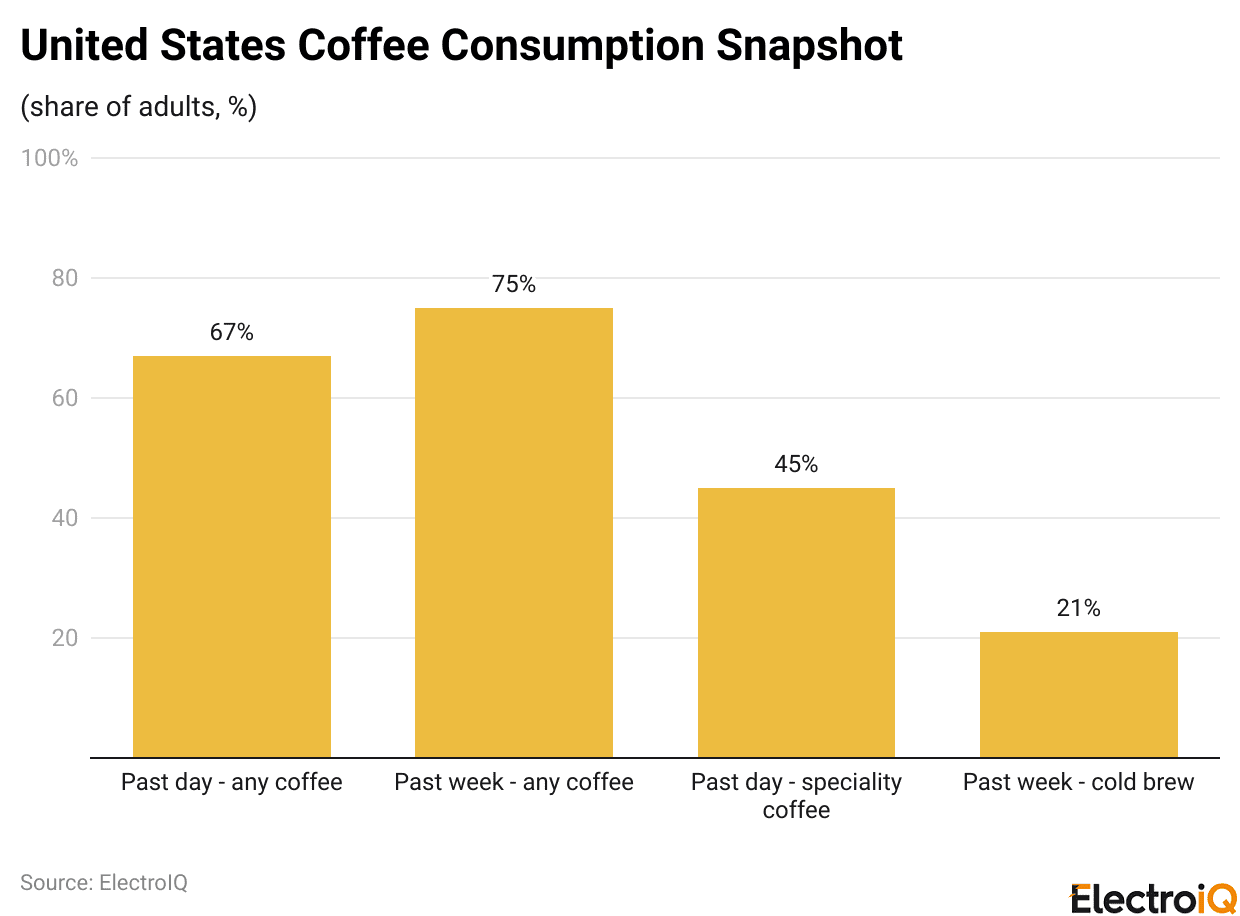
- The above graphical representation indicates that, in 2025, approximately 75% of adults have consumed coffee in the past week, while 67% of them drink coffee daily.
- Speciality coffee is enjoyed by 45% of adults regularly.
- Cold brew consumption is on the rise, with 21% of adults reporting that they drink it every week.
United States’ Branded Coffee Shop Market Statistics
(Source: worldcoffeeportal.com)
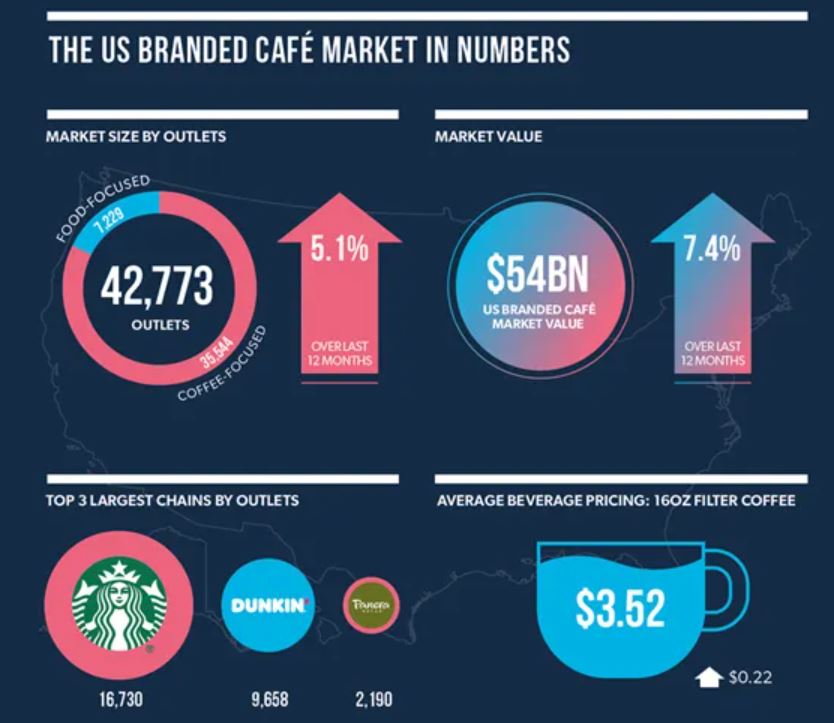
- America’s branded coffee shop market is currently valued at USD 54 billion, with more than 42,700 stores operating under 500 different brands.
- By 2028, the market is expected to exceed USD 72 billion.
- As of October 2024, the market has experienced a 7.4% increase in value.
- Among the largest chains, Starbucks leads with 16,730 outlets, followed by Dunkin’ with 9,668, and Tim Hortons with 2,190.
- The average price for a 16-oz filter coffee is USD 3.52, marking an increase of USD 0.22.
- Furthermore, the number of coffee shops is expected to surpass 51,100 by September 2029.
Coffee Industry Statistics By Top Brands
Starbucks
(Source: cornercoffeestore.com)
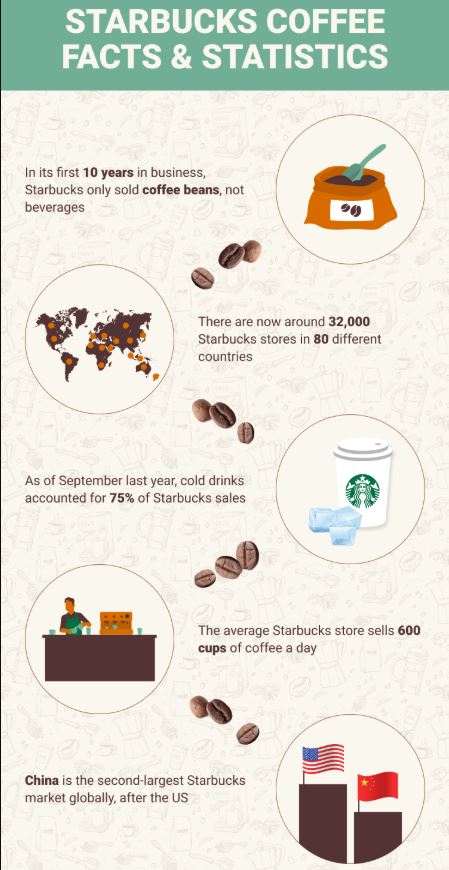
- In its first 10 years of business, Starbucks only sold coffee beans, not beverages.
- Today, Starbucks has expanded significantly, with approximately 32,000 stores across 80 countries worldwide.
- As of September last year, cold drinks made up 75% of Starbucks’ sales.
- On average, each Starbucks store sells 600 cups of coffee daily.
- Additionally, China has become the second-largest market for Starbucks globally, following the United States.
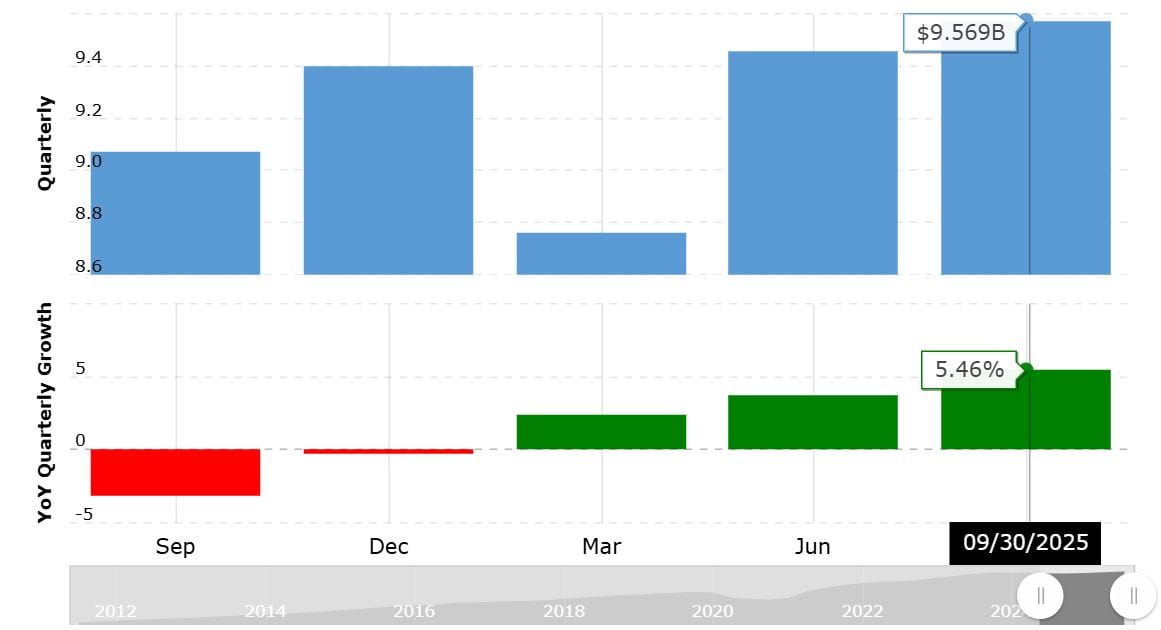
(Source: macrotrends.net)
- By the end of the third quarter of 2025, Starbucks had generated USD 9.569 billion in revenue, representing a 5.46% increase from the same quarter in 2024.
|
Quarter |
Revenue
(USD billion) |
YoY Quarterly Growth Rate |
|
Q2, 2025 |
9.456 | +3.75% |
| Q1, 2025 | 8.762 |
+2.32% |
- According to worldcoffeeportal.com, as of December 31, 2024, Nestlé’s overall revenue reduced by 1.8%, totalling CHF 91.3 billion (approximately USD 10 billion).
- At the same period, the net profits accounted for CHF 10.8 billion (approximately USD 12 billion).
- In Nespresso, Nestlé’s coffee pod division, experienced a slight growth of 0.1%, with sales totalling CHF 6.4 billion (approximately USD 7.1 billion).
- In November 2025, Nestlé launched a three-year cost reduction plan, aiming to save at least CHF 2.5 billion (USD 2.7 billion) by 2027.
- The company also plans to increase its marketing spend from 8% to 9% of sales by 2025.
- In 2024, Nescafé, Nestlé’s largest coffee brand, sourced 32% of its coffee from farmers who used regenerative agriculture practices.
- This exceeded the brand’s 2025 target of 20%, showing the growing adoption of regenerative farming among coffee growers.
Coffee Consumption Statistics
| Preferences | Valuation |
| Share of Americans who drink coffee daily | 73% |
| Share of people who drink coffee at least once a week | 93% |
| Once a month or less | 8% (weekly: 4%, monthly:1% and less often: 3%) |
| Share of retirees who drink coffee daily | 81% |
| Share of coffee drinkers who limit intake to 3 to 5 cups daily | 36% |
| 1 to 2 cups daily | 60% |
| At least 6 cups daily | 4% |
| Most preferred brewing method | Keurig (30%) |
| Other popular brewing methods | Drip (29%), Ground (20%), Instant (8%), French Press (8%) and Whipped Coffee (1%) |
| Share of people who prefer coffee black | 18% |
| Males are more likely to drink black coffee than females | Males: 31%, Females: 13% |
| Share of people who add milk or cream | 77% |
| Top milk/creamer | Coffee-Mate/International Delight (51%), Half-and-half (43%), 2% Milk (26%), Almond Milk (24%), Oat Milk (19%), and Light Cream (17%). |
| Share of people who prefer coffee with a sweetener | 44% |
| Most popular sweeteners | Normal Sugar (67%), Stevia/Zero-Calorie Sweeteners (38%), Honey (19%), Agave (10%), and Maple Syrup (7%). |
| Average sweetener usage per coffee drink | 3 packets of sugar or stevia |
Top 10 Most Expensive Coffees Of 2025
- Kopi Luwak (The Kopi Luwak Company): USD 30 to 100 per cup
- Kona Coffee (Hawaiian Kona Coffee Brands): USD 60 per pound
- Blue Mountain Coffee (Jamaica Blue Mountain Coffee): USD 30 and 70 per pound
- Geisha Coffee (Finca El Injerto): USD 500 per pound
- Black Ivory Coffee (Black Ivory Coffee Company): USD 500 per pound
- Yemeni Coffee (Best of Yemen Auction): USD 1,159 per kilogram
- Monkey Coffee (Local Producers in Taiwan/India): USD 100 to 500 per pound
- Bat Poop Coffee (Local Producers in Costa Rica/Madagascar): USD 101 per pound
- Jacu Bird Coffee (Camocim Estate): USD 1,700 per kilogram
- Misha Coffee (Local Producers in Peru): USD 1,400 per kilogram
Here is a more in‑depth report on the top 10 most expensive coffees.
Sustainable Initiatives of The Coffee Industry Analysis
- The Global Coffee Platform (GCP) recognised three new sustainability schemes in May 2025 (CONNECT, LEGACY Protocol, Sucden Coffee Verified) as equivalent to its Coffee Sustainability Reference Code.
- A report shared by intelmarketresearch.com states that the global sustainable coffee segment was valued at USD 874 million in 2024 and is projected to reach USD 974 million by 2025.
- Improving coffee farm productivity can reduce greenhouse gas emissions by up to 32%.
- By 2050, climate change could reduce suitable land for coffee cultivation by 48% to 97%.
Conclusion
The sales of Coffee are still increasing, but the market is changing rapidly, depending upon steady drinking habits, an increase in specialty coffee, and consistent cost and weather pressures at every step. The industry’s spending continues to split between at-home brews and cafes, while digital tools, better farming practices, and certifications are reshaping how beans are grown, traded, and roasted.
The article covered all the essential segments of the global coffee industry, and a thorough examination will provide better insights.
Sources
FAQ.
Farms, cooperatives, exporters, importers, roasters, wholesalers, cafés, kiosks, carts, chains, subscriptions, ecommerce, RTD-brands, equipment, training, consulting, marketplaces, franchising, private-label, corporate-catering.
The leaders in coffee production are primarily located in tropical regions; Brazil and Vietnam typically hold the top spots.
Factors such as weather, crop yields, currency fluctuations, shipping costs, and futures market sentiment.
Beans graded for high quality and traceable origin, often sold with lighter roasts and distinct flavours.
Consistent quality, fair sourcing, clear storytelling, and convenient formats.
Farm sensors, better processing, digital traceability, roast profiling, and café POS data.

Maitrayee Dey has a background in Electrical Engineering and has worked in various technical roles before transitioning to writing. Specializing in technology and Artificial Intelligence, she has served as an Academic Research Analyst and Freelance Writer, particularly focusing on education and healthcare in Australia. Maitrayee's lifelong passions for writing and painting led her to pursue a full-time writing career. She is also the creator of a cooking YouTube channel, where she shares her culinary adventures. At Smartphone Thoughts, Maitrayee brings her expertise in technology to provide in-depth smartphone reviews and app-related statistics, making complex topics easy to understand for all readers.