Table of Contents
- Introduction
- Editor’s Choice
- History Of Display Technology
- PC Monitor Vendor Shipment Worldwide
- TV Panel Shipments
- Mobile Resolution Utilization Worldwide
- Console Screen Resolution Worldwide
- Display Technology Overview
- By Key Segments
- Display Technology Regional Analysis
- By Technological Advancements
- By Competitive Landscape
- Conclusion
Introduction
Display Technology Statistics: Consumers have various visual devices that cater to their requirements, from devices as small as smartwatches to widescreen televisions.
As of 2024, developments have been related to several display technologies. Likewise, several manufacturers have focused on developing visually stunning gadgets with enormous display systems. As we advance, we will discuss the exciting aspects revolving around display technology.
Editor’s Choice
- LCD dominates the market by accounting for 50% of the total market share.
- Sustainability is a significant concern for businesses that manufacture display panels.
- The demand for 4k and 8k resolution displays is expected to ensure that it reach a peak of USD 24 billion.
- With display technologies such as OLEDs and LEDs, Samsung remains the market leader in their popularity.
- The Asia Pacific region is by far the largest market for display technologies by region, accounting for 30.5 of % global market share in 2023.
History Of Display Technology
- As per display technology statistics, CRT (Cathode ray technology) was the mainstay of display technology for most of the 20th
- With the increasing penetration of smartphones and the growth of television systems, there was a demand for devices that could work effectively with lower power consumption.
- By the end of the 20th century, LCDs and LEDs had become mainstream display technology. They are lighter, more efficient, and have a more vivid display than CRTs.
- As of 2024, virtually no devices offer CRT technology.
- It is predicted that the size of the global display market in the US is expected to reach $177.1 billion.
PC Monitor Vendor Shipment Worldwide
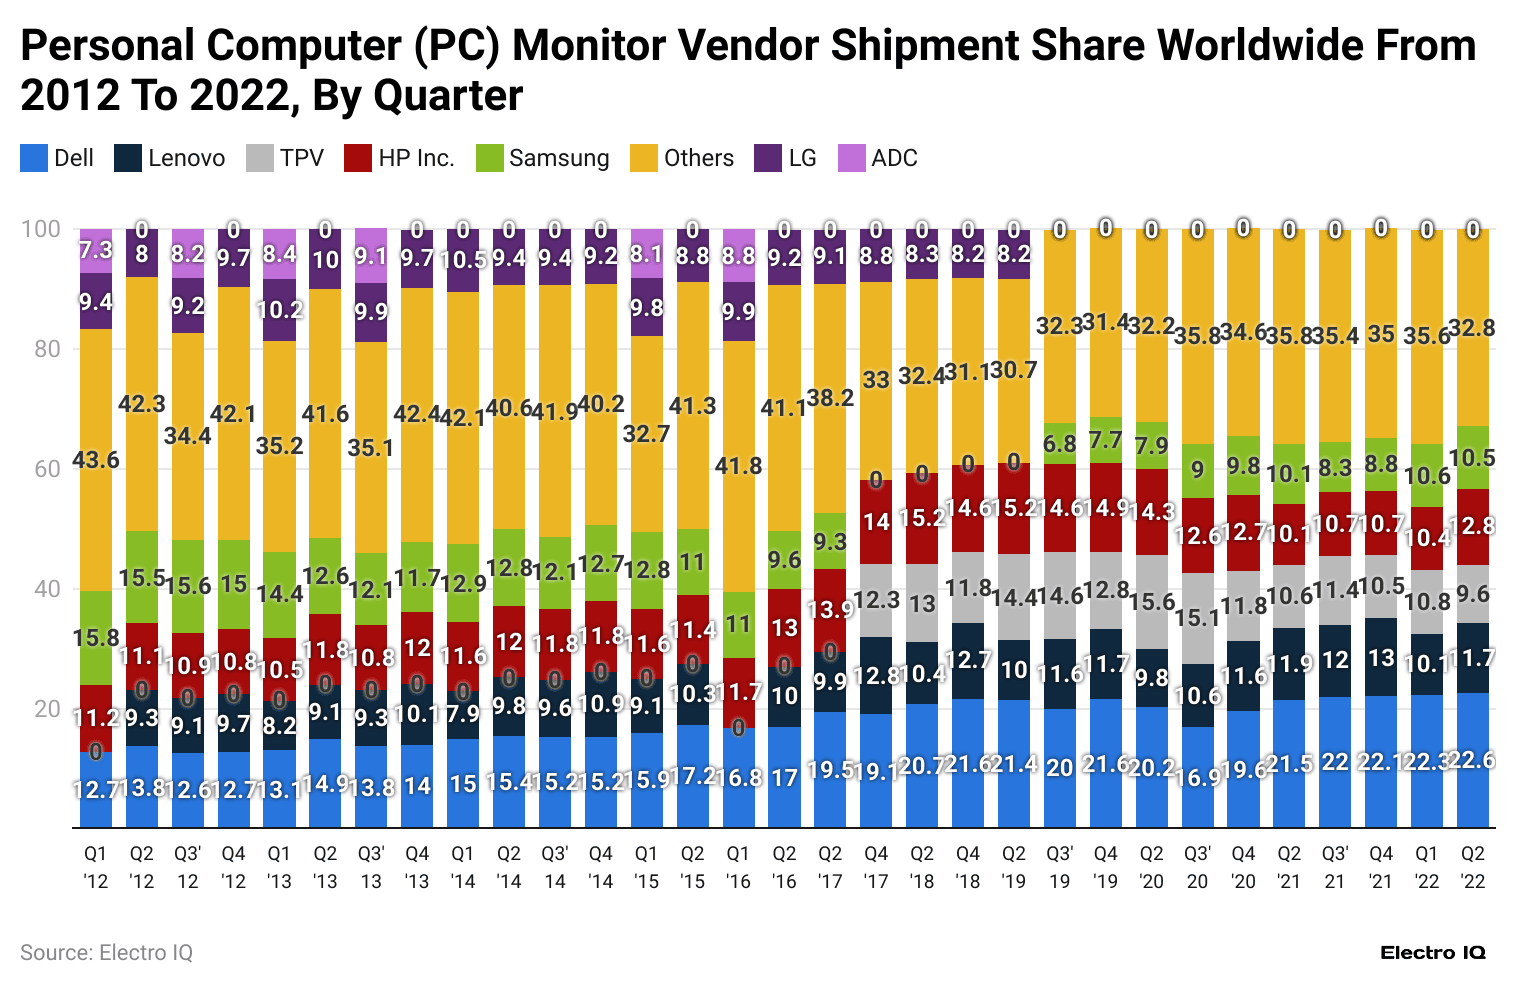
(Reference: Statista.com)
- Dell’s market share has steadily increased, averaging between 20% and 30%, with a significant rise beginning in Q1 2021 and peaking in Q2 2022.
- HP Inc. experienced a rise in market share starting in Q1 2017, maintaining a steady position between 15% and 25%, with a noticeable peak around Q4 2019.
- Lenovo’s market share has fluctuated but remained consistent, usually around 10% to 15%, with a significant increase between Q2 2018 and Q4 2022.
- LG held a consistent position in the market, ranging between 10% and 15%, with a noticeable rise beginning in Q2 2017 and continuing until 2022.
- TPV, which includes brands like AOC and Philips, maintained a strong share from Q3 2015 to Q1 2021, but its market share decreased significantly after Q1 2021.
- Samsung’s market share declined steadily after Q1 2017, falling below 10% by Q2 2018 and continuing to decline thereafter.
- AOC, included in the TPV category, initially held significant shares but experienced a decline in subsequent years, mirroring the TPV pattern.
- The “Others” category has shrunk over time, reflecting market consolidation, with its share decreasing dramatically between Q1 2012 and Q2 2022.
TV Panel Shipments
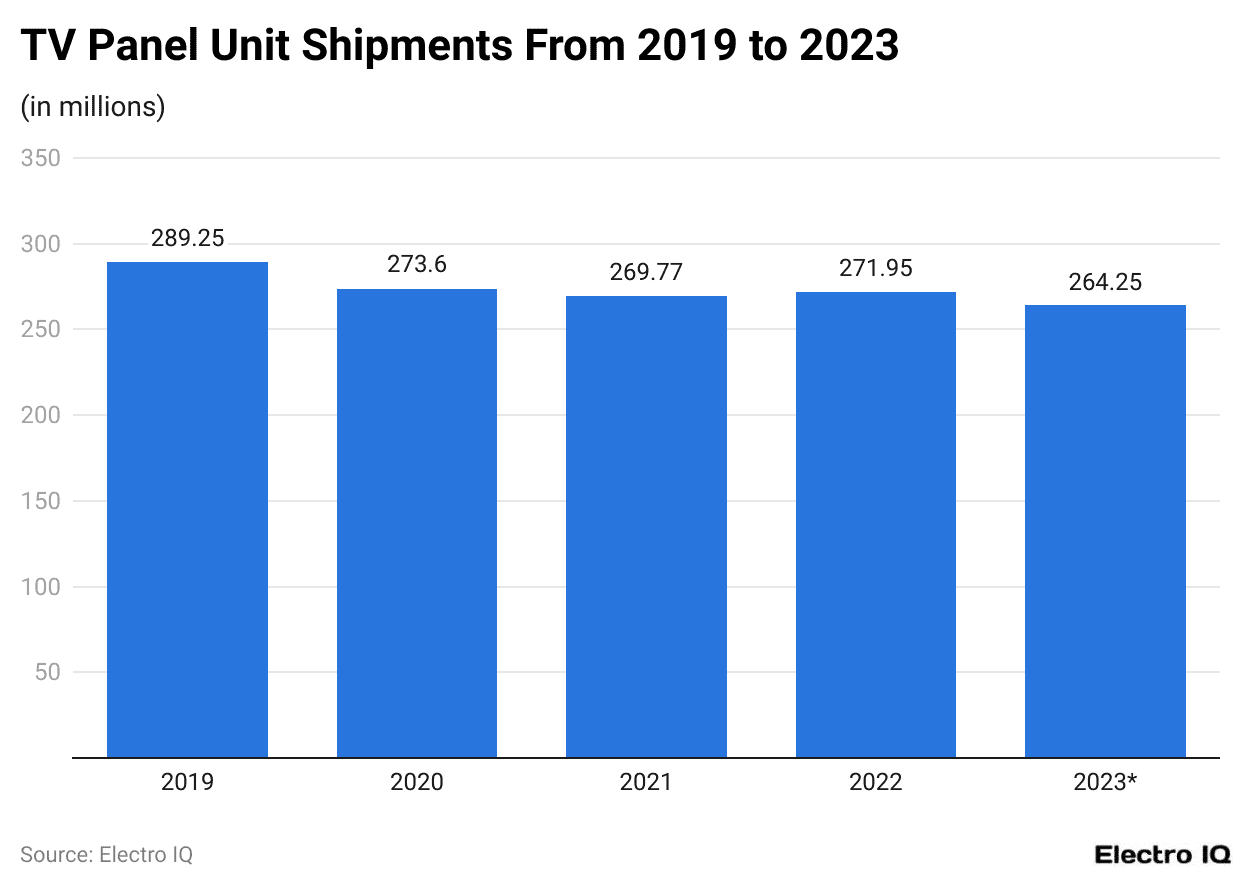
(Reference: Statista.com)
- Based on display technology statistics, the TV panel shipment has been steady.
- During 2019 – 2023, TV panel shipments peaked at 289.25 million units in 2019.
- As of 2023, the TV panel unit shipment is 264.25 million units.
Mobile Resolution Utilization Worldwide
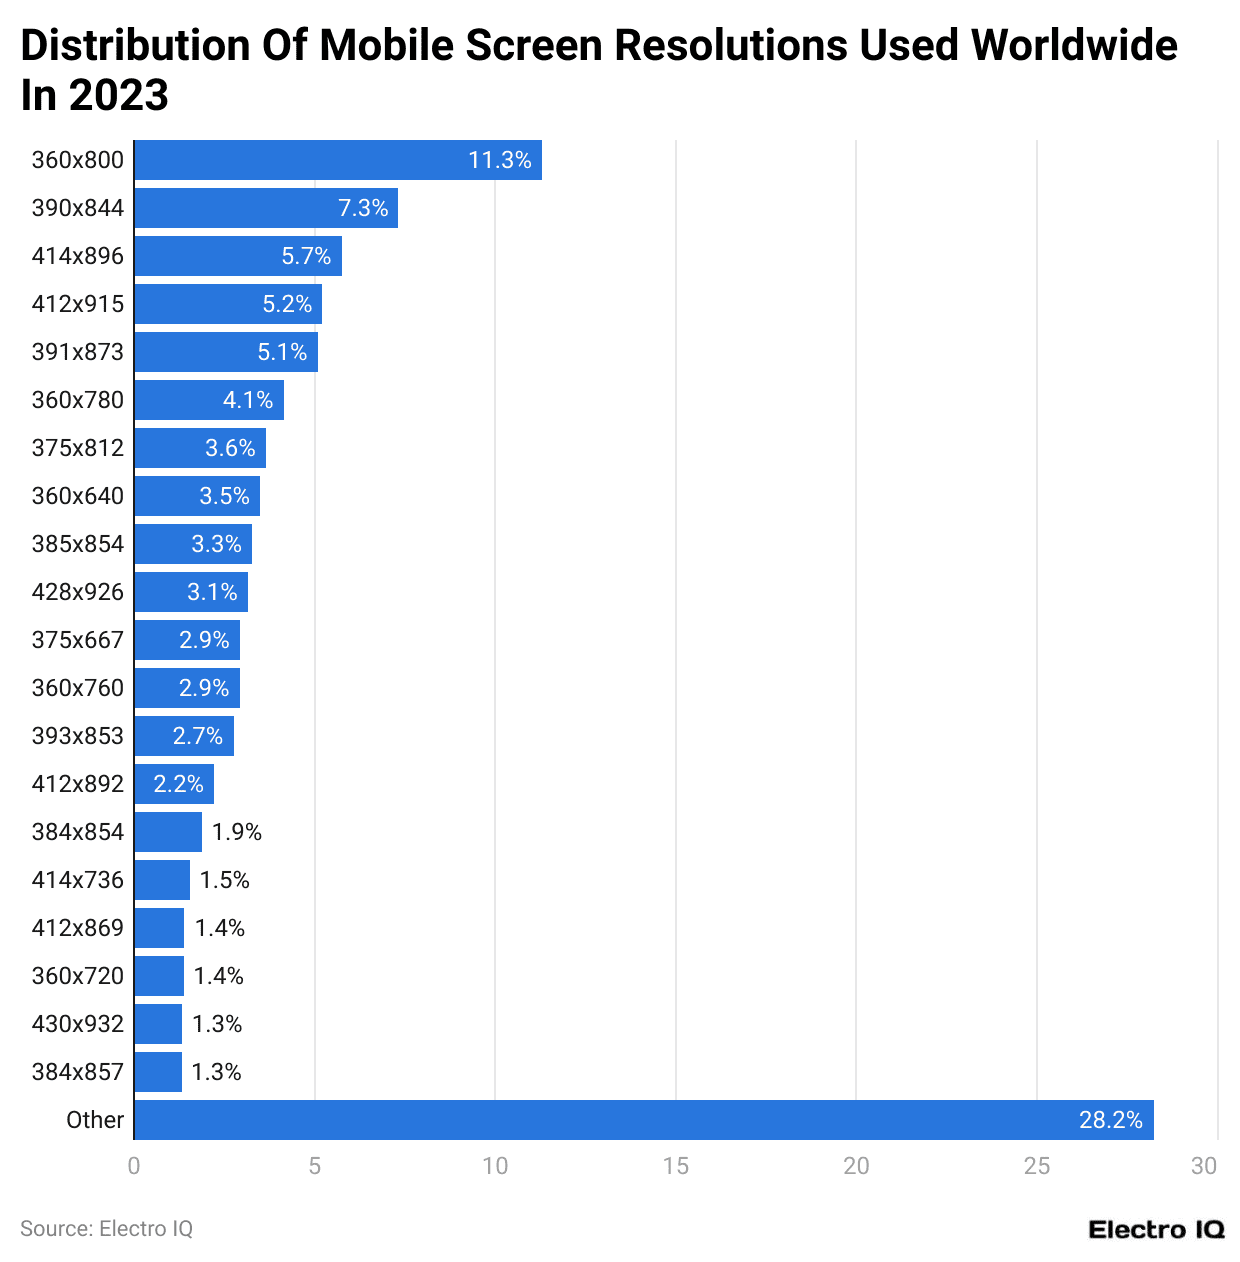
(Reference: Statista.com)
Going through Display Technology Statistics, here are critical observations based on mobile resolution information
Highest Screen Resolutions
- With the largest market share, 850×800 is the screen resolution that is most frequently utilized.
- The second most popular resolution is 890×844.
- There are other noteworthy resolutions: 414×896, 412×915, and 893×873.
Mid-Range Appeal
- Notable shares are also found for resolutions like 860×780, 875×812, 860×540, and 885×854.
- Mid-range resolutions like 428×926, 875×667, and 860×760 are relatively common.
Resolutions Used Less Often
- Resolutions such as 412×892, 884×854, 414×786, and 412×869 are less popular.
- Among the least popular resolutions are 860×720, 480×982, and 854×857.
- Alternative Resolutions: A significant chunk of the market share is accounted for by several alternative resolutions that are categorized as “Other.”
Distribution of Market Share
- The figure shows that many resolutions are used in the highly fragmented mobile screen resolution industry.
- Though many other resolutions comprise a considerable proportion of the market, the most popular resolutions still represent a sizable chunk of the share.
- The diversity of screen resolutions used in mobile devices globally is rather extensive, reflecting the wide range of devices and screen sizes available on the market, even though specific resolutions are more popular than others.
Console Screen Resolution Worldwide
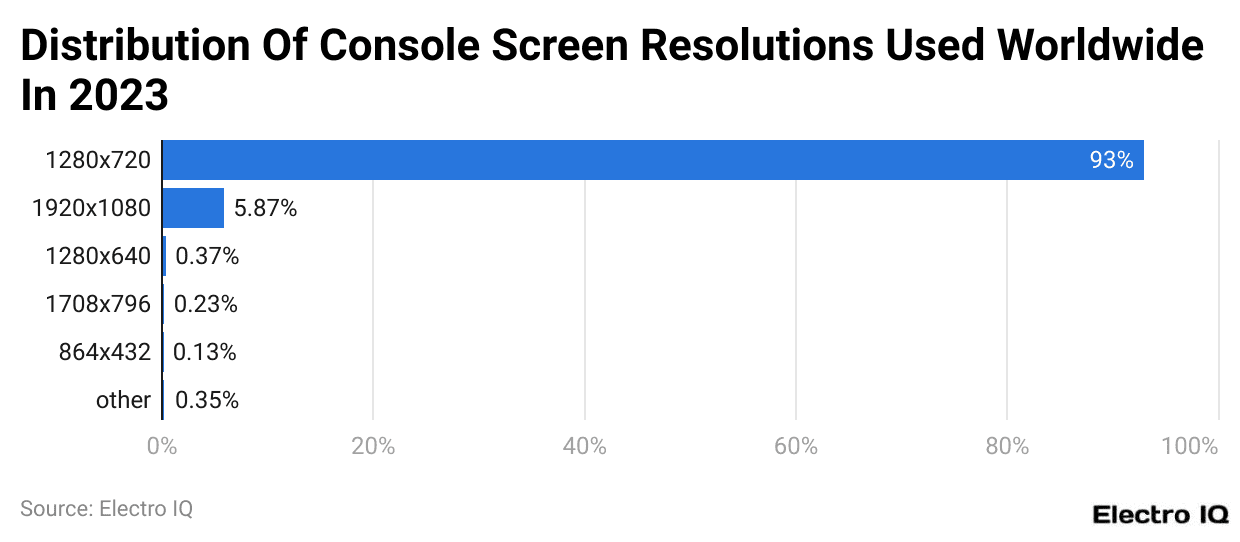
(Reference: Statista.com)
- As of 2023, the resolution 1280×720, sometimes known as 720p, was the most widely used screen size for game consoles, accounting for almost 93% of the market.
- The resolution 1920×1080, also known as 1080p, accounted for over six % of the remaining market, with shares for all other sizes being less than one %.
- Take note of the Display technology statistics. It is expected that the console screen resolution to be 1280 * 720.
Display Technology Overview
The display technology market has seen significant advancements and growth in recent years. The industry continues to evolve rapidly with innovations from traditional LCD screens to cutting-edge OLED and micro-LED displays.
This comprehensive analysis will provide detailed and recent numerical data about display technology statistics for 2023 and 2024, written in simple English from a market researcher’s point of view. Throughout this report, we will mention “US dollars” and “%” signs whenever required and organically incorporate the keyword “display technology statistics” five times.
The global display technology market is projected to grow substantially over the next two years. In 2023, the market was valued at approximately US$130 billion. This represents a significant increase from the previous year, driven by the rising demand for high-resolution displays in smartphones, televisions, and other electronic devices.
The market is expected to reach US$145 billion by 2024, indicating a compound annual growth rate (CAGR) of about 5.6%. This growth can be attributed to several factors, including technological advancements, increased consumer spending, and the expansion of the digital signage industry.
By Key Segments
LCD Displays
- 2023: In 2023, LCDs continued to dominate the market, accounting for nearly 50% of the total market share. The revenue generated from LCDs was approximately $65 billion US dollars.
- 2024: By 2024, the market share of LCDs is expected to decline slightly to 48%, with a revenue projection of $69.6 billion US dollars. This shift is due to the increasing adoption of more advanced display technologies like OLED and micro-LED.
OLED Displays
- 2023: OLED displays have gained significant traction, particularly in the premium segment of smartphones and televisions. In 2023, the OLED segment generated around $45 billion US dollars, representing 34.6% of the total market.
- 2024: The OLED market is projected to grow to US$53 billion by 2024, capturing a market share of 36.6%. The superior color quality and energy efficiency of OLED technology drive this growth.
Micro-LED Displays
- 2023: Micro-LED technology is still emerging but shows immense potential due to its superior brightness and longevity. In 2023, micro-LED displays accounted for approximately $10 billion US dollars in revenue, representing 7.7% of the market.
- 2024: The micro-LED market is expected to experience significant growth, reaching $14 billion US dollars by 2024 and capturing a 9.6% market share. Adopting micro-LED in large-scale displays and high-end applications is a significant growth driver.
Other Technologies (e.g., Quantum Dot, E-Paper)
- 2023: Other display technologies, including quantum dot and e-paper, generated around US$10 billion in 2023, representing 7.7% of the market.
- 2024: These technologies are expected to grow to US$12.4 billion by 2024, maintaining a steady market share of 8.5%. These technologies’ diverse applications and ongoing innovations contribute to their sustained growth.
Display Technology Regional Analysis
- The Asia-Pacific region is the largest market for display technologies, valued at USD 50 billion in 2023, with a market share of 38.5%. By 2024, it is projected to grow to USD 57 billion, capturing a market share of 39.3%. This growth is driven by significant display manufacturers and rising demand for consumer electronics.
- North America remains a significant market, with a value of USD 35 billion in 2023 and a market share of 26.9%. By 2024, the market is expected to grow to USD 38 billion, maintaining a market share of 26.2%. Steady growth is supported by high adoption rates of advanced technologies and significant R&D investments.
- Europe accounted for USD 28 billion in 2023, representing 21.5% of the market. By 2024, the market is expected to reach USD 31 billion, with a slight decrease in market share to 21.4%. The demand for high-quality displays in automotive and healthcare applications is driving this growth.
- The Rest of the World, including Latin America and the Middle East & Africa, generated USD 17 billion in 2023, representing 13.1% of the market. By 2024, the market is projected to grow to USD 19 billion, maintaining a market share of 13.1%. Growth is attributed to the increasing penetration of digital displays in advertising and education.
By Technological Advancements
- In 2024, the flexible display market is expected to grow to USD 7 billion, driven by innovations in foldable and rollable screens.
- The flexible display segment generated around USD 5 billion in revenue in 2023, mainly in the smartphone industry.
- High-resolution displays, such as 4K and 8K, are projected to generate USD 24 billion in 2024 due to increasing consumer demand for enhanced viewing experiences.
- In 2023, high-resolution displays accounted for USD 20 billion in revenue, reflecting strong demand.
- The AR and VR display market is expected to reach USD 6 billion in 2024, fueled by adoption in gaming, healthcare, and training applications.
- In 2023, the AR and VR display market was valued at USD 4 billion, supported by the growing popularity of immersive technologies.
By Competitive Landscape
- Samsung Display led the market in 2023 with revenue of USD 30 billion, representing a 23.1% market share. In 2024, its revenue is projected to reach USD 32 billion, maintaining a 22.1% market share.
- LG Display generated USD 25 billion in revenue in 2023, capturing 19.2% of the market. For 2024, its revenue is expected to increase to USD 27 billion, holding an 18.6% market share.
- BOE Technology achieved USD 20 billion in revenue in 2023, with a 15.4% market share. In 2024, its revenue is forecasted to grow to USD 23 billion, representing 15.9% of the market.
- Sony Corporation earned USD 15 billion in revenue in 2023, holding an 11.5% market share. By 2024, its revenue is anticipated to rise to USD 17 billion, maintaining an 11.7% market share.
- AU Optronics generated USD 10 billion in revenue in 2023, representing a 7.7% market share. Its revenue is projected to grow to USD 11 billion in 2024, capturing a 7.6% market share.
Conclusion
The display technology market is poised for significant growth in 2023 and 2024, driven by technological advancements, increasing consumer demand, and expanding applications. With a market value projected to reach US$145 billion by 2024, the industry offers immense opportunities for innovation and expansion. Key players in the market must navigate challenges such as high production costs and intense competition while capitalizing on emerging trends like micro-LED technology and flexible displays.
This comprehensive analysis provides a detailed overview of display technology statistics, highlighting the key segments, regional markets, technological advancements, and future trends. By staying ahead of the curve and focusing on innovation, companies can position themselves for success in the rapidly evolving display technology market.