Inflation Statistics By Regions, Analysis and Facts (2025)
Updated · Sep 22, 2025

Table of Contents
- Introduction
- Editor’s Choice
- Types of Inflation Statistics
- Global Inflation Rate Statistics
- Inflation Rate Statistics in G2O
- In Europe (2025/09/11)
- In America (2025/09/11)
- In Asia (2025/09/11)
- In Africa (2025/09/11)
- In Australia (2025/09/11)
- Global Inflation Rates by Region
- United States Inflation Statistics
- By Monthly Analysis
- Inflation Statistics by U.S. Urban Consumer CPI Changes
- Indian Inflation Statistics
- By Future Analysis
- CPIH Annual Inflation Rate for All Items
- Conclusion
Introduction
Inflation Statistics: Inflation means that the overall prices of goods and services in an economy keep rising over time. As a result, the money people have cannot buy as much as before, which slowly reduces the real value of the currency.
When inflation is moderate, it can reflect healthy economic activity, but when it climbs too high, it creates challenges such as higher living costs and reduced savings value. Tracking inflation is important for shaping financial policies and understanding its impact on everyday life.
Editor’s Choice
- Global inflation is projected at 4.29% in 2025 (Statista analysis).
- Argentina recorded an extremely high inflation rate of 33.6% as of September 11, 2025 (TradingEconomics).
- Africa saw inflation of 13.8% in 2025, while Sub-Saharan Africa rose slightly higher to 14.4%.
- The United States reported a 2.7% inflation rate for the 12 months ending July 2025 (Labor Department).
- In January 2025, U.S. consumer prices increased 3% compared to January 2024.
- By July 2025, the U.S. Consumer Price Index (CPI) rose by 0.2% on a seasonally adjusted basis.
- In the United Kingdom, the CPIH annual rate reached 4.2% in July 2025, slightly higher than 4.1% in June.
Types of Inflation Statistics
- Creeping inflation means a slow and small increase in prices, usually below 3% a year, and is often seen as normal.
- Walking inflation shows prices rising between 3% and 10% yearly.
- Galloping inflation brings very fast price jumps in double or triple digits.
- Hyperinflation takes place during an enormous price rise, resulting in a 50% increase in one month.
Global Inflation Rate Statistics
 (Reference: statista.com)
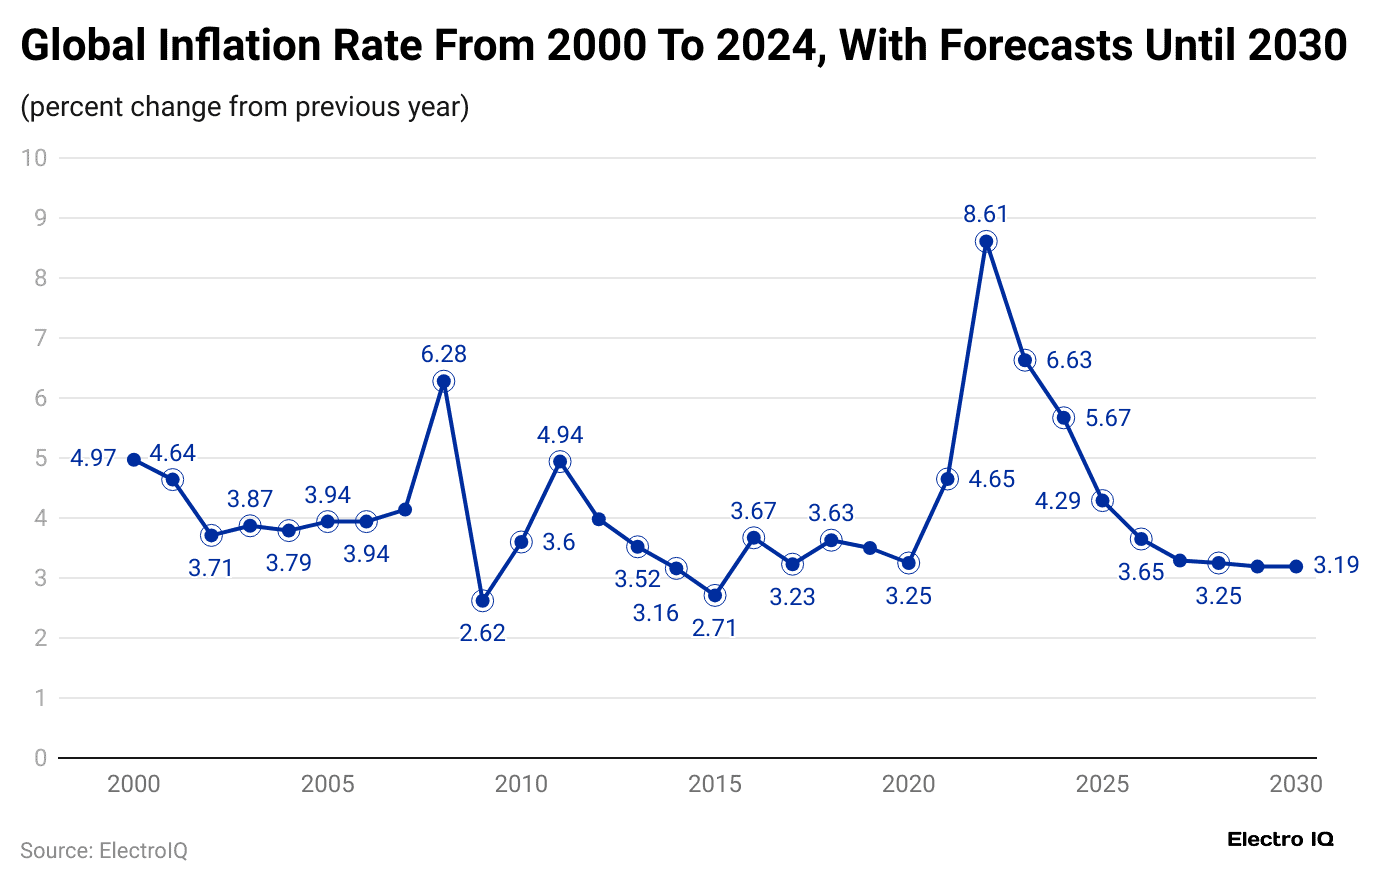
- In 2022, the global inflation remained at its highest with a rate of 8.61%.
- Then the rate started to decrease, resulting in 6.63% in 2023 and 5.67% in 2024.
- By the end of 2025, it is expected to decline to 4.29%, followed by 3.65% in 2026, 3.29% in 2027, 3.19% in 2028, and stabilize around by 3.19% in each 2029 and 2030.
Inflation Rate Statistics in G2O
- On September 11, 2025, Argentina accounted for a 33.6% inflation rate.
- Meanwhile, Australia recorded 2.1%, and Brazil showed 5.13%.
Furthermore, other countries’ inflation rates in the same period are stated in the table below:
| Country | Inflation Rate |
| Canada |
1.7% |
|
China |
-0.4% |
| Euro Area |
2.1% |
|
France |
0.9% |
| Germany |
2.2% |
|
India |
1.55% |
| Indonesia |
2.31% |
|
Italy |
1.6% |
| Japan |
3.1% |
|
Mexico |
3.57% |
| Netherlands |
2.8% |
|
Russia |
8.1% |
| Saudi Arabia |
2.1% |
|
Singapore |
0.6% |
| South Africa |
3.5% |
|
South Korea |
1.7% |
| Spain |
2.7% |
|
Switzerland |
0.2% |
| Turkey |
32.95% |
|
United Kingdom |
3.8% |
| United States |
2.7% |
In Europe (2025/09/11)
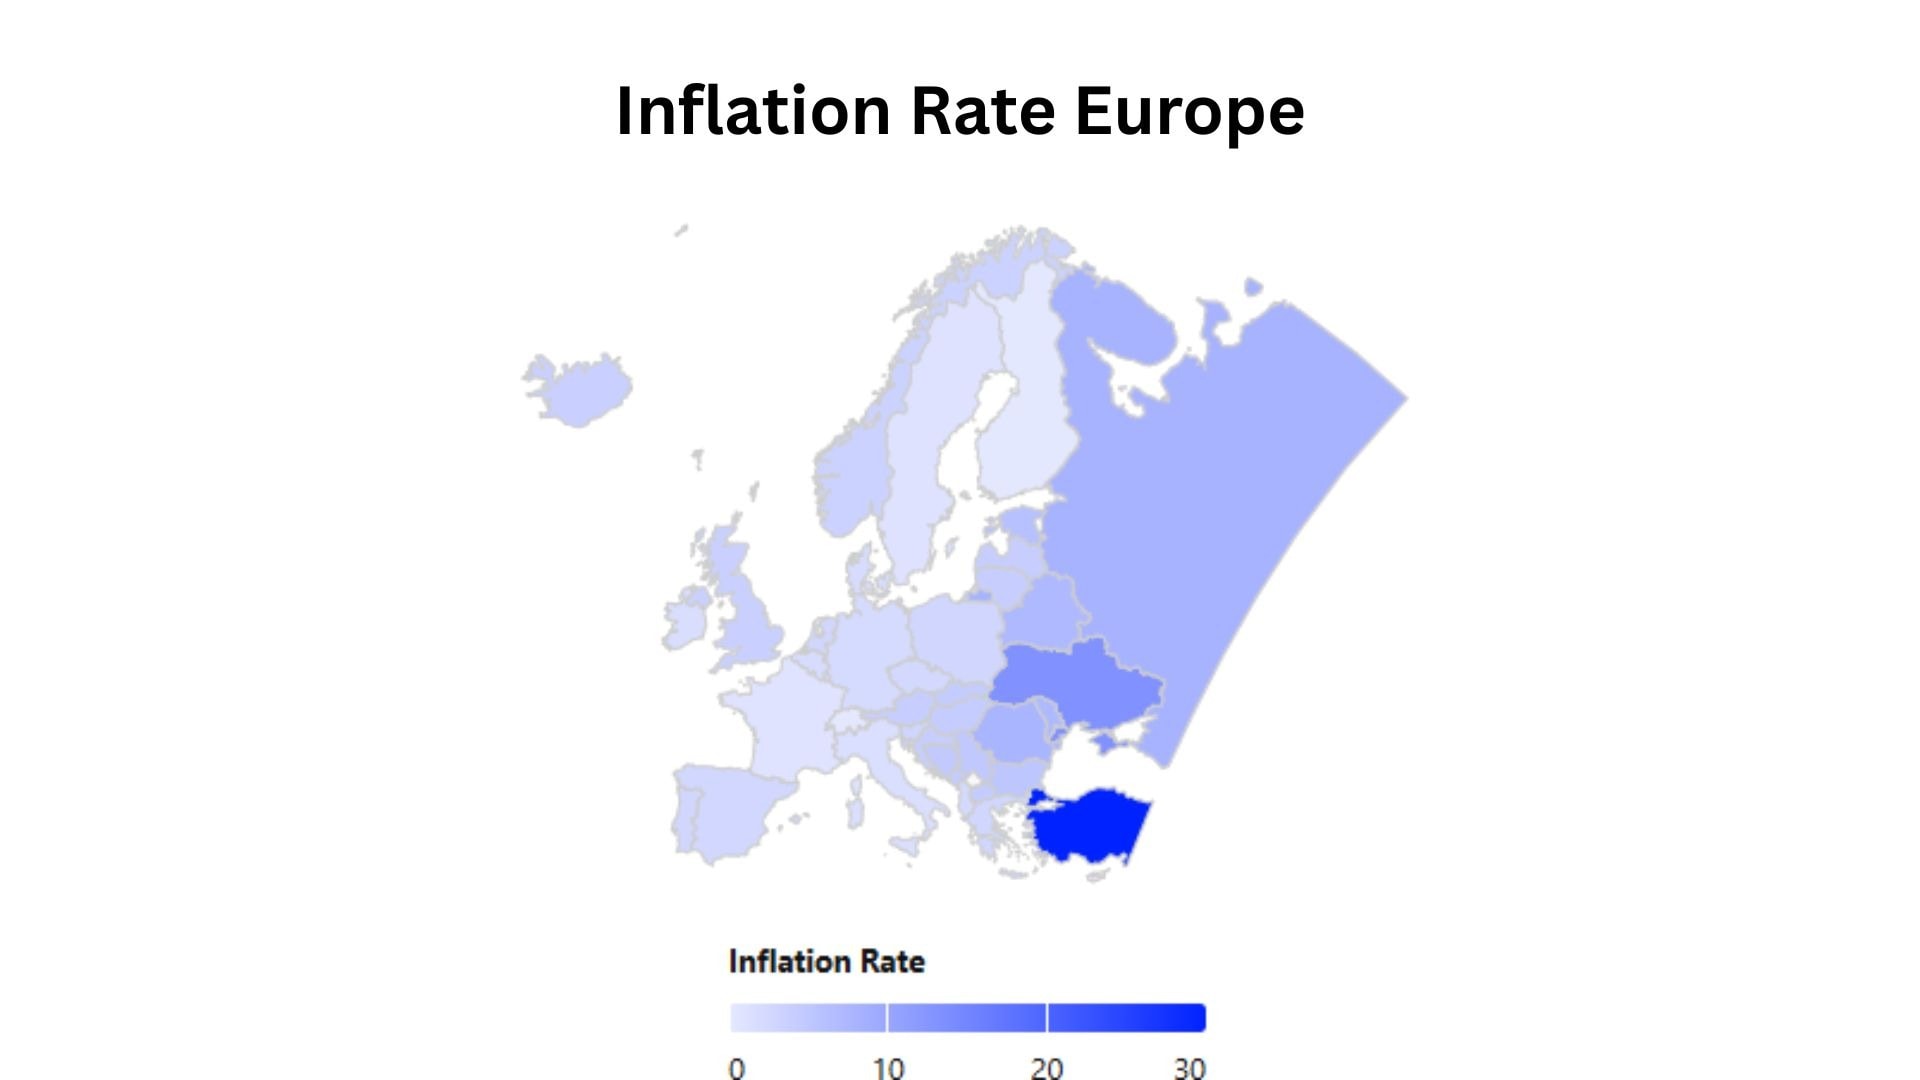 (Source: tradingeconomics.com)
| Country | Inflation Rate |
| Albania | 2.3% |
| Austria | 4.1% |
| Belarus | 7.2% |
| Belgium | 1.91% |
| Bosnia & Herzegovina | 4.8% |
| Bulgaria | 5.3% |
| Croatia | 4.1% |
| Cyprus | -0.9% |
| Czech Republic | 2.5% |
| Denmark | 2% |
| Estonia | 6.1% |
| Euro Area | 2.1% |
| European Union | 2.4% |
| Faroe Islands | 0.7% |
| Finland | 0.2% |
| France | 0.9% |
| Germany | 2.2% |
| Greece | 2.9% |
| Hungary | 4.3% |
| Iceland | 3.8% |
| Ireland | 1.7% |
| Italy | 1.6% |
| Kosovo | 4.3% |
| Latvia | 4.1% |
| Liechtenstein | 0.2% |
| Lithuania | 4% |
| Luxembourg | 2.4% |
| Macedonia | 4.4% |
| Malta | 2.5% |
| Moldova | 7.3% |
| Montenegro | 4.5% |
| Netherlands | 2.8% |
| Norway | 3.5% |
| Poland | 2.8% |
| Portugal | 2.8% |
| Romania | 7.84% |
| Russia | 8.1% |
| Serbia | 4.9% |
| Slovakia | 4.4% |
| Slovenia | 3% |
| Spain | 2.7% |
| Sweden | 1.1% |
| Switzerland | 0.2% |
| Turkey | 32.95% |
| Ukraine | 13.2% |
| United Kingdom | 3.8% |
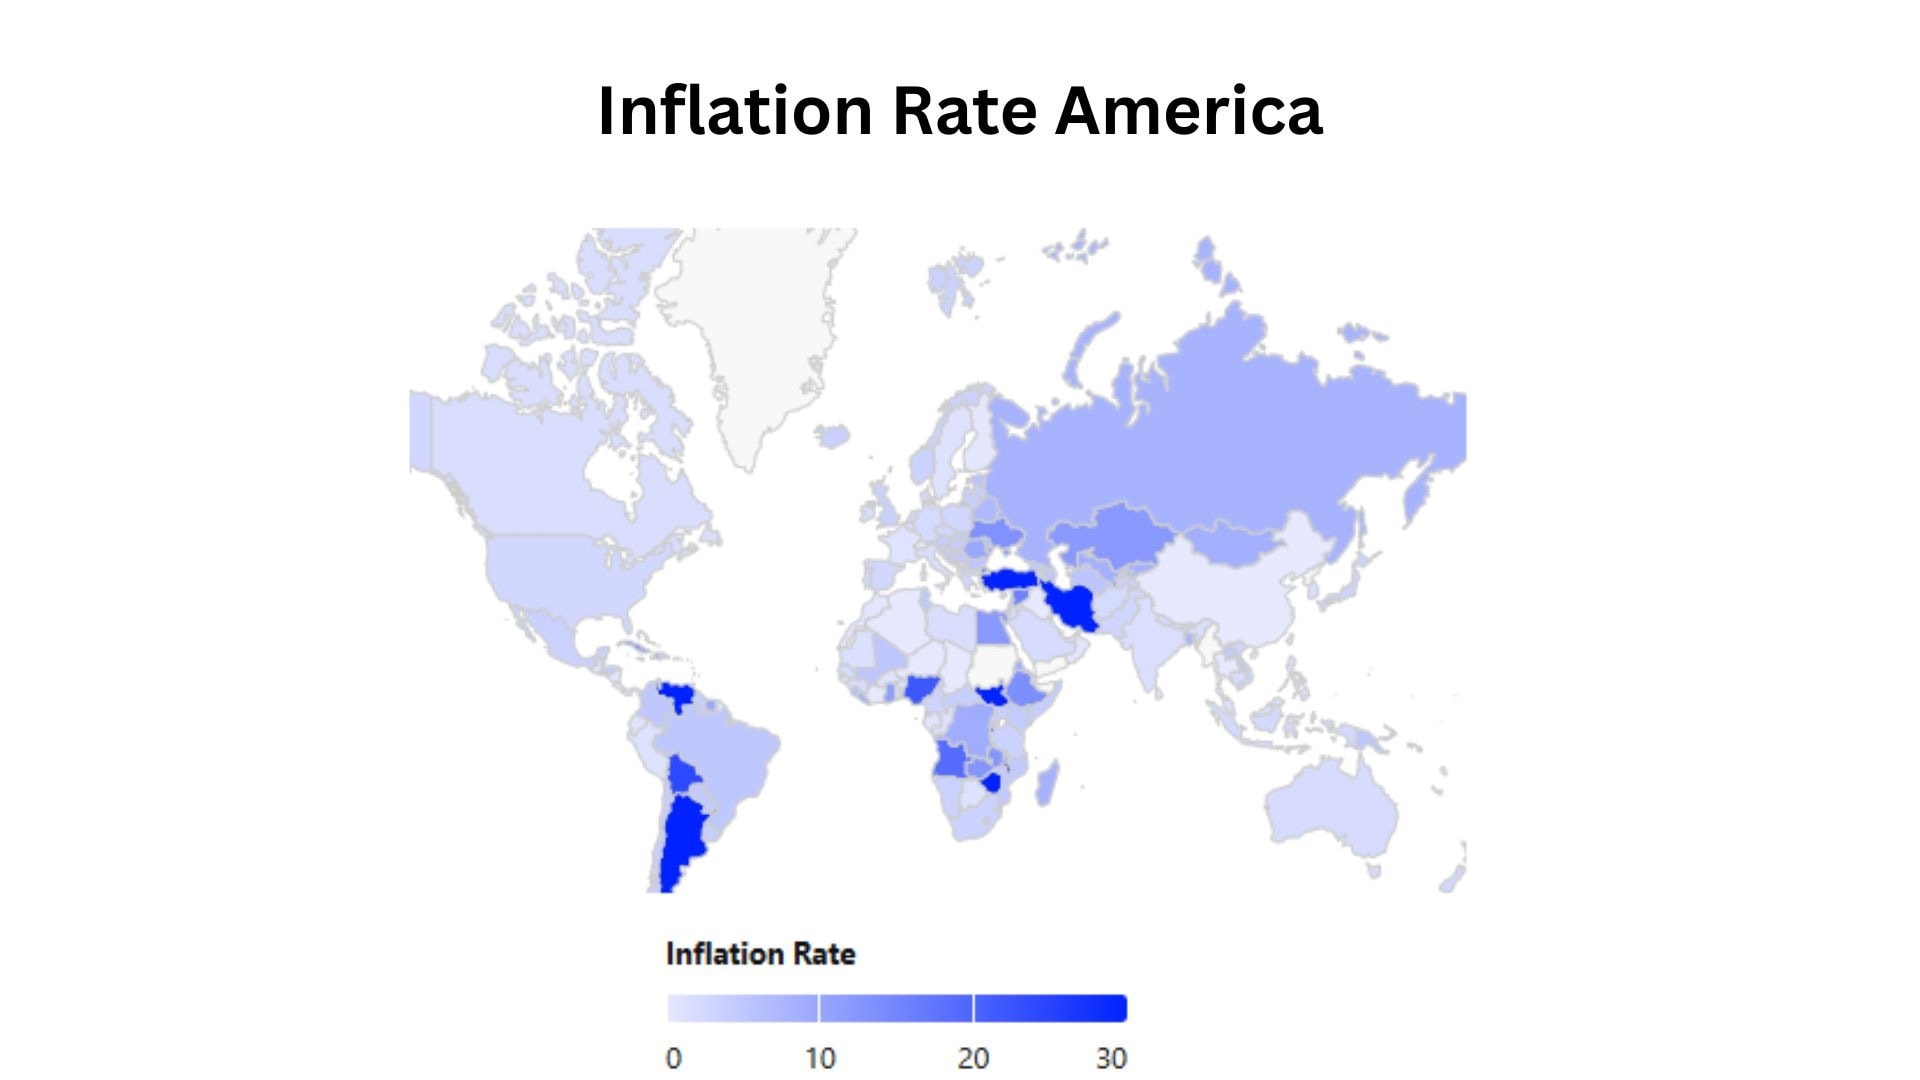
In America (2025/09/11)
| Country | Inflation Rate |
| Argentina | 33.6% |
| Aruba | -0.1% |
| Bahamas | 0.3% |
| Barbados | 0.4% |
| Belize | 1.2% |
| Bermuda | 1.8% |
| Bolivia | 24.15% |
| Brazil | 5.13% |
| Canada | 1.7% |
| Cayman Islands | 1.8% |
| Chile | 4% |
| Colombia | 5.1% |
| Costa Rica | -0.94% |
| Cuba | 14.37% |
| Dominican Republic | 3.71% |
| Ecuador | 0.81% |
| El Salvador | -0.11% |
| Guatemala | 1.17% |
| Guyana | 4.1% |
| Haiti | 29.6% |
| Honduras | 4.16% |
| Jamaica | 3.3% |
| Mexico | 3.57% |
| Nicaragua | 0.64% |
| Panama | -0.36% |
| Paraguay | 4.6% |
| Peru | 1.11% |
| Puerto Rico | 1% |
| Suriname | 10% |
| Trinidad & Tobago | 1.5% |
| United States | 2.7% |
| Uruguay | 4.2% |
| Venezuela | 172% |
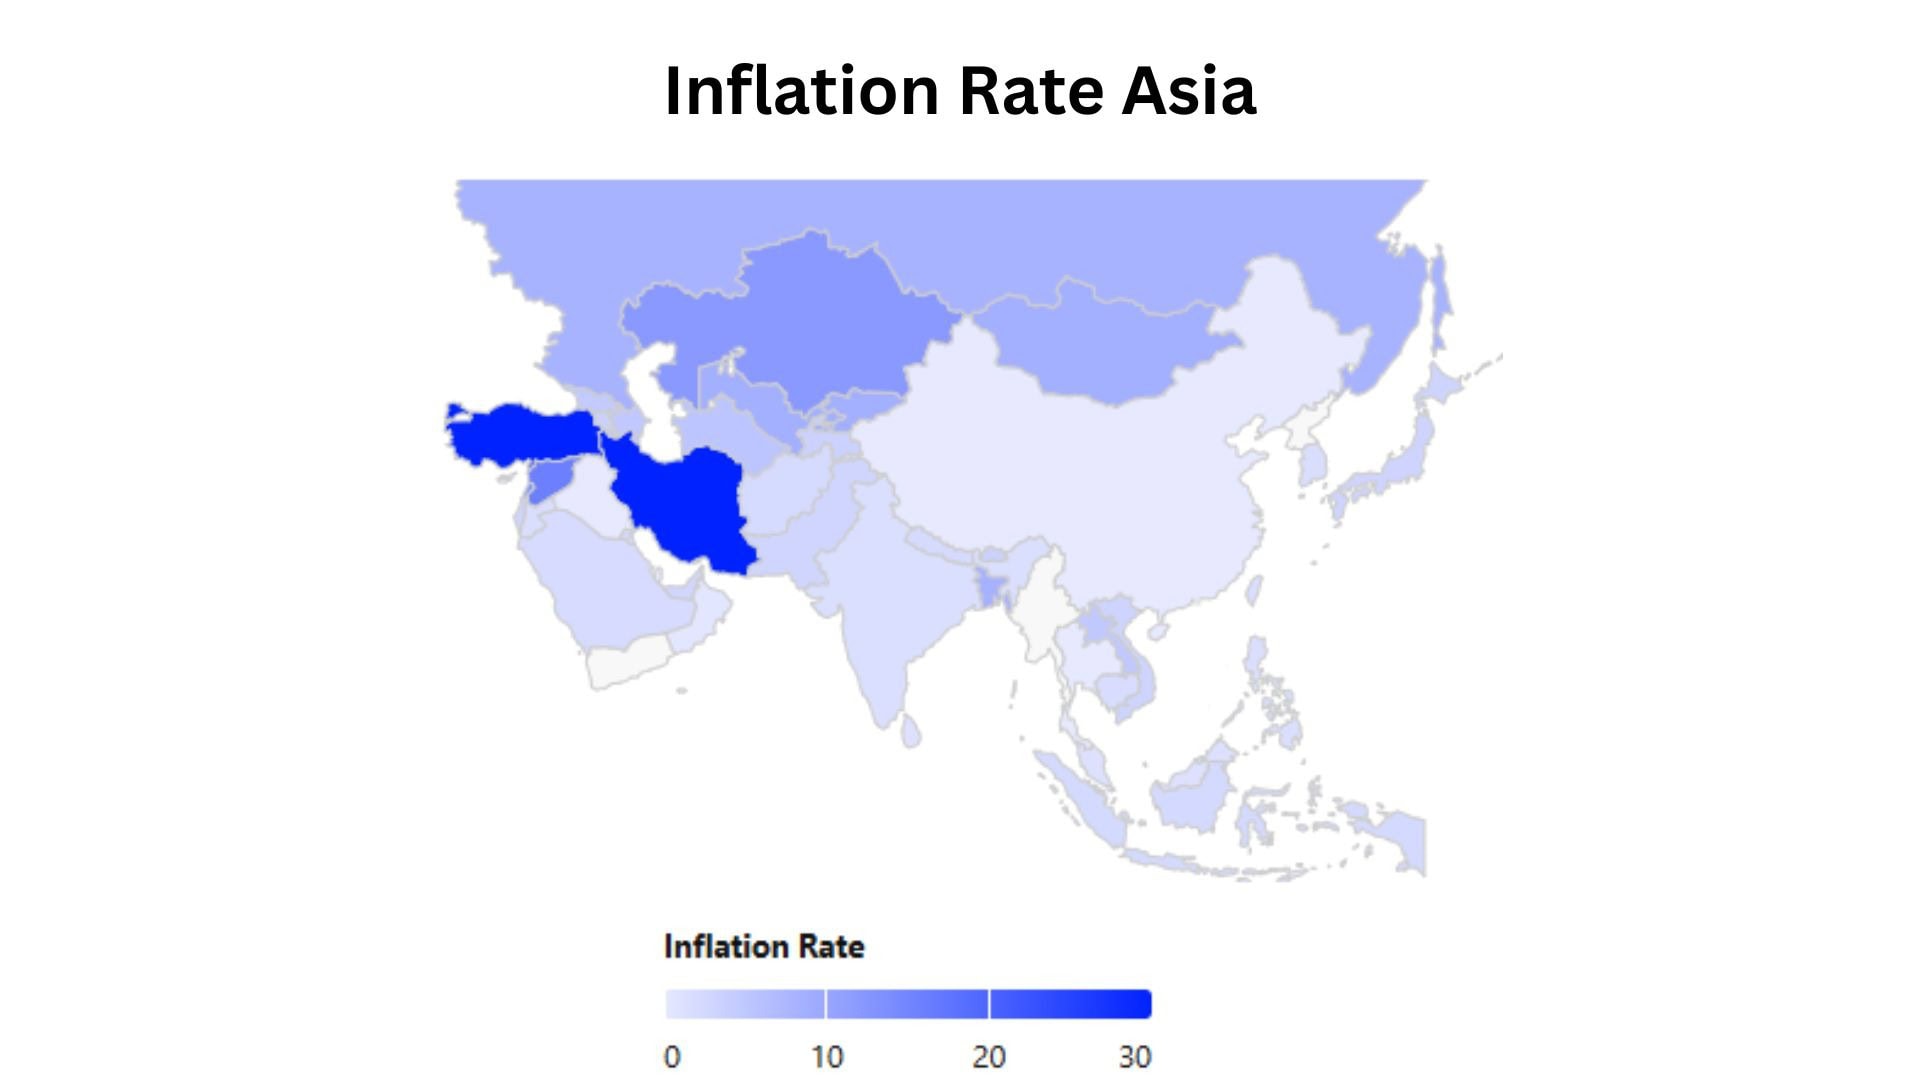
In Asia (2025/09/11)
 (Source: tradingeconomics.com)
| Country | Inflation Rate |
| Afghanistan | 2.2% |
| Armenia | 3.6% |
| Azerbaijan | 5% |
| Bahrain | -0.9% |
| Bangladesh | 8.29% |
| Bhutan | 3.65% |
| Brunei | -0.2% |
| Cambodia | 1.79% |
| China | -0.4% |
| East Timor | 0.3% |
| Georgia | 4.6% |
| Hong Kong | 1% |
| India | 1.55% |
| Indonesia | 2.31% |
| Iran | 38.7% |
| Iraq | -0.6% |
| Israel | 3.1% |
| Japan | 3.1% |
| Jordan | 1.68% |
| Kazakhstan | 12% |
| Kuwait | 2.39% |
| Kyrgyzstan | 8.8% |
| Laos | 5% |
| Lebanon | 14.3% |
| Macau | 0.12% |
| Malaysia | 1.2% |
| Maldives | 4% |
| Mongolia | 8.8% |
| Nepal | 2.2% |
| Oman | 0.5% |
| Pakistan | 3% |
| Palestine | 59.35% |
| Philippines | 1.5% |
| Qatar | -0.08% |
| Saudi Arabia | 2.1% |
| Singapore | 0.6% |
| South Korea | 1.7% |
| Sri Lanka | 1.2% |
| Syria | 15.87% |
| Taiwan | 1.6% |
| Tajikistan | 3.5% |
| Thailand | -0.79% |
| Turkmenistan | 5.5% |
| United Arab Emirates | 2.88% |
| Uzbekistan | 8.8% |
| Vietnam | 3.24% |
In Africa (2025/09/11)
 (Source: tradingeconomics.com)
| Country | Inflation Rate |
| Algeria | -0.26% |
| Angola | 18.88% |
| Benin | 1% |
| Botswana | 1.1% |
| Burkina Faso | 1.1% |
| Burundi | 38.9% |
| Cameroon | 3.3% |
| Cape Verde | 2.7% |
| Central African Republic | 4.1% |
| Chad | -4.7% |
| Comoros | 4.4% |
| Congo | 9.27% |
| Djibouti | -0.6% |
| Egypt | 12% |
| Equatorial Guinea | 4% |
| Eritrea | 9% |
| Ethiopia | 13.7% |
| Gabon | 0.7% |
| Gambia | 7.16% |
| Ghana | 11.5% |
| Guinea | 2.2% |
| Guinea Bissau | -1.9% |
| Ivory Coast | -0.8% |
| Kenya | 4.5% |
| Lesotho | 4.3% |
| Liberia | 9.9% |
| Libya | 1.7% |
| Madagascar | 8.4% |
| Malawi | 27.3% |
| Mali | 5.3% |
| Mauritania | 1.4% |
| Mauritius | 4.8% |
| Morocco | 0.5% |
| Mozambique | 4.79% |
| Namibia | 3.5% |
| Niger | -9.1% |
| Nigeria | 21.88% |
| Republic of the Congo | 1.1% |
| Rwanda | 6.4% |
| São Tomé and Príncipe | 11.1% |
| Senegal | 2.2% |
| Seychelles | 0.55% |
| Sierra Leone | 6.45% |
| Somalia | 4.4% |
| South Africa | 3.5% |
| South Sudan | 113% |
| Swaziland | 2.9% |
| Tanzania | 3.4% |
| Togo | -1.1% |
| Tunisia | 5.2% |
| Uganda | 3.8% |
| Zambia | 12.6% |
| Zimbabwe | 93.8% |
In Australia (2025/09/11)

| Country | Inflation Rate |
| Australia | 2.1% |
| Fiji | -2.1% |
| New Caledonia | 0.8% |
| New Zealand | 2.7% |
| Papua New Guinea | 5.28% |
| Solomon Islands | 3.7% |
| Vanuatu | 0.1% |
Global Inflation Rates by Region
 (Source: imf.org)
- In 2025, consumer prices showed Africa experienced a high inflation rate of 13.8%, while Sub-Saharan Africa reached 14.4%.
- Central Asia and the Caucasus recorded the highest inflation at 24.9%, followed by North Africa at 12.8% and the Middle East at 10.9%, while Eastern Europe faced 7.1% and the Caribbean 6.3%.
- South Asia registered 4.7%, the Western Hemisphere 4.2%, the Pacific Islands 4.9%, North America 3%, Europe 3.7%, Asia and the Pacific 3.1%, Australia and New Zealand 2.5%, Southeast Asia 2.5%, and East Asia only 0.5%.
United States Inflation Statistics
 (Source: usinflationcalculator.com)
- For the 12 months ending July 2025, the U.S. inflation rate stayed at 2.7%, reports the Labour Department.
- Decreased from 2.9% in 2024, previous years’ inflation rates are followed as 2023 (3.4%), 2022 (6.5%), 2021 (7%), 2020 (1.4%), 2019 (2.3%), 2018 (1.9%), 2017 (2.1%), 2016 (2.1%), and 2015 (0.7%).
By Monthly Analysis
 (Reference: statista.com)
- In January 2025, U.S. consumer prices rose 3% from January 2024, based on the 12-month consumer price index change, according to Statista report analysis.
- Followed by February (2.8%), March (2.4%), April (2.3%), May (2.4%), June (2.7%), and July (2.7%), as mentioned in usinflationcalculator.com.
- Moreover, in 2024 monthly inflation rates in the U.S. were followed as January (3.1%), February (3.2%), March (3.5%), April (3.4%), May (3.3%), June (3%), July (2.9%), August (2.5%), September (2.4%), October (2.6%), November (2.7%), and December (2.9%).
Inflation Statistics by U.S. Urban Consumer CPI Changes
 (Source: bls.gov)
- As of July 2025, seasonally adjusted changes in the Consumer Price Index (CPI) increased by 0.2%.
- Within food, prices for food at home slightly declined by 0.1%, whereas food away from home increased by 0.3%.
- Energy experienced a decrease of 1.1%, driven by gasoline (-2.2%) and fuel oil (1.8%), while energy services (-0.3%), electricity (-0.1%), and utility gas service (- 0.9%).
- The CPI for all other items (excluding food and energy) increased by 0.3%.
- In July 2025, the CPI increased 2.7%, with food rising 2.9%, energy decreasing by 1.6% and core items increasing by 3.1%.
- Followed by apparel and used cars and trucks (+0.5%), medical commodities (+0.1%), energy (+0.4%), shelter (+0.2%), transportation (+0.2%), and overall medical care (+0.8%).
Indian Inflation Statistics
 (Source: statista.com)
- According to the Statista report analysis, India’s GDP is expected to grow 7% from FY 2024 to 2025.
- However, urban inflation remained high, averaging 5.1% in the fiscal year ending March 2024.
- Core inflation, excluding food and fuel, stood at 4.2%, decreased from 5.4% to 5.9% during the COVID-19 pandemic.
- Fuel and energy costs were the main contributors, despite India increasing Russian oil and gas imports by 111% between 2022 and 2023 due to global sanctions.
- Urban housing price growth slowed from 6.7% in 2018 to 2019 to 3.3% by March 2021.
- This trend is expected to reverse, with housing experts predicting prices to rise 7.8% this year, up from last year’s 4.3%.
By Future Analysis
 (Reference: statista.com)
- The above statistic shows that the Indian inflation rate will account for 4.24% by 2025.
- In the coming years, the predicted inflation rates are followed by 2026 (4.09%), 2027 (4%), 2028 (4%), 2029 (4%), and 2030 (4%).
CPIH Annual Inflation Rate for All Items
 (Source: ons.gov.uk)
- As of July 2025, the CPIH annual rate is valued at 4.2%, an increase from last month, which resulted in 4.1%.
- In the same year, other CPIH rates were 3.9% in January, 3.7% in February, 3.4% in March, 4.1% in April, and 4% in May.
In 2024, other monthly analyses are mentioned in the table below:
| Months | CPIH Annual Rate |
| January | 4.2% |
| February | 3.8% |
| March | 3.8% |
| April | 3% |
| May | 2.8% |
| June | 2.8% |
| July | 3.1% |
| August | 3.1% |
| September | 2.6% |
| October | 3.2% |
| November | 3.5% |
| December | 3.5% |
Conclusion
Inflation is slowly becoming more stable after going through several ups and downs in recent years. Prices had reached very high levels, but forecasts show they are likely to fall and move closer to normal by the end of the decade. This steady fall points to better economic balance, though differences between regions and sudden global events could still affect the recovery.
Sources
FAQ.
The five main reasons for inflation are demand-pull, cost-push, excessive money supply, currency depreciation, and policies.
Inflation can be reduced by controlling the money supply, raising interest rates, cutting deficits, and boosting production.
Everyday costs rise, the value of money falls, savings and investments suffer, and the economy grows unstable.

Maitrayee Dey has a background in Electrical Engineering and has worked in various technical roles before transitioning to writing. Specializing in technology and Artificial Intelligence, she has served as an Academic Research Analyst and Freelance Writer, particularly focusing on education and healthcare in Australia. Maitrayee's lifelong passions for writing and painting led her to pursue a full-time writing career. She is also the creator of a cooking YouTube channel, where she shares her culinary adventures. At Smartphone Thoughts, Maitrayee brings her expertise in technology to provide in-depth smartphone reviews and app-related statistics, making complex topics easy to understand for all readers.