Money Laundering Statistics By Country, Types And Facts (2025)
Updated · Jul 02, 2025


Table of Contents
- Introduction
- Editor’s Choice
- Types of Money Laundering
- Median Financial Loss From Money Laundering Cases Statistics
- Money Laundering Statistics By Country
- Top Origins of Laundered Money Statistics
- Global Scale of Financial Crime Statistics
- The Highest-Risk Money Laundering Risk Statistics By Country
- The Lowest-Risk Money Laundering Risk Statistics By Country
- Anti-Money Laundering Software Market Statistics
- Number of Money Laundering Offenders Or Cases Statistics
- Types of Anti-Laundering Shares Statistics
- United States Money Laundering Offences Statistics
- Top 10 Worst-Offending Countries For AML Events Statistics
- Money Laundering Situation Statistics In Regions
- Greatest Concerns Statistics By Financial Crime Threats
- NFTs And Financial Crime Statistics
- Money Laundering Events Statistics
- Biggest Money Laundering Cases In 2024
- Conclusion
Introduction
Money Laundering Statistics: Money laundering is the process of concealing the origins of illegally obtained money. These are from illegal activities, such as drug cases, human trafficking, sex work, terrorism, corruption, etc, to generate money. Laundering activities present several challenges for financial institutions, governments, and law enforcement agencies.
The global nature of the economy, the increasing sophistication of financial transactions, and the involvement of anti-money laundering (AML) initiatives all contribute to making the fight against money laundering a complex and ongoing issue, with severe consequences for the integrity of financial systems and economies.
This article includes several statistical analysis from different current sources that explores the methods, implications, and legal frameworks designed to combat money laundering on a global scale.

(Source: unodc.org)
Editor’s Choice
- According to the Global Financial Crime Report, approximately USD 3.1 trillion in illegal money passed through the global financial system in 2023.
- The countries with the highest prevalence of money laundering worldwide are the United States, China, Russia, and Mexico.

(Source: vpnranks.com)
- VPNRanks shows that the median loss for money laundering offences is expected to reach USD 350,000 by the end of 2025.
- As of now, more than USD 800 billion to USD 2 trillion is laundered globally each year.
- According to reports from KYC Hub, in the USA, approximately USD 300 billion in money is laundered in 2025, representing 15% to 38% of global money laundering activity.
- By 2025, the average loss from money laundering crimes is expected to reach approximately USD 400,000.
- The global market for Anti-Money Laundering software is expected to reach approximately USD 2.56 billion.
- It’s expected that around 600 cases of money laundering will be reported annually.
- Market.us Scoop further elaborates that in 2024, the United States was the top origin of laundered money, accounting for USD 13,20,228 million annually, which represented 46.3% of the total share.
Types of Money Laundering
- Traditional (Classic) Money Laundering
- Smurfing (Structuring)
- Trade-Based Money Laundering
- Shell Companies and Trusts
- Real Estate Laundering
- Casino and Gambling Laundering
- Digital / Cryptocurrency Laundering
- Bank Laundering (via Financial Institutions)
- Black Market Peso Exchange (BMPE)
- Money Mule Networks
Median Financial Loss From Money Laundering Cases Statistics

(Source: vpnranks.com)
- VPNRanks predicts that by 2025, the average loss from money laundering crimes will reach around USD 400,000.
- Meanwhile, in 2020, the median loss was USD 320,000, and in 2019, it was USD 200,000.
| Year | Median Loss (USD) |
| 2018 | 180,000 |
| 2017 | 185,000 |
| 2016 | 200,000 |
Money Laundering Statistics By Country
- According to reports from KYC Hub, in the USA, approximately USD 300 billion in money is laundered in 2025, representing 15% to 38% of global money laundering activity.
- The United States tops the list of countries with the highest rates of Anti-Money Laundering (AML) events, with more than 11,472 events, resulting in nearly 3.5 events per 100,000 people.
- In the United Kingdom, money laundering activities have increased, with 27.5% of all AML events, resulting in 1,664 AML events (nearly 2.5 events per 100,000 people).
- In Australia, the majority of AML events are linked to drug trafficking, which makes up almost 40.9% of the total.
- Canada has also witnessed an increase in money laundering activities, with failures in AML compliance accounting for 23.9% of all AML events.
Top Origins of Laundered Money Statistics
- Market.us Scoop further elaborates that in 2024, the United States was the top origin of laundered money, accounting for USD 13,20,228 million annually, which represented 46.3% of the total share.
In contrast, other origins are stated below, 2024:
| Country | Laundered Money (USD million) |
Laundered Share |
| Italy | 1,50,054 | 5.3% |
| Russia | 1,47,187 | 5.2% |
| China | 1,31,360 | 4.6% |
| Germany | 1,28,266 | 4.5% |
| France | 1,24,748 | 4.4% |
| Romania | 1,15,585 | 4.1% |
| Canada | 82,374 | 2.9% |
| UK | 68,740 | 2.4% |
| Hong Kong | 62,856 | 2.2% |
| Spain | 56,287 | 2.0% |
| Thailand | 32,834 | 1.2% |
| South Korea | 21,240 | 0.7% |
| Mexico | 21,119 | 0.7% |
| Austria | 20,231 | 0.7% |
| Poland | 19,714 | 0.7% |
| Philippines | 18,867 | 0.7% |
| Netherlands | 18,362 | 0.6% |
| Japan | 16,975 | 0.6% |
| Brazi | 16,786 | 0.6% |
Global Scale of Financial Crime Statistics
- According to the Global Financial Crime Report, approximately USD 3.1 trillion in illicit funds passed through the global financial system in 2023.
- Money laundering is responsible for a million dollars in funding, which includes an estimated USD 346.7 billion linked to human trafficking.
- Others are followed by USD 782.9 billion tied to drug trafficking, USD 11.5 billion used for financing terrorism, and USD 485.6 billion for fraud scams and bank fraud schemes.
The Highest-Risk Money Laundering Risk Statistics By Country
| Country | Overall Score |
| Haiti | 8.25 |
| Chad | 8.14 |
| Myanmar | 8.13 |
| The Democratic Republic Of The Congo | 8.10 |
| Republic Of Congo | 7.91 |
| Mozambique | 7.88 |
| Gabon | 7.73 |
| Guinea-Bissau | 7.69 |
| Venezuela | 7.63 |
| Laos | 7.44 |
The Lowest-Risk Money Laundering Risk Statistics By Country
| Country | Overall Score |
| Iceland | 2.87 |
| Finland | 2.96 |
| Estonia | 3.00 |
| Andorra | 3.09 |
| Sweden | 3.20 |
| Denmark | 3.36 |
| New Zealand | 3.38 |
| Norway | 3.45 |
| Lithuania | 3.47 |
| San Marino | 3.51 |
Anti-Money Laundering Software Market Statistics

(Source: vpnranks.com)
- The above graph reports that by the end of 2025, the global market for Anti-Money Laundering software is expected to reach around USD 2.56 billion.
- Meanwhile, the market size in 2024 was USD 2.28 billion, and in 2023, it was USD 2.04 billion.
- From 2023 to 2025, the market is expected to experience an annual growth rate of 12.6% in terms of compound annual growth rate (CAGR).
Number of Money Laundering Offenders Or Cases Statistics

(Source: vpnranks.com)
- The above graph indicates that, by 2025, it’s expected that around 600 cases of money laundering will be reported annually.
| Year | Number of Offenders |
| 2020 | 755 |
| 2019 | 990 |
| 2018 | 1,138 |
| 2017 | 1,086 |
| 2016 | 1,084 |
(Source: smartsearch.com)
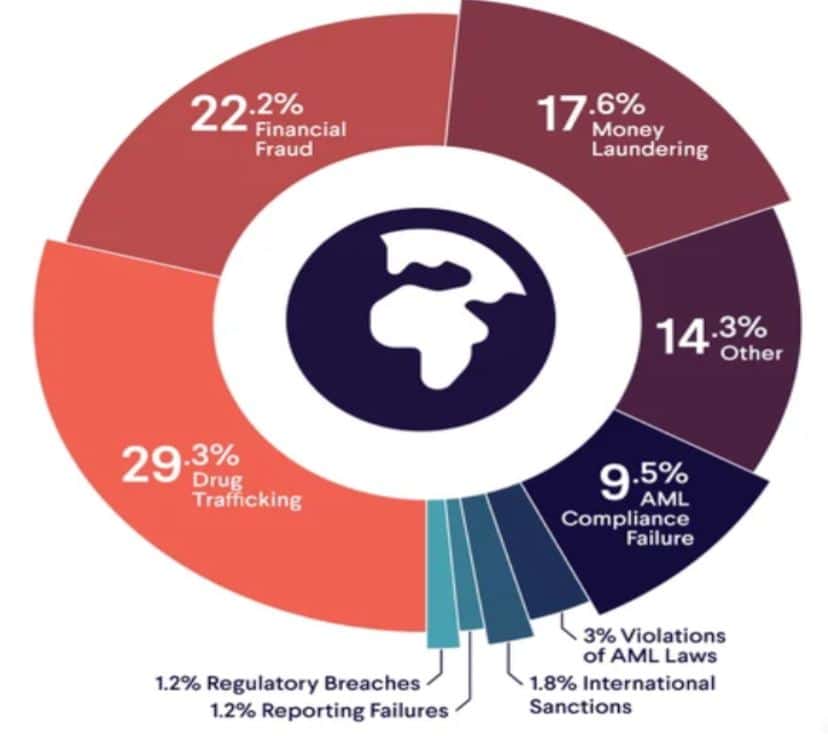
- According to Smart Search Statistics of 2024, globally, drug trafficking is the most common type of Anti-Money Laundering (AML) event, accounting for a share of 29.3%.
- Furthermore, others are followed by financial fraud (22.2%), money laundering (17.6%), AML compliance failure (9.5%), violations of AML laws (3%), international sanctions (1.8%), reporting failures (1.2%), and regulatory breaches (1.2%).
United States Money Laundering Offences Statistics

(Reference: ussc.gov)
- As of 2023, around 64,124 cases were reported, and 1,132 cases involved Money Laundering.
- 76.8% of men were sentenced for money laundering.
- In which 37.1% were Hispanic, 28.9% were White, 26.3% were Black, and 7.7% were from other races.
- The average age of those involved was 42 years, of which 70.9% were U.S. citizens, and 69.7% had little or no prior criminal history (Category I).
- The median financial loss in these cases was USD 566,530.
- 15.8% of cases involved losses of USD 6,500 or less, while 26.3% had losses exceeding USD 1.5 million.
Top 10 Worst-Offending Countries For AML Events Statistics
| Country | Drug Trafficking | Financial Fraud | Money Laundering | AML Complaint Failure | Violations of AML Laws | International Sanctions | Regulatory Breaches | Reporting Failures | Others |
| United States | 35% | 25.90% | 15.70% | 1.40% | 1.50% | 2.40% | 0.70% | 0.90% | 15.80% |
| United Kingdom | 19.80% | 13.40% | 27.50% | 23.9% | 1.50% | 0.20% | 0.80% | 2.10% | 10.80% |
| United Arab Emirates | 0.90% | 4.40% | 11.40% | 61.4% | 14.90% | – | 3.50% | – | 3.50% |
| Australia | 40.90% | 7.90% | 22.80% | 11.0 | 3.90% | – | 1.60% | 0.80% | 11.00% |
| Canada | 24.20% | 7.50% | 8.10% | 39.1% | 4.40% | – | 0.60% | 0.60% | 15.50% |
| Israel | – | 21.40% | 17.90% | 41.1% | – | – | – | – | 19.70% |
| South Africa | 0.90% | 32.00% | 31.10% | 11.7% | 8.10% | 0.50% | – | – | 15.80% |
| Sweden | – | 3.50% | 3.50% | 69% | 17.20% | 6.90% | – | – | – |
| Poland | – | – | – | 24.70 | 75.30% | – | – | – | – |
| Austria | – | 7.70% | 30.80% | 23.10% | 23.10% | – | 7.70% | – | 7.70% |
Money Laundering Situation Statistics In Regions
| Regional Focus | Overall risk score | Quality of the AML/CFT framework | Bribery and corruption | Financial transparency and standards | Public transparency and accountability | Legal and political risk |
| European Union and Western Europe | 3.96 | 4.45 | 3.15 | 3.67 | 2.20 | 2.73 |
| Europe and Central Asia | 5.16 | 4.99 | 6.08 | 5.13 | 4.05 | 5.82 |
| East Asia and the Pacific | 5.47 | 5.95 | 4.55 | 5.13 | 4.44 | 3.90 |
| Latin America and the Caribbean | 5.4 | 5.52 | 5.42 | 5.77 | 4.66 | 4.63 |
| The Middle East and North Africa | 5.16 | 4.99 | 6.08 | 5.13 | 4.05 | 5.82 |
| North America | 4.29 | 5.24 | 2.32 | 2.72 | 2.52 | 2.50 |
| South Asia | 5.64 | 5.73 | 5.85 | 5.73 | 4.61 | 5.25 |
| Sub-Saharan Africa | 6.54 | 6.88 | 6.36 | 6.3 | 5.31 | 5.34 |
Greatest Concerns Statistics By Financial Crime Threats
- Nasdaq Verafin 2024 states that the top three greatest concerns of financial crime threats are 52% (real-time/faster payments fraud), 47% (money mule activity), and terrorist financing (33%).
- Furthermore, other greatest concerns include drug trafficing (33%), government benefit fraud (32%), elder abuse/exploitation (27%), consumer scams (24%), internal fraud (22%), human trafficking (19%), and business email compromise (11%).
NFTs And Financial Crime Statistics
- A report published by Elliptic states that in 2017, more than USD 8 million in illicit funds were laundered through NFT platforms, representing approximately 0.02% of trading activity originating from known sources.
- Approximately USD 100 million worth of NFTs were reported stolen through scams, with an average loss of USD 300,000 per scam from July 2021 to July 2022.
- Before being sanctioned by the U.S. Office of Foreign Assets Control (OFAC) in August 2022, Tornado Cash, a crypto mixing service, processed USD 137.6 million worth of cryptoassets used on NFT marketplaces.
- It was also the primary tool for laundering 52% of the proceeds from NFT scams.
Money Laundering Events Statistics

(Reference: scoop.market.us)
- Globally, in 2024, the majority of money laundering cases are linked to drug trafficking, holding a share of 29.30%.
- Financial fraud follows closely, representing incidents with a 22.20% share.
- Direct money laundering activities account for 17.60%, while other miscellaneous activities make up 14.30%.
- Failures in Anti-Money Laundering (AML) compliance are responsible for 9.50%, and AML violation policies accounted for 3% of cases.
- Followed by international sanctions with 1.80%, regulatory breaches (1.2%), and reporting failures (1.2%).
Biggest Money Laundering Cases In 2024
- AP News reports further states that in October 2024, TD Bank agreed to pay over USD 3 billion to settle charges of failing to maintain an effective anti-money laundering (AML) program.
- In January 2024, Mark Scott, a former law firm partner, was sentenced to 10 years in prison for laundering approximately USD 400 million from the OneCoin cryptocurrency fraud scheme, according to reports from the IRS.
- Gibson Dunn claimed that in November 2024, Roman Sterlingov received 12.5 years for running Bitcoin Fog, laundering USD 28 million through obfuscated cryptocurrency transactions over the years.
- In April 2024, Trương Mỹ Lan (a Vietnamese businesswoman) was sentenced to death for laundering USD12.5 billion from Sai Gon Joint Stock Commercial Bank, as per the reports of Wikipedia.
- Operation Destabilise led to 84 arrests and the seizure of £20 million out of an estimated £700 million in drug sales between 2021 and 2024.
Conclusion
After completing the overall analysis, money laundering is recognised as a complex issue that continuously affects global economies, financial institutions, and societies. These money Laundering Statistics show that drug trafficking, financial fraud, and direct laundering activities are the primary drivers of these illegal actions.
To combat such laundering, the government has already begun implementing various anti-money laundering (AML) policies to strengthen regulatory frameworks, enhance compliance practices, and foster international cooperation. All the above analyses will be beneficial in helping you understand the current situation regarding money laundering.
FAQ.
There are several ways to understand the activity of money laundering, including unusual transaction patterns. Suspicious behaviour from clients, complex or unnecessary transactions, high-risk jurisdiction, structuring or smurfing, unusual source of funds, wire transfers to unknown parties, suspicious use of real estate, involvement in high-value goods, and failing to report suspicious activity.
Money laundering involves three main steps: placement, layering, and integration, each aimed at obscuring the origin of illicit funds.
The five pillars of Anti-Money Laundering are Customer Due Diligence (CDD), Compliance Program, Ongoing Monitoring, Reporting Suspicious Activity, and Training and Education.

Joseph D'Souza founded ElectroIQ in 2010 as a personal project to share his insights and experiences with tech gadgets. Over time, it has grown into a well-regarded tech blog, known for its in-depth technology trends, smartphone reviews and app-related statistics.