NFT Statistics By Market, Ownership, Industries And Facts (2025)
Updated · Jul 11, 2025

Table of Contents
- Introduction
- Editor’s Choice
- NFT Market Statistics
- NFT Statistics by Market Capitalization
- By Sales Volume
- By Total Sales
- Top 10 NFT Collections by 24-Hour Volume (July 9, 2025)
- Daily NFT Market Size Statistics
- NFT Ownership Statistics
- Global NFT Adoption Statistics by Gender
- Top 5 Countries NFT Statistics
- NFT Marketplaces Remain a Niche Phenomenon in Crypto
- NFT Buyer Statistics
- NFT Statistics by Industries
- Top NFT Statistics
- Most Valued NFTs Statistics by Selling Price
- NFT Website Traffic Statistics
- Conclusion
Introduction
NFT Statistics: The term “NFT” means “non-fungible token,” which helps show who owns a digital item or asset. The NFT is stored on a blockchain and proves who owns a digital item and that it’s real. It can’t be copied or replaced, and the owner can sell or trade it to others. Anyone can make NFTs, and they don’t need much or any coding knowledge. NFTs usually link to digital items like art, pictures, music, or videos, and they are unique, unlike fungible cryptocurrencies.
This article includes several current statistical analyses that are taken from different insights covering the overall market, sales, user demographics, ownerships, buyers, selling prices, and many other factors. Hopefully, it will guide you effectively in understanding the topic better.
Editor’s Choice
- According to the Statista report of 2025, the expected revenue accounted for by NFTs will be around USD 504.3 million and is estimated to reach USD 479.1 million by 2026.
- The annual growth rate of the market will grow at a CAGR of -5% from 2025 to 2026.
- The average revenue per user of the NFT market in 2025 is expected to be USD 44.5.
- Meanwhile, the United States of America is supposed to generate the highest revenue of USD 87.5 million in the same period.
- As of 2026, the number of users in the NFT market will reach approximately 11.67 million.
- In contrast, the user penetration of NFTs in 2025 will be 0.15% and is predicted to be the same by the end of 2026.
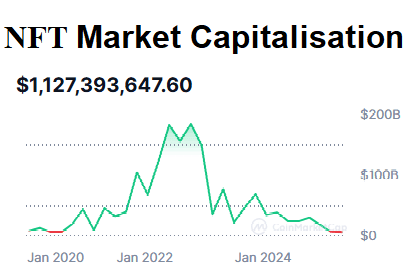
- CoinMarketCap.com reports that as of July 9, 2025, the market cap of NFTs accounted for USD 1,127,393,647.60, increasing by +16.94% in the last 24 hours.
- The sales volume of NFT on July 9, 2025, accounted for USD 61,358.82, and on July 8 it resulted in USD 349,165.15.
- According to binance.com, across 23 major blockchains, 5,428,020 NFT transactions occurred in January 2025, totaling about USD 677.7 million in sales.
- As per the reports of Similarweb, in June 2025, the latest traffic and engagement analysis for nft.com, the site recorded a total of 36,000 visits (-4.5K)
NFT Market Statistics
 (Source: kraken.com)
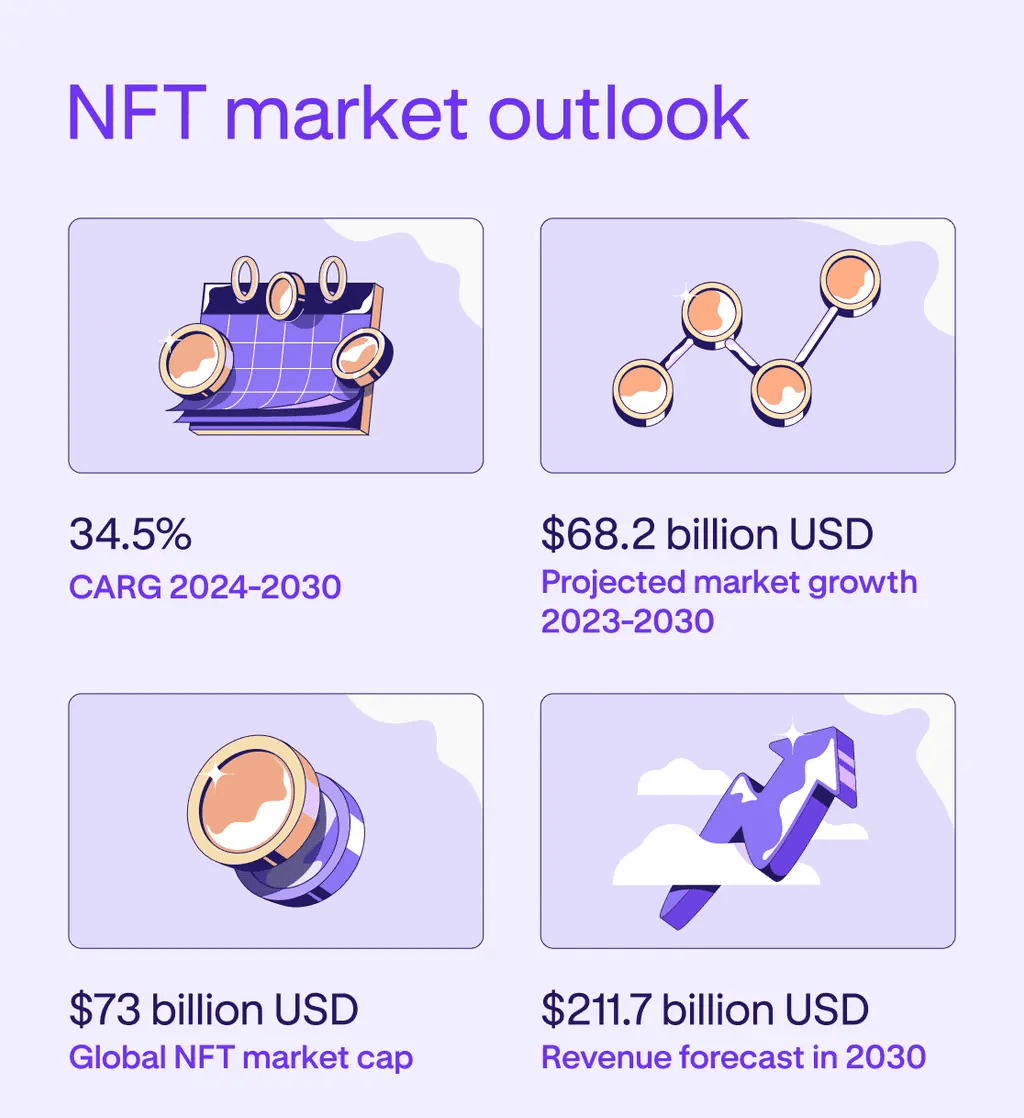
- The NFT market is expected to grow by USD 68.2 billion between 2023 and 2028.
- In 2024, it has already earned around USD 2.4 billion in revenue.
- By the end of 2024, the market value is about USD 35.7 billion, and it is predicted to reach USD 211.7 billion by 2030.
- At the time of writing, the global NFT market cap stands at USD 73 billion.
- Although the market is growing, hacks and scams caused losses of USD 407 million in Q2, which is 32% less than the previous quarter, but 9% higher than the same time in 2023.
NFT Statistics by Market Capitalization
 (Source: coinmarketcap.com)
- As of July 9, 2025, the market cap of NFTs accounted for USD 1,127,393,647.60, increased by +16.94% in the last 24 hours.
- This year, on February 24, the market cap hit USD 5,215,939,251.33 and on May 2, USD 4,699,543,470.88.
By Sales Volume
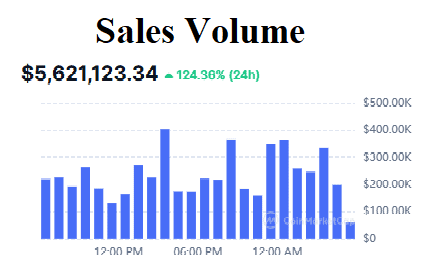
- The sales volume of NFT on July 9, 2025, accounted for USD 61,358.82, and on July 8 it resulted in USD 349,165.15.
- Similarly, as of 2025, the sales volume in Feb 4 (USD 442,140,395.86), followed by May 2 (USD 377,022,949.21).
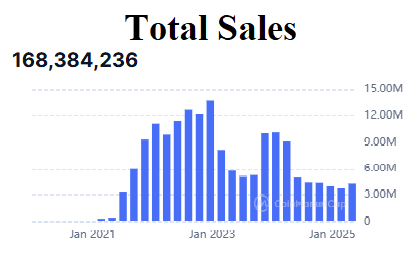
By Total Sales
 (Source: coinmarketcap.com)
| Date | Total Sales |
| July 8, 2025 |
10,191 |
|
May 2, 2025 |
4,371,075 |
| Feb 24, 2025 |
3,837,639 |
|
Dec 20, 2024 |
4,082,035 |
| Oct 14, 2024 |
4,453,385 |
|
Aug 9, 2024 |
4,493,793 |
| Jun 3, 2024 |
5,092,854 |
|
Mar 29, 2024 |
9,192,061 |
| Jan 22, 2024 |
10,204,293 |
Top 10 NFT Collections by 24-Hour Volume (July 9, 2025)
| Name | Chain | Volume | Floor Price | Sales | Average Price | Owners share |
| Froganas | Solana | 2,114.58 SOL (+11.36%) | 0.8399 SOL | 2,084 (+12.7%) | 0.8578 SOL |
35.04% |
|
Pudgy Penguins |
Ethereum | 99.35 ETH (-37.02%) | 9 ETH | 11 (-35.29%) | 9.0317 ETH | 55.75% |
| Doodles | 68.86 ETH | – | 17 | 4.0507 ETH |
70.05% |
|
|
Doodles |
64.01 ETH | 14 | 4.5719 ETH | 86.87% | ||
| Anome OG NFT | Blast | 62.96 ETH (-18.49%) | 2.34 ETH | 30 (-18.91%) | 2.0986 ETH |
14% |
|
Milady Maker |
Ethereum | 62.29 ETH | – | 12 | 5.1912 ETH | 63.78% |
| Bored Ape Yacht Club | 60.87 ETH | 9 | 6.7631 ETH |
59.77% |
||
|
MutantApeYachtClub |
59.25 ETH (+80.75%) | 1.689 ETH | 34 (+78.94%) | 1.7426 ETH | 60.43% | |
| Mutant Ape Yacht Club | 56.46 ETH | 0.4 ETH | 13 | 4.3428 ETH |
93.3% |
|
|
Azuki |
54.71 ETH (+15.45%) | 1.69 ETH | 29 (+7.4%) | 1.8865 ETH |
41.67% |
Daily NFT Market Size Statistics
- According to binance.com, across 23 major blockchains, 5,428,020 NFT transactions occurred in January 2025, totalling about USD 677.7 million in sales.
- Ethereum was responsible for roughly 49.97%, representing USD 338 million in sales.
- Bitcoin came in second, making up 17.15% of total sales, which was around USD 116 million.
- Solana also had strong numbers, with NFT sales reaching about USD 80.72 million.
- Other active blockchains included Mythos with USD 34.92 million, Immutable with USD 32.32 million, and Polygon with USD 24.95 million in NFT sales.
NFT Ownership Statistics
- Cointax.pro states that around 7.2 million people worldwide owned NFTs in 2024, which is just 0.09% of the population, with a 38% growth rate from 2023.
- Asia has the largest number of NFT owners at 2.8 million, with 0.06% of the population.
| Region | NFT owners | Owner share |
| North America | 2.1 million |
0.56% |
|
Europe |
1.8 million | 0.24% |
| Other regions (Africa, South America, Oceania) | 0.5 million |
0.02% |
- As of 2024, people aged 25 to 34 make up 38% of everyone who owns an NFT.
- Meanwhile, NFT ownership demographics by other age groups are 28% (35 to 44 years), 15% (18 to 24 years), 12% (45 to 54 years), and 7% (55+ years).
- Based on gender, male and female NFT owners’ shares are followed by 63% and 35%, respectively, while 2% owners prefer not to reveal their gender.
- About 68% of NFT owners finished college, and 45% of them make more than USD 100,000 every year.
Global NFT Adoption Statistics by Gender
| Country | Men | Women |
| India | 8.4% |
5.1% |
|
Nigeria |
5.6% | 3.0% |
| USA | 3.8% |
1.3% |
|
Canada |
1.9% | 1.1% |
| Philippines | 5.0% |
2.4% |
|
Vietnam |
6.4% | 5.2% |
| Indonesia | 4.9% |
2.9% |
|
Singapore |
5.6% | 3.6% |
| Ghana | 4.7% |
2.8% |
|
Venezuela |
3.2% | 2.2% |
| Ireland | 3.6% |
1.7% |
|
Argentina |
3.1% | 1.4% |
| Australia | 3% |
1.4% |
|
Germany |
1.6% | 0.7% |
| Malaysia | 3.8% |
2.2% |
|
Japan |
1.5% | 1.6% |
| Sweden | 2.4% |
0.8% |
|
Colombia |
2.8% | 2% |
| Norway | 2.5% |
1% |
|
New Zealand |
2.1% | 1.1% |
| South Africa | 2.7% |
1.3% |
|
Hong Kong |
6.1% | 4.7% |
| Brazil | 4.6% |
3.5% |
|
Mexico |
2.3% | 2% |
| Kenya | 4.1% |
2.8% |
|
United Kingdom |
2.2% |
0.9% |
Top 5 Countries NFT Statistics
- Statista’s report further states that the NFT market in the United States of America is expected to generate the highest revenue of USD 87.5 million in 2025.
- The compound annual growth rate will decrease by 8.09% from 2025 to 2026, resulting in USD 80.5 million revenue by the end of 2026.
- As of 2025, the average revenue per user in the U.S. will be USD 41.2, with a user penetration rate of 0.61%.
Furthermore, other countries’ market revenue and user analysis of NFTs are mentioned in the table below:
| Country | Revenue (USD) | CAGR (2025 to 2026) | Average Revenue per User (USD) | NFTs’ User Count | User Penetration Rate | ||
| 2025 | 2026 | 2025 | 2026 | 2025 | 2026 | ||
|
India |
56.2 million | 53.9 million | -3.98% | 42.9 | 1.35M | 0.09% | 0.09% |
| Indonesia | 24.0 million | 22.9 million | -4.82% | 44.3 | 559.04k | 0.19% |
0.19% |
|
Brazil |
17.8 million | 17.1 million | -3.98% | 45.6 | 400.64k | 0.18% | 0.19% |
| Italy | 16.5 million | 15.7 million | -4.85% | 48.0 | 351.66k | 0.58% |
0.60% |
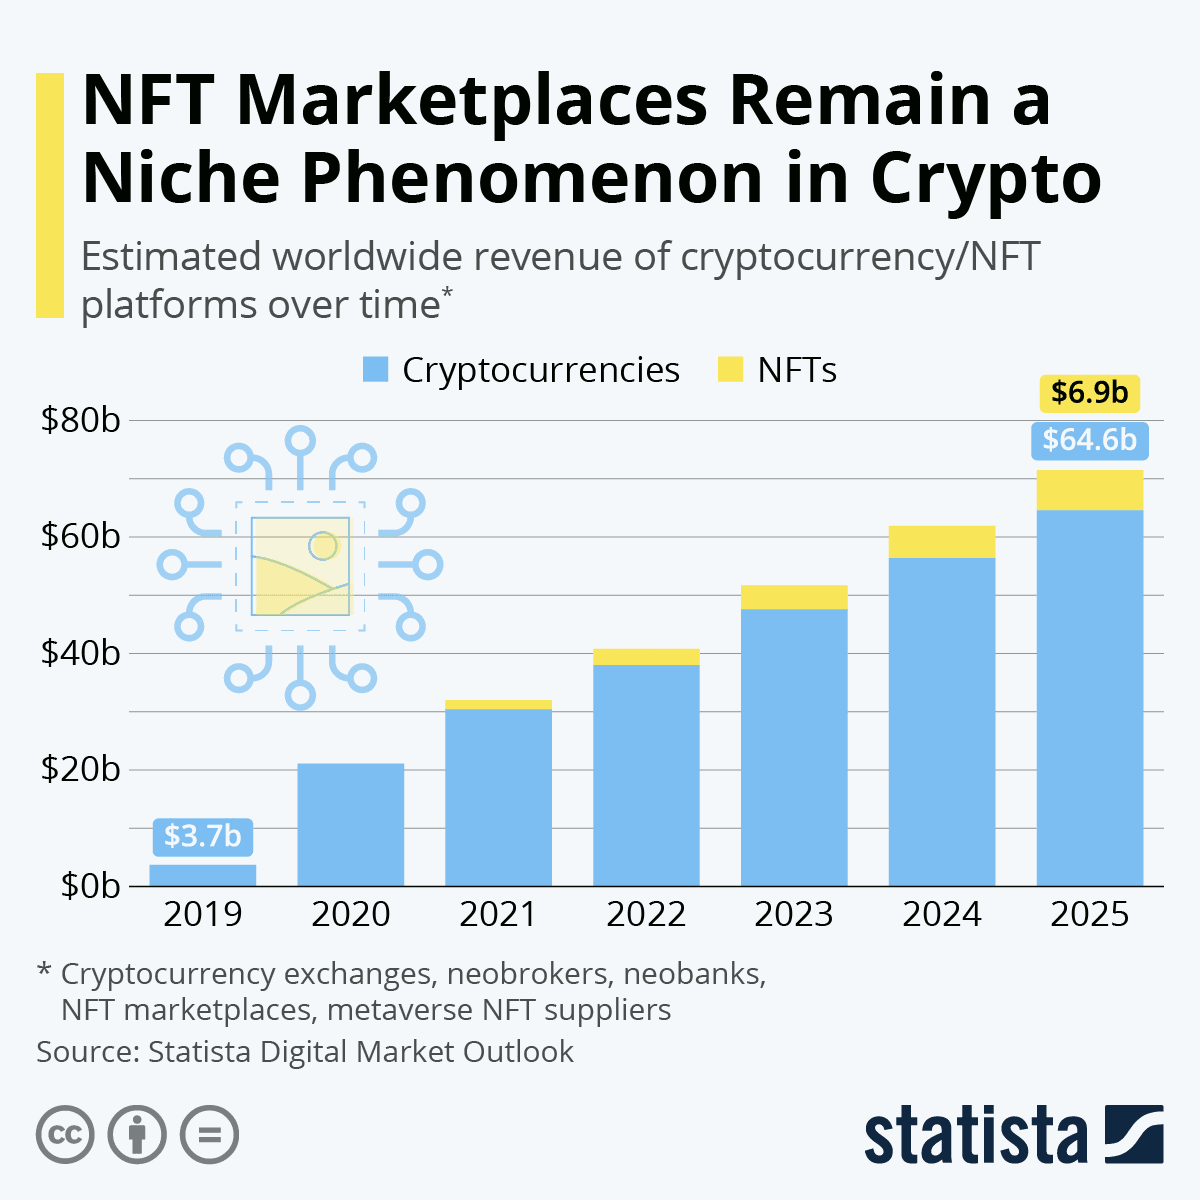
NFT Marketplaces Remain a Niche Phenomenon in Crypto
 (Source: statcdn.com)
- The above graph reports that in 2025, income from cryptocurrency and NFT platforms could reach around USD 71.5 billion, resulting in Cryptocurrencies (USD 64.6 billion) and NFTs (USD 6.9 billion).
- Meanwhile, the market is expected to grow at an average rate of 21% each year until 2025.
- NFT trading revenue is growing 14% faster, but it may reach only USD 6.9 billion by 2025, just 10% of crypto income, with lower user adoption than cryptocurrencies.
NFT Buyer Statistics
- A report published by Coinbound states that the most active in NFT trading are from India, Singapore, Ireland, China, and Venezuela.
- In Vietnam and Ireland, 11% of older people own NFTs, accounting for the highest share in both countries.
- Buyers aged from 35 to 54 years often purchase NFTs as crypto art enthusiasts.
- Around 250,000 people buy and sell NFTs on OpenSea each month.
- By March 2024, more than 1 million users were actively trading on the platform.
- By 2028, the number of users is expected to grow, reaching a 0.20% global penetration rate.
- As mentioned on invezz.com, 32% of people aged between 18 and 24 have bought or shown interest in NFTs.
- Others are followed by 19% for 25 to 34 years, 11% for 35 to 54 years, and only 5% for those 55+ years.
- According to the Kraken report analysis, the United States had 5% of 18 to 34-year-olds own NFTs, compared to just 1% of those over 55 years of age.
- In India, the highest NFT adoption rate was secured by males with a share of 8%.
NFT Statistics by Industries
- According to the Kraken report analysis of Q2 of 2024, Blockchain gaming companies attracted USD 1.1 billion in investments.
- The DappRadar report further states that in Q1 2024, blockchain gaming made up 30% of NFT activity, with 2.1 million daily active wallets.
- About 2.8 million people use blockchain games daily, making up 28% of all Web3 dApp activity.
- In Q2, 2024, Ronin added 1.9 million new daily wallets, making it the top gaming blockchain.
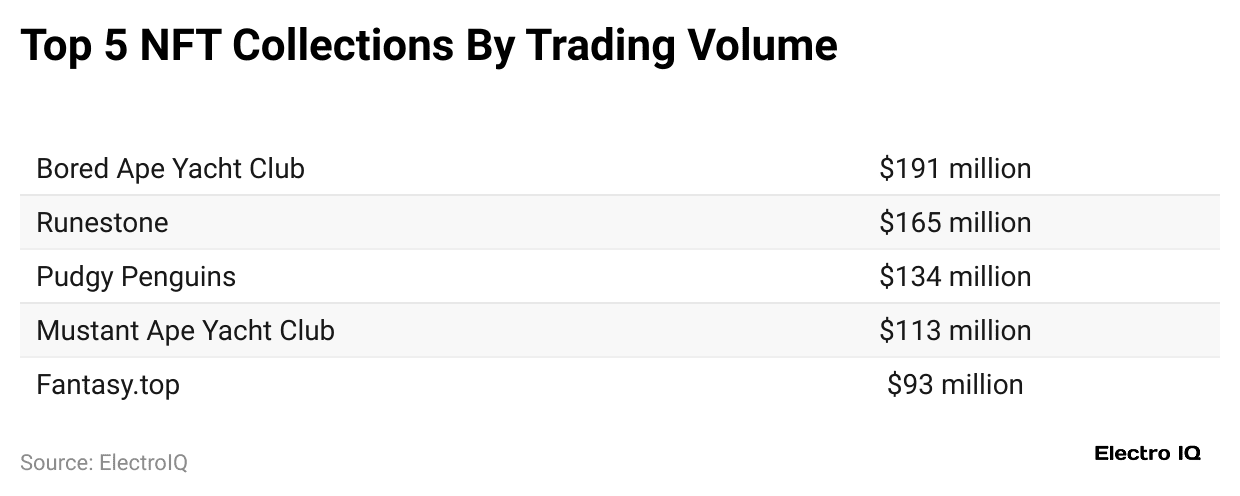
- In the same period, Bored Ape Yacht Club is still the top NFT collection, reaching a trading volume of USD 191 million, followed by Runestone (USD 165 million), Pudgy Penuins (USD 134 million), Mutant Ape Yacht Club (USD 113 million), and fantasy. Top (USD 93 million).
- The Web3 gaming market could grow from USD 4.6 billion in 2024 to USD 65.7 billion by 2027, as mentioned by nftgo.io.
Top NFT Statistics
 (Source: infogram.com)
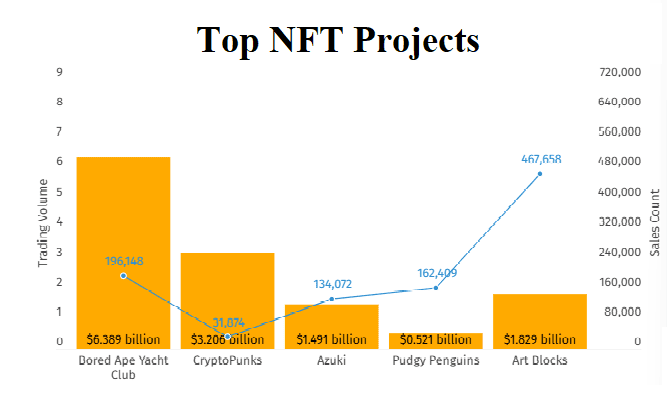
- The top project of NFT in April 2024 was Bored Ape Yacht Club, which earned over USD 6.6389 billion, and the sales count accounted for 196,148.
- An Ethereum-based NFT collection is CryptoPunks, with a trading volume of USD 3.206 billion and a sales count of 31,874.
| Project name | Trading volume | Sales count |
| Azuki | USD 1.491 billion |
134,072 |
|
Pudgy Penguins |
USD 0.521 billion | 162,409 |
| Art Blocks | USD 1.829 billion |
467,658 |
Most Valued NFTs Statistics by Selling Price
 (Reference: infogram.com)
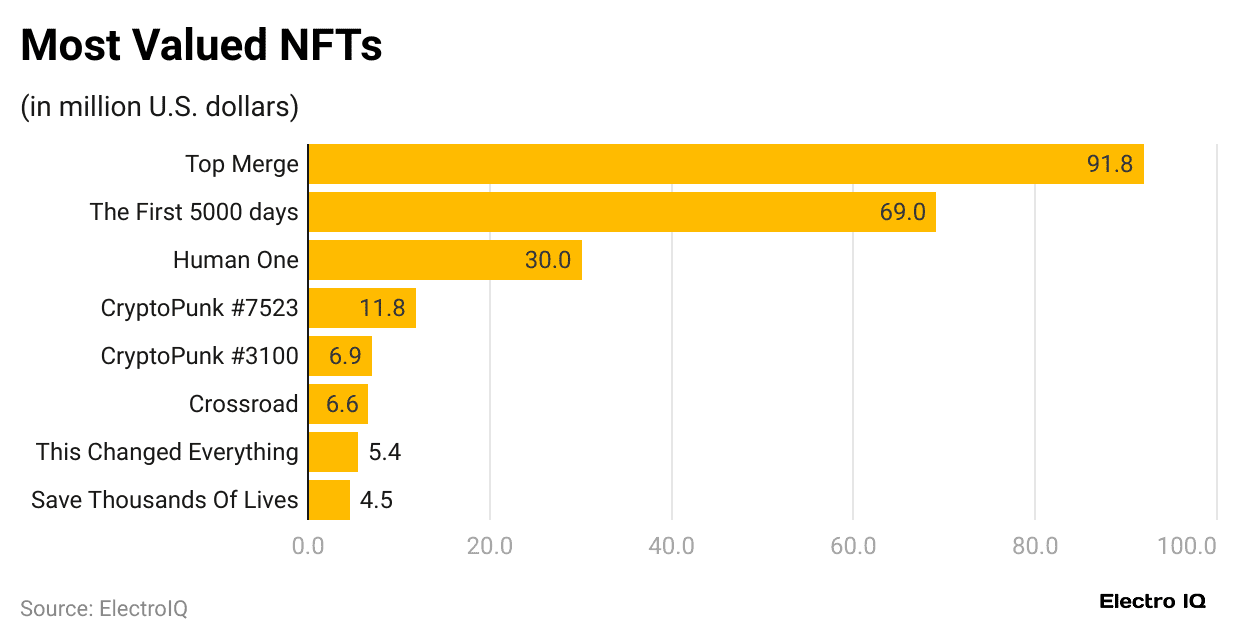
- The above figure represents that as of 2024, “The Merge” is the most expensive NFT ever sold, at USD 91.8 million.
- “The First 5000 Days” follows at USD 69 million and “Human One” (USD 29.98 million).
- Furthermore, other most valued NFTs are selling at prices like CryptoPunks #7523 (USD 11.75 million), CryptoPunks #3100 (USD 6.93 million), Crossroad (USD 6.6 million), This Changed Everything (USD 5.4 million), and Save Thousands of Lives (USD 4.5 million).
NFT Website Traffic Statistics
 (Source: similarweb.com)
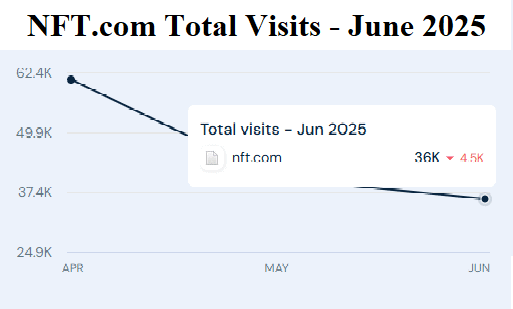
- As of June 2025, in the latest traffic and engagement analysis for nft.com, the site recorded a total of 36,000 visits (-4.5K)
- This marks a decline of 11.03% compared to the previous month.
- The average bounce rate stood at 37.97%, with users viewing about 1.87 pages per visit.
- Additionally, the average visit duration was just 19 seconds.
- Globally, NFT’s website ranked #780,320, in India (#264,665), and category-wise #4,607.
Conclusion
After completing the article on NFT Statistics, NFTs started as a small digital idea but have now become popular all over the world. In the past few years, NFTs have changed how creators earn money by letting them sell unique digital items and own their work online.
As more people start using blockchain and Web3 grows, NFTs will likely stay important in digital art, games, and branding. But for NFTs to succeed in the long run, they must be useful, follow rules, and be easy for people to understand.
Sources
FAQ.
NFTs are owned by individuals or organisations who purchase them through blockchain-based marketplaces or platforms.
NFTs can be sold for real money, usually in cryptocurrency, which can then be converted to cash.
The three main types of NFTs are Art NFTs, Collectable NFTs, and Utility NFTs.
The top limitations include environmental impact, market volatility, copyright disputes, lack of regulation, and uncertain long-term value retention.
NFTs use blockchain technology, mainly Ethereum, to store ownership records and ensure the uniqueness of digital assets and collectables.

Maitrayee Dey has a background in Electrical Engineering and has worked in various technical roles before transitioning to writing. Specializing in technology and Artificial Intelligence, she has served as an Academic Research Analyst and Freelance Writer, particularly focusing on education and healthcare in Australia. Maitrayee's lifelong passions for writing and painting led her to pursue a full-time writing career. She is also the creator of a cooking YouTube channel, where she shares her culinary adventures. At Smartphone Thoughts, Maitrayee brings her expertise in technology to provide in-depth smartphone reviews and app-related statistics, making complex topics easy to understand for all readers.