Qualcomm Statistics By Revenue, Income, Assets, Market Share And Investment
Updated · Sep 04, 2024
Table of Contents
- Introduction
- Editor’s Choice
- Semiconductor Industry Revenue
- Semiconductor Market Growth
- Integrated Circuit Market Revenue
- Semiconductor Sales By Region
- Semiconductor Market Revenue By Region
- Semiconductor Market Revenue By Category
- Qualcomm Revenue
- Qualcomm Revenue By Region
- Qualcomm Operating Income
- Qualcomm Total Assets
- Qualcomm Research And Development Investment
- Qualcomm Research And Development Intensity
- Qualcomm Revenue By Product And Services
- Qualcomm Revenue By Segment
- Qualcomm Revenue Share By Segment
- Qualcomm QCT Segment Total Revenue Breakup
- Revenue Of Qualcomm Semiconductor Market
- Qualcomm Semiconductor Market Share Worldwide
- Leading Semiconductor Companies Worldwide
- Semiconductor Companies By Market Revenue
- Semiconductor Companies By Market Share
- Integrated Circuit Companies By Market Share
- Smartphone Application Processor Vendor Shipment Market Share
- Qualcomm Overview
- Conclusion
Introduction
Qualcomm Statistics: Qualcomm is an American multinational company that manufactures semiconductor chips, software, and services using wireless technologies. It is headquartered in San Diego, California. Qualcomm is known for owning patents for mobile technologies essential for businesses.
Over the years, the company has expanded into several manufacturing domains. As a result, it is necessary to discuss Qualcomm statistics and garner essential information that has contributed to the company’s growth and development. Likewise, it would be essential to see the factors that have led the company to become a well-established name in the semiconductor industry.
Editor’s Choice
- The semiconductor market posted a revenue of USD 527 billion in 2023.
- Smartphones will contribute USD 146 billion to the semiconductor market in 2025.
- The QCT (Qualcomm CDMA Technologies) segment contributed 84.82% of Qualcomm’s revenue in 2023.
- Nvidia has the highest market capitalization among the semiconductor companies, with USD 3,064 billion.
- Qualcomm is the world’s 7th largest semiconductor company, with a market capitalization of USD 191.8 billion.
Semiconductor Industry Revenue
(Reference: Statista.com)
- The semiconductor industry has witnessed significant growth in recent years, and Qualcomm's growth can be compared to that of the industry.
- Qualcomm statistics show that as of 2023, the semiconductor industry had a market revenue of around USD 527 billion.
- The semiconductor industry is predicted to grow enormously by the end of 2025, reaching a value of USD 6.87.38 billion.
Semiconductor Market Growth
![]()
(Reference: Statista.com)
- Qualcomm statistics show that the semiconductor industry's market growth has fluctuated over the past 35 years.
- The graph shows that the industry usually experiences positive growth in a year and negative growth in subsequent years.
- As of 2023, the industry showed a positive % growth rate of 16%.
- By the end of 2024, the Semiconductor industry is predicted to post a positive growth rate of 12.5%.
Integrated Circuit Market Revenue
(Reference: Statista.com)
- The integrated circuit is the backbone of the semiconductor industry, and all chips are based on this technology.
- Qualcomm statistics show that by the end of 2023, the integrated circuit market showcased revenue of USD 422.17 billion.
- The integrated circuit market is expected to reach USD 487.45 billion by 2024.
Semiconductor Sales By Region
![]()
(Reference: Statista.com)
- The semiconductor industry has witnessed growth in sales from different regions.
- Revenue regions can be broadly divided into the Americas, Europe, Japan and Asia Pacific.
- The Asia Pacific region has consistently provided the most significant revenue. In 2023, it posted USD 289.99 billion in revenue.
- When comparing the revenue of other regions, one may find revenue of USD 134.28 billion, USD 55.76 billion, and USD 46.75 billion from the Americas, Europe, and Japan.
Semiconductor Market Revenue By Region
(Reference: Statista.com)
- The Qualcomm statistics show that the semiconductor industry market can be classified into four regions: the USA, South Korea, Japan, the EU, Taiwan, China and the remaining areas.
- The United States consistently has the highest market share. As of 2022, the semiconductor market revenue of the United States was 48%, followed by South Korea with 19%, Japan with 9%, the European Union with 9%, Taiwan with 8%, and China with 7%.
Semiconductor Market Revenue By Category
![]()
(Reference: Statista.com)
- By gathering information about Qualcomm statistics, one can understand the different segments of the semiconductor industry.
- Currently, the semiconductor market can be divided into the following categories: Servers, data centers and storage, Automotive, Industrial electronics, Personal computing, Wired and wireless infrastructure, Smartphone, and Consumer electronics.
- Smartphones will remain essential until 2023 by contributing USD 104 billion in revenue.
- By the end of 2025, smartphones are expected to have a market revenue of USD 146 billion, followed by Personal computing with USD 107 billion, Consumer electronics with USD 74 billion, Automotive at USD 104 billion, Industrial electronics with USD 94 billion, Wired and wireless infrastructure with USD 60 billion, Servers, data centers, and storage with USD 136 billion revenue.
Qualcomm Revenue
(Reference: Statista.com)
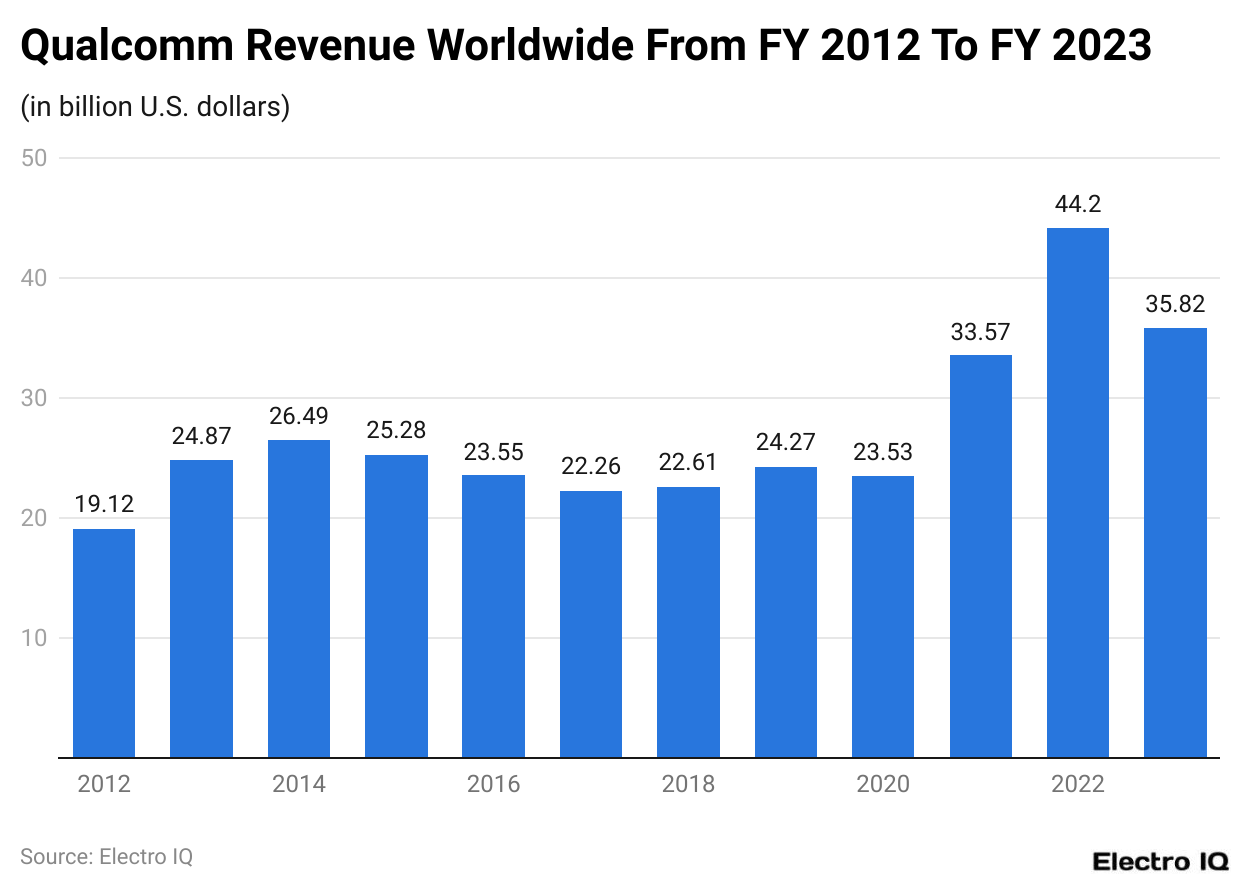
- Qualcomm statistics reveal that the company is consistently growing.
- Between the period of (2012 to 2023), Qualcomm experienced a peak revenue of USD 44.2 billion in 2022.
- By the end of 2023, Qualcomm experienced revenue of USD 35.82 billion.
Qualcomm Revenue By Region
(Reference: Statista.com)
- Qualcomm statistics reveal that the company’s revenue can be classified into the following regions: Ireland, China (including Hong Kong), South Korea, Vietnam, the United States, and Other non-domestic markets.
- China is consistently Qualcomm's highest-grossing region. By the end of 2023, it generated revenue of USD 22,382 billion.
- Vietnam is Qualcomm's second-highest grossing region, with USD 4,551 billion; South Korea, with USD 3,272 billion; the US, USD 1,259 billion; and other markets, USD 4,356 billion.
Qualcomm Operating Income
(Reference: Statista.com)
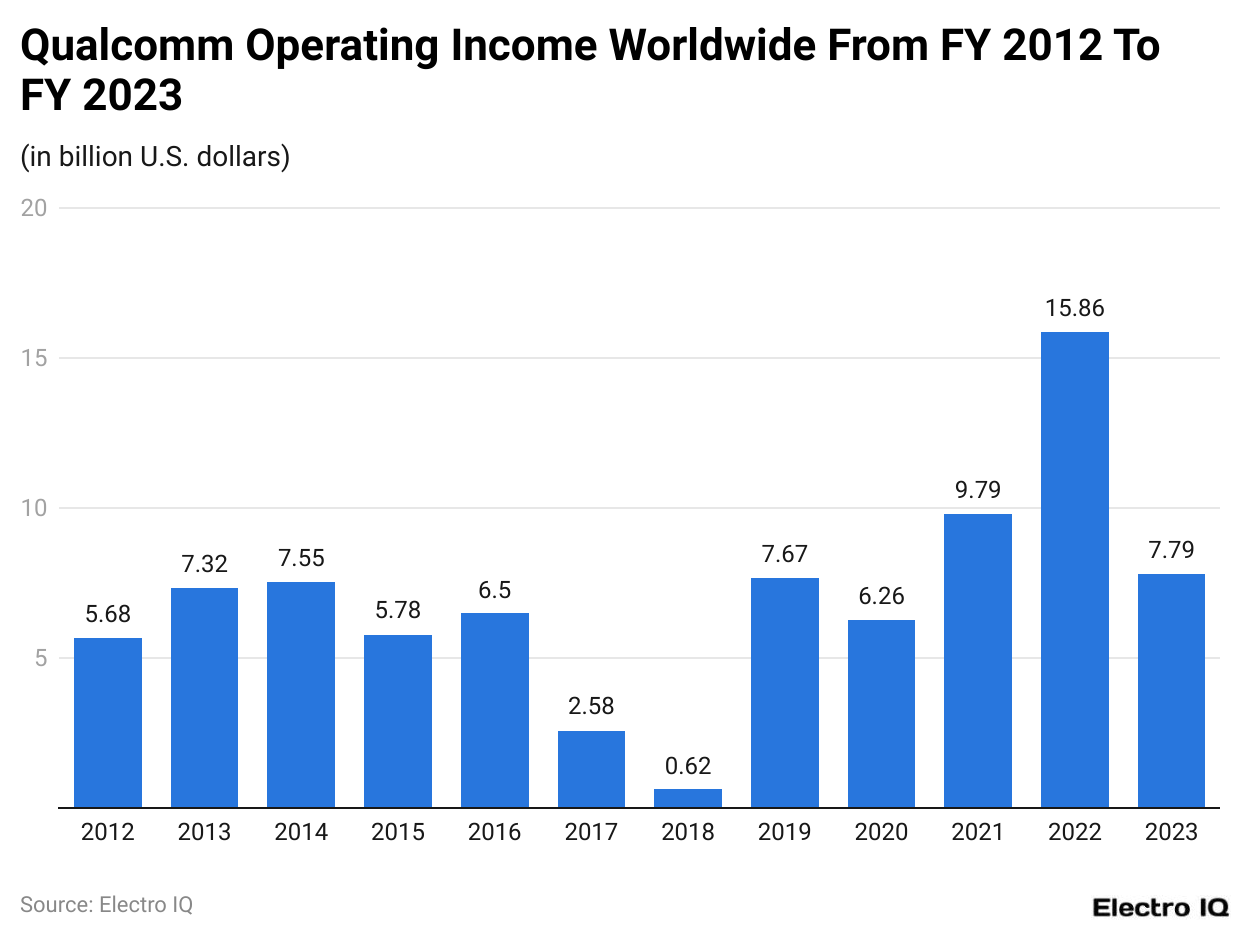
- Qualcomm statistics reveal that the company posted an all-time high revenue of USD 15.86 million in 2022.
- Qualcomm's lowest revenue period (2012 to 2023) was 2018, with USD 0.62 million.
- As of 2023, Qualcomm's revenue was USD 7.79 billion.
Qualcomm Total Assets
(Reference: Statista.com)
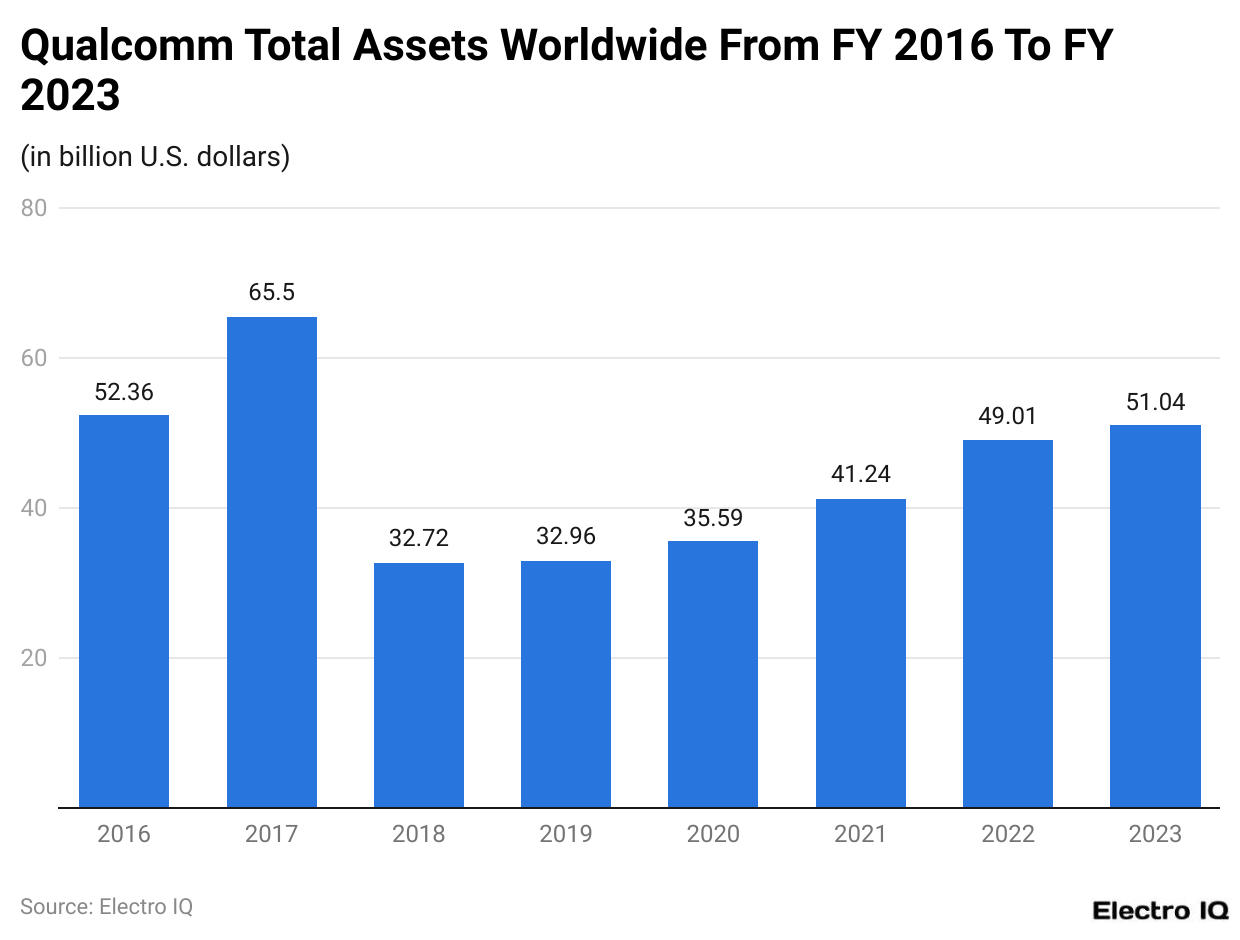
- Qualcomm statistics reveal that the company's assets reached a peak value of USD 65.5 billion in 2017.
- In subsequent years, it saw a significant dip in asset value, with USD 32.72 billion in 2018.
- As of 2023, Qualcomm's asset value is USD 51.04 billion.
Qualcomm Research And Development Investment
(Reference: Statista.com)
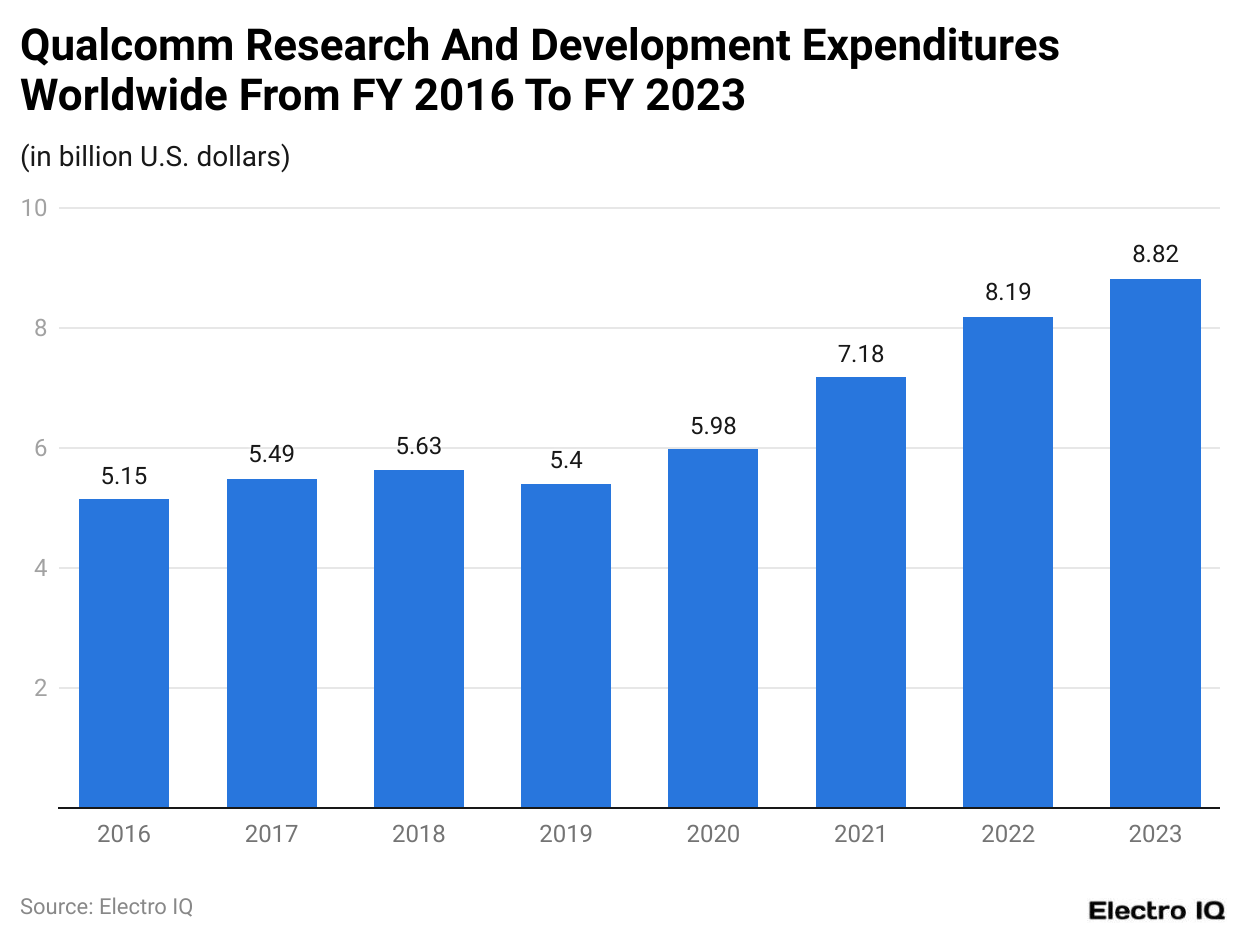
- Qualcomm statistics showcase how the company’s has consistently invested in research and development.
- The rise in investment could be attributed to the value of the investments, which was USD 5.15 billion in 2016 but rose to USD 8.82 billion in 2023.
- One of the major factors contributing to Qualcomm's leadership in the tech industry is its consistent investment in innovation. The company's research and development investment has risen from USD 5.15 billion in 2016 to USD 8.82 billion in 2023, a clear sign of its commitment to staying ahead in the industry.
Qualcomm Research And Development Intensity
(Reference: Statista.com)
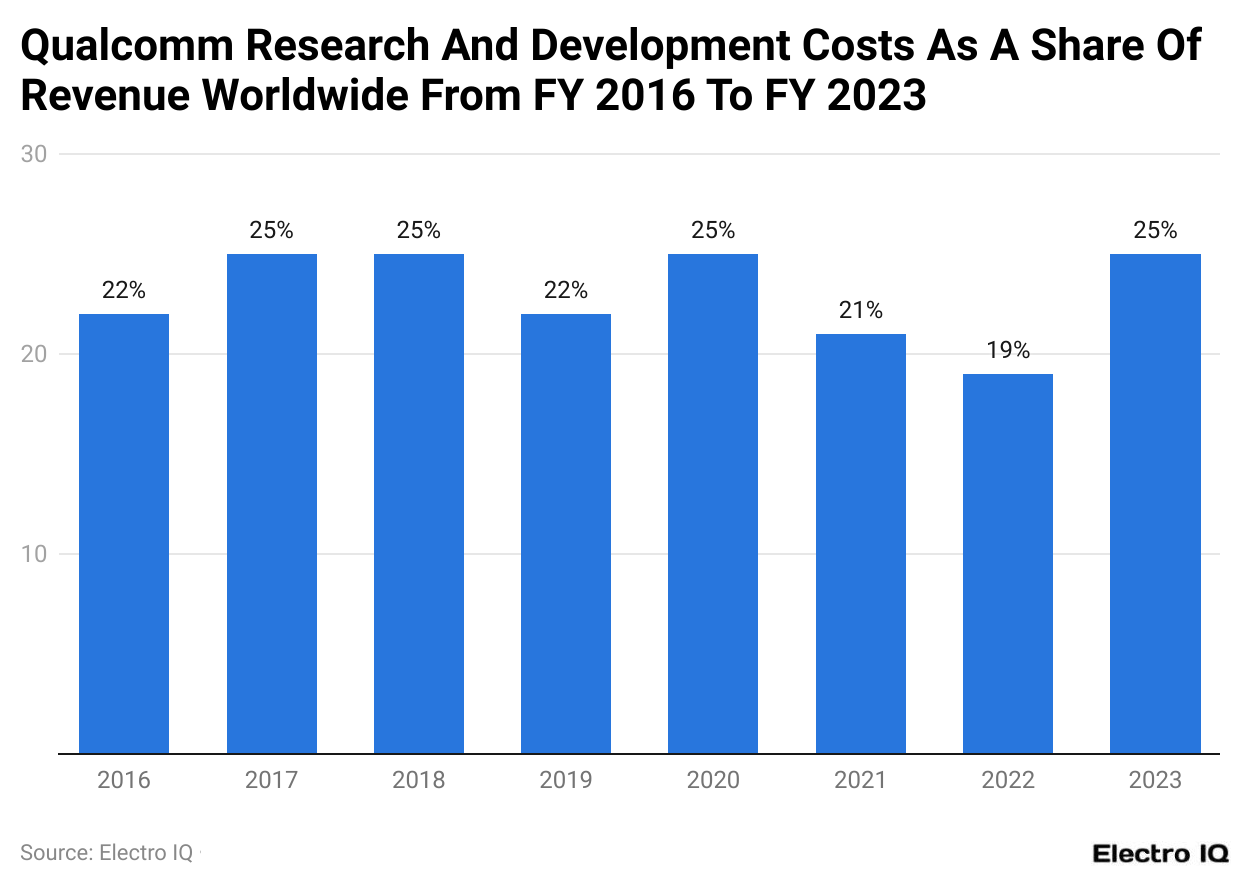
- Qualcomm statistics indicate that research and development costs have been consistent as a share of revenue.
- Between the period (2016 to 2023), the revenue rate was between 19% to 25%.
- As of 2023, the cost-to-investment ratio was 25%.
Qualcomm Revenue By Product And Services
(Reference: Statista.com)
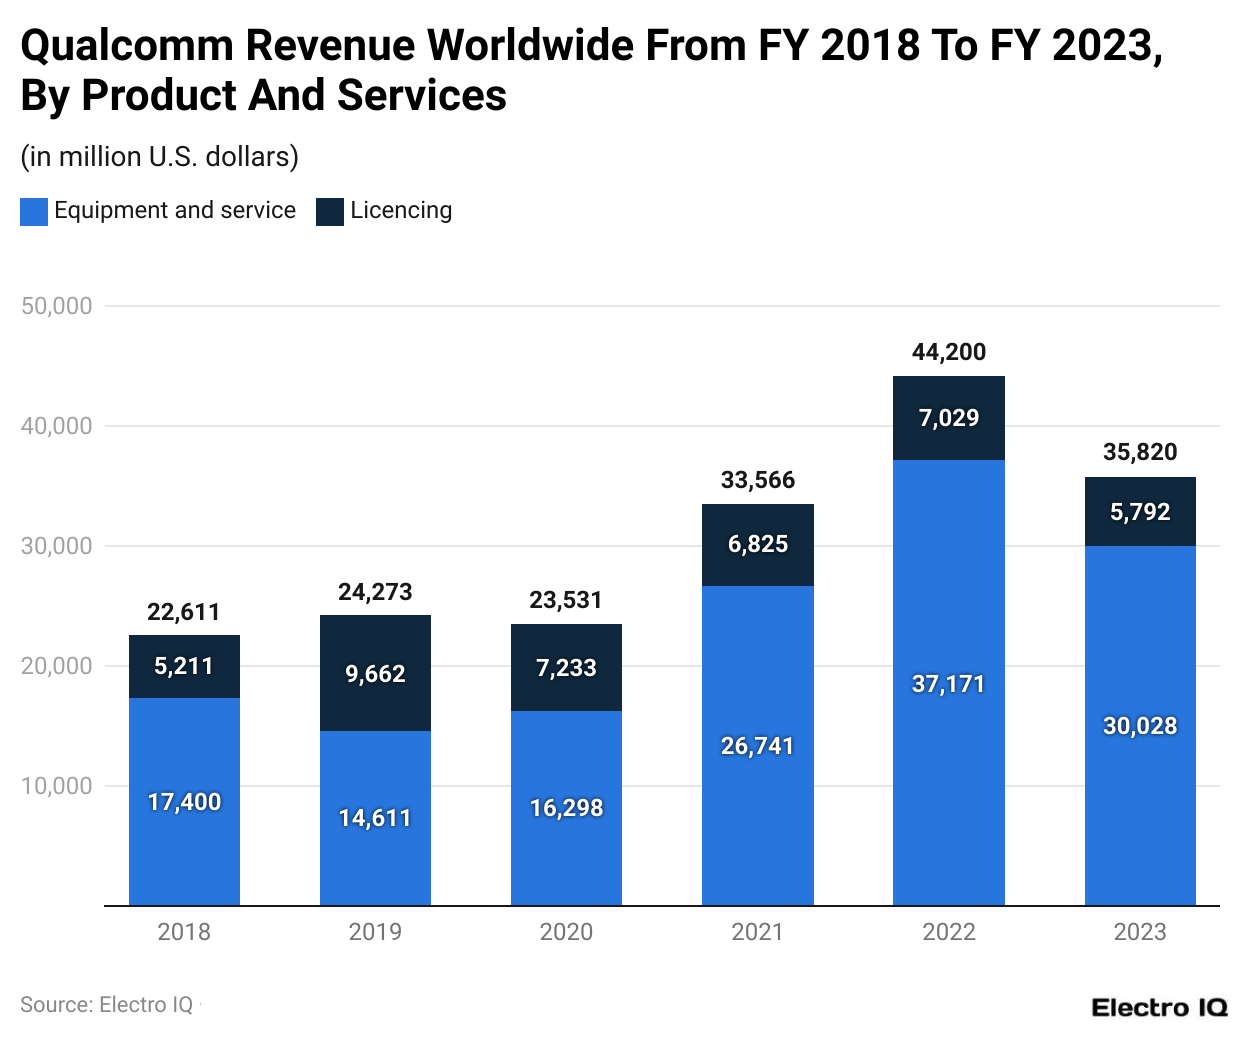
- Qualcomm statistics show that equipment and services and licensing are the two categories from which the company generates revenue.
- In 2023 the company generated USD 30,028 million from its equipment and USD 5,792 with licensing.
- It's noteworthy that Qualcomm, a leading supplier of networking systems, generated a substantial revenue of USD 30,028 million from equipment and USD 5,792 million from licensing in 2023.
Qualcomm Revenue By Segment
(Reference: Statista.com)
- Qualcomm statistics show that the revenue of the company can be broadly classified into three sections, namely QCT (Qualcomm CDMA Technologies), QTL ((Qualcomm Technology Licensing)) and QSI(Qualcomm Strategic Initiatives).
- The QCT segment is the company's highest-grossing segment, accounting for more than 50% of its revenue worldwide, followed by the QTl and QSI segments.
- As of 2023, Qualcomm's QCT segment generated USD 30,382 million, QTL USD 5,306 billion, and QSI USD 28 billion.
(Reference: Statista.com)
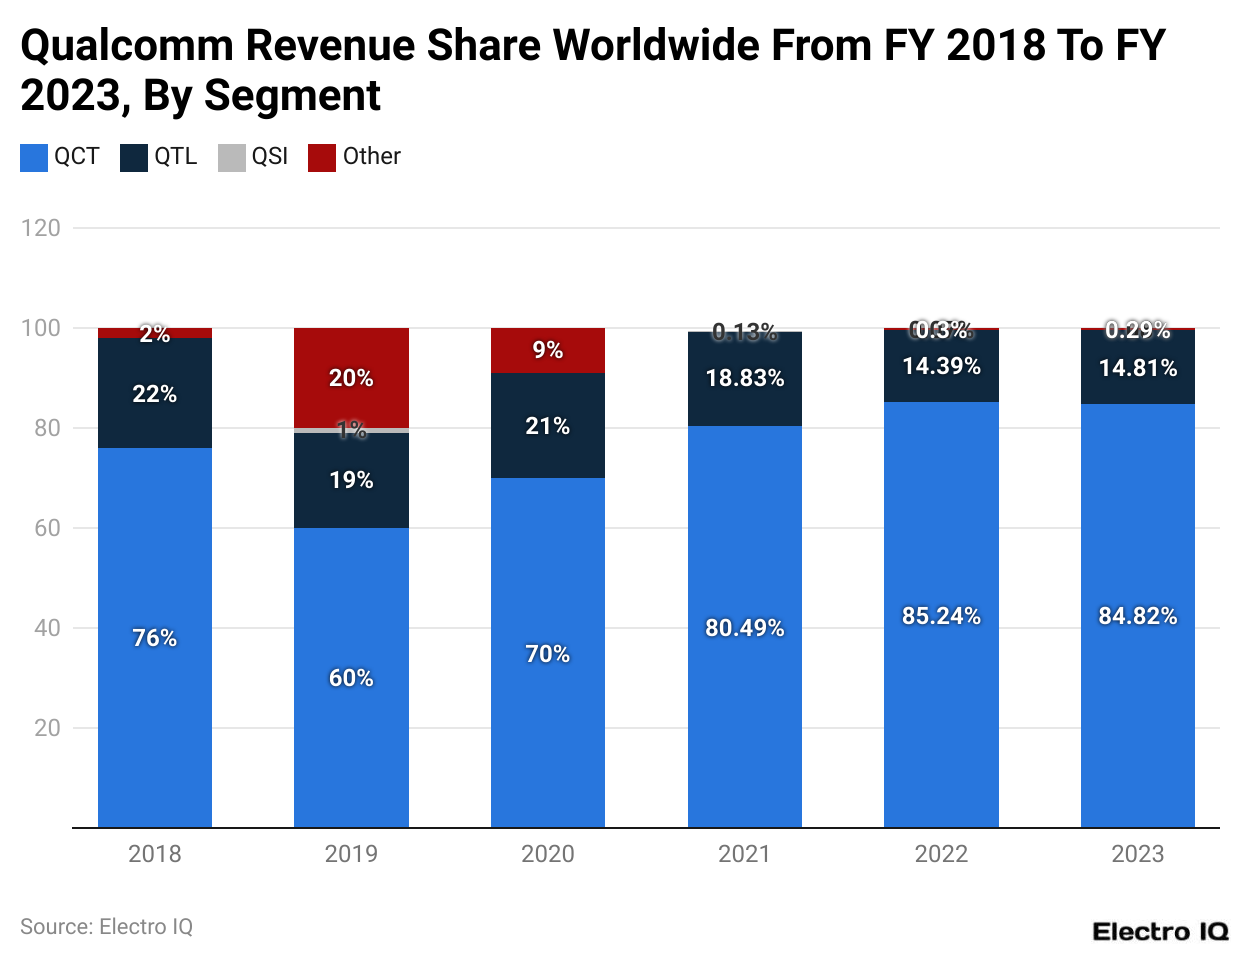
- Qualcomm's statistics show that the QCT segment, which accounts for more than 50% of its revenue, is a dominant force in the company's overall sales revenue.
- In 2023, 84.82% of the company’s revenue came from the QCT segment alone.
- The remaining revenue was followed by the QTL segment with 14.81%, QSI with 0.08%, and the remaining segments with 0.29%.
Qualcomm QCT Segment Total Revenue Breakup
(Reference: Statista.com)
- As Qualcomm's QCT (Qualcomm CDMA Technologies) segment is the most dominant in terms of revenue, it is essential to gather information about the revenue division of the whole segment.
- If one refers to Qualcomm statistics, one will find handsets have the highest revenue worldwide.
- As of 2023, the QCT handset component had USD 22,570 million, followed by USD 1,872 million in the Automotive component segment and USD 5,940 million in the IoT segment.
Revenue Of Qualcomm Semiconductor Market
![]()
(Reference: Statista.com)
- It is essential to understand Qualcomm's revenue in order to gain a holistic view of its popularity.
- Qualcomm statistics show that the company generated a peak revenue of USD 34.78 billion in 2022.
- As of 2023, the company’s revenue was USD 29.02 billion.
![]()
(Reference: Statista.com)
- Going through Qualcomm's statistics, one can see that the company's market share in the semiconductor industry fluctuates between 2.5% and 5.8%.
- The company’s market share reached a peak of 5.8% in 2022.
- Between 2008 and 2023, the period in which the company had the lowest market share was during 2010, when the market share was just 2.4%.
Leading Semiconductor Companies Worldwide
![]()
(Reference: Statista.com)
- Referring to Qualcomm statistics, one can see that Nvidia has the highest market capitalization among semiconductor companies by a margin, with USD 3,064 billion, making it join an elite club of trillionaire companies.
- It is followed by TSMC with USD 905.17 billion, Broadcom with USD 771.4 billion, Samsung with USD 388.31 billion, ASML with USD 361.21 billion, and AMD with USD 240.44 billion.
- As of August 2024, Qualcomm is the world’s seventh-largest semiconductor company, with a market capitalization of USD 191.8 billion.
Semiconductor Companies By Market Revenue
(Reference: Statista.com)
- The semiconductor industry is clustered with many prominent players in the company.
- As per Qualcomm statistics, Qualcomm is consistently ranked among the top companies in the semiconductor industry.
- As of 2023, Intel was the leader with USD 48.66 billion in revenue. It was followed by Samsung with USD 39.91 billion in revenue and Qualcomm with USD 29.02 billion.
(Reference: Statista.com)
- Qualcomm statistics reveal that it has consistently been ranked among the top companies with a strong position in the semiconductor market.
- As of 2023, Intel is the leader in the semiconductor market, with a 9.1% market share. Samsung follows it with 7.5% and Qualcomm with 5.4%.
(Reference: Statista.com)
- The integrated circuits serve as the backbone of the semiconductor industry.
- Going through the Qualcomm statistics, one may find that Nvidia has the highest revenue among IC companies, with USD 16,512 million, followed by Qualcomm's USD 7,374 million.
- The rest of the companies with a substantial share in the IC market are Broadcom, AMD, MediaTek, Marvell, Novatek, Realtek, Will Semiconductor, and Cirrus Logic.
(Reference: Statista.com)
- Smartphones are an important component of the current digital age.
- Going through the Qualcomm statistics, one will find that Media Tek has consistently been the leader in smartphone application vendors in terms of market share.
- As of Q4 2023, MediaTek is the leader in smartphone application processors with 36% market share, followed by Qualcomm with 23%.
Qualcomm Overview
Qualcomm is anticipated to generate around USD 48 billion in sales in 2024, a further 9% rise over 2023. This development is anticipated to be primarily driven by the ongoing worldwide rollout of 5G networks and the expanding market for Internet of Things (IoT) devices. Qualcomm has positioned itself to preserve its leadership in the semiconductor market thanks to its USD 7.5 billion in research and development expenditure in 2023.
In 2023, Qualcomm held a 30% market share in the worldwide smartphone application processor market, positioning it as a prominent player in this industry. This market share is anticipated to be steady in 2024, with only minor variations based on market conditions and competition. Furthermore, Qualcomm's automotive division, which is home to the Snapdragon Digital Chassis platform, brought in around USD 1.5 billion in revenue for the business in 2023 and is expected to increase by 15% the following year.
Geographically speaking, the Asia-Pacific area accounted for 65% of Qualcomm's overall sales in 2023, which translated into the majority of the company's income. The strong demand for smartphones and Internet of Things (IoT) devices in nations like China and India is predicted to fuel this trend till 2024.
Qualcomm reported USD 44 billion in total sales in 2023, a 10% increase over the previous year's figures. The growing popularity of 5G cellphones, which Qualcomm powers with its Snapdragon CPUs, was a significant factor in this surge. Operating income for the corporation in 2023 was over USD 14 billion, indicating a good profit margin of roughly 32%. These numbers demonstrate Qualcomm's dominant position in the industry and its capacity to exploit the rising demand for cutting-edge mobile technology.
Conclusion
Qualcomm has emerged as one of the biggest names in the semiconductor industry. The company's statistics clearly show that it is a market leader in the wireless technologies segment. The company has grown consistently, ensuring that there is a gradual increase in investment in research and development for the development of more innovative products.
Furthermore, it has been the key to the company's significant success in the semiconductor industry. As the world moves forward towards 5G adoption and gears up for the introduction of 6G, it is clear that Qualcomm is expected to be a leading force in further innovation in the semiconductor industry.
Sources
FAQ.
Equipment and services remain the primary source of revenue for Qualcomm, which is categorized as the QCT department.
Qualcomm statistics show that as of Q4 2023, Qualcomm holds a 23% market share.
Asia Pacific region amounts to 65% of all Qualcomm revenue as of 2023.

Joseph D'Souza founded ElectroIQ in 2010 as a personal project to share his insights and experiences with tech gadgets. Over time, it has grown into a well-regarded tech blog, known for its in-depth technology trends, smartphone reviews and app-related statistics.


