Social Media At Workplace Statistics By Usage, Income Level And Time Spent
Updated · Nov 04, 2025

Table of Contents
- Introduction
- Editor’s Choice
- Different Reasons For The Usage of Social Media
- Young Workers Prefer Social Media in The Workspace.
- Likelihood For Workers To Use Social Media
- Frequency of Internet Usage for Job-Related Tasks
- Social Media Work Policy in the US
- Average Time Spent on Social Media
- Age of Social Media Users at Work
- Usage of Social Media at Work
- Income Level For Social Media at Work
- Time Spent on Social Media at Work
- Work Functions For Social Media
- Popular Social Media Platforms in The Workspace
- Social Media in the Workplace Overview
- Conclusion
Introduction
Social Media at Workplace Statistics: Social Media has become an essential part of everyone’s lives. For the most part, it is a valuable medium to ensure people are adequately connected and have an overview of how their peers and family members work. However, depending on the intensity of usage, it has often been said to become an addiction and cause the destruction of other responsibilities.
As we go through the social media at workplace statistics, one can understand the impact of this technological tool on the workplace.
Editor’s Choice
- 78% of employees used social media during work hours in 2024, showing a 5% increase from 2023
- Average daily social media time at work increased to 1.9 hours in 2024
- 82% of technology sector employees actively engage on social media platforms
- 84% of employees aged 18-34 use social media during work hours
- 80% of companies had social media policies in place by 2024
- Facebook leads workplace social media usage, with 80% of employees
- 77% of workers use social media to connect with potential clients
- 93% of employees earning over 80k pounds use social media consistently
- 55% of employees spend 1-2 hours daily on social media at work
- 61% of HR managers use social media for recruitment processes
Different Reasons For The Usage of Social Media
(Reference: pewresearch.org)
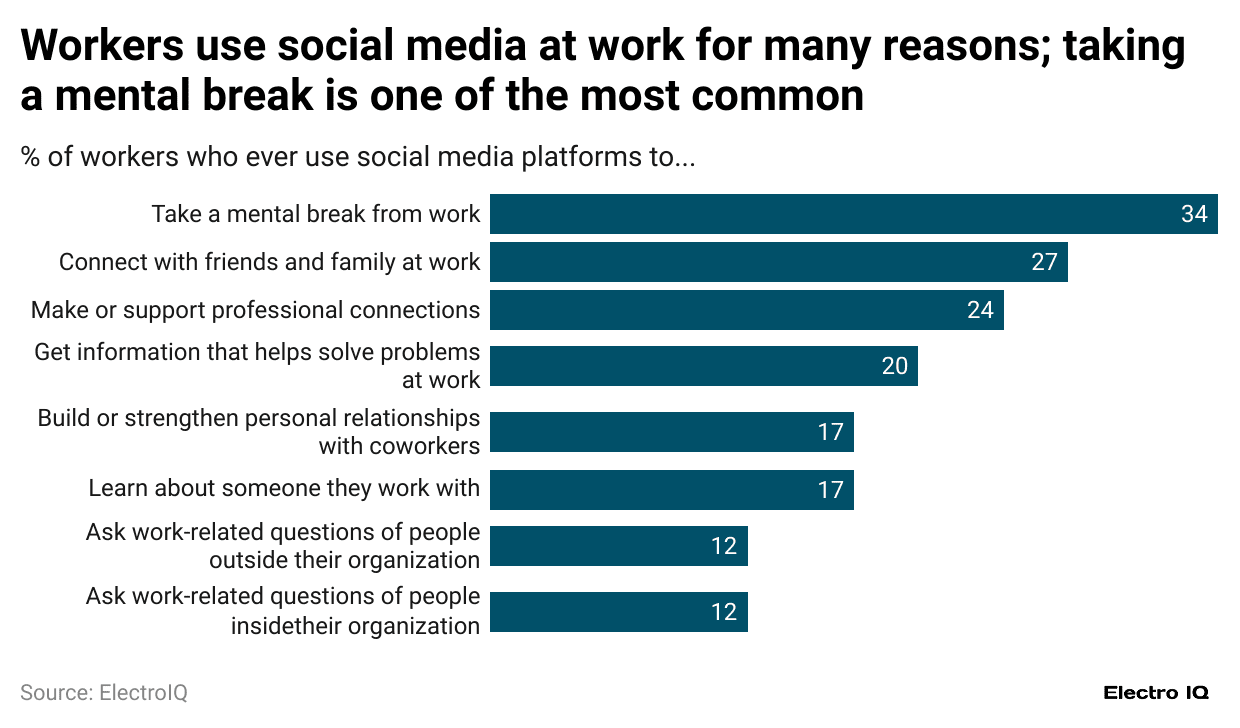
- Social Media at Workplace Statistics showcase a wide variety of reasons why employees use social media at work.
- According to a majority, 34% of respondents use social media to take a mental break from work.
- This is followed by 27% using it to connect with friends and family, and 24% accumulating professional connections.
- Relatively lower in terms of reasons are garnering essential solutions for work, growing the professional network, learning a new skill, and asking work-related questions outside the professional network, among 20%,17, and 12% of respondents.
Young Workers Prefer Social Media in The Workspace.
(Reference: pewresearch.org)
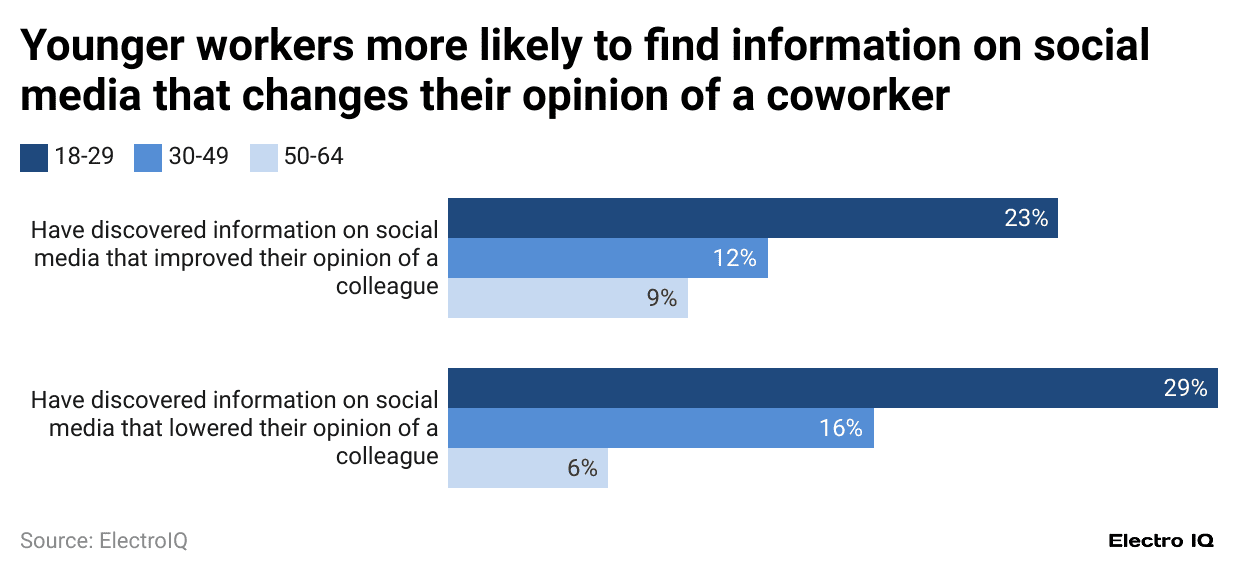
- Social Media At the Workplace Statistics show that younger workers prefer to work in social media to garner relevant information.
- The ages of individuals from 18-29 prefer to discover social media to gain essential information about colleagues, with 23% of respondents. Similarly, 29% of respondents felt that social media provides information that reduces their opinion of their colleagues.
- In contrast with the higher-aged individuals, their opinion of social media usage has decreased relatively over time, showing relevance at 12% for ages 30-49 and 9% for ages 50-64.
Likelihood For Workers To Use Social Media
(Reference: pewresearch.org)
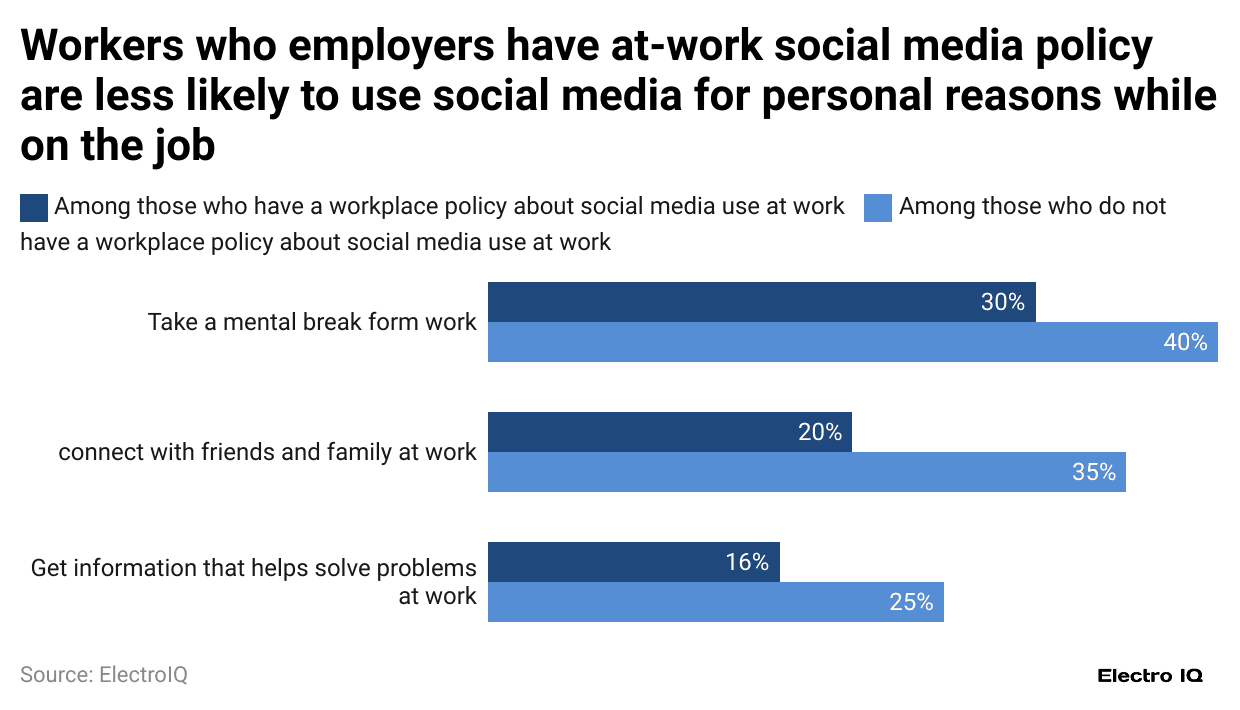
- Social Media At the Workplace Statistics show that social media has many uses.
- Social media for a mental break is used by 30% of respondents among individuals who have a workplace policy about social media usage at work, while 40% is for those workers who don’t have a workplace policy about social media usage at work.
- 20% of respondents don’t have a workplace policy about social media usage at work, and 35%
Frequency of Internet Usage for Job-Related Tasks
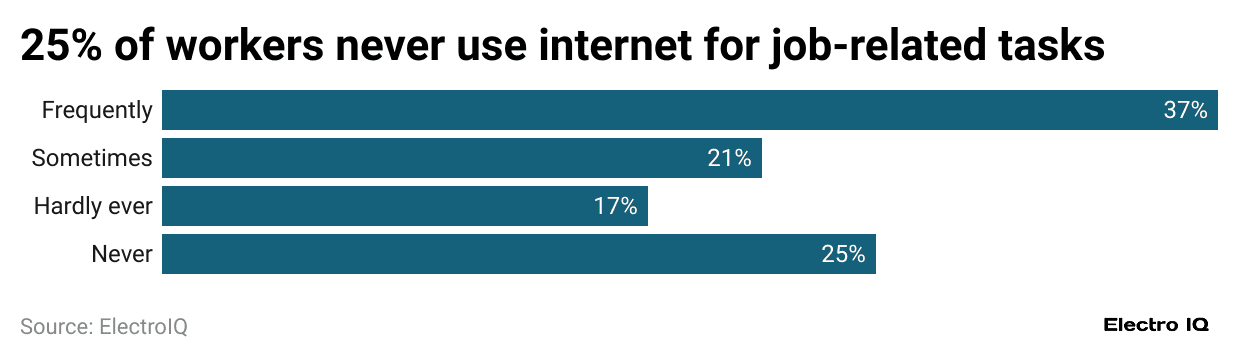
(Reference: pewresearch.org)
- Social Media At the Workplace Statistics show that 37% of users frequently use the internet for social media tasks.
- 21% of respondents use the Internet for a job or some tasks, 17% of users hardly ever use the Internet for functions, and 25% of users never use the Internet for job-related tasks.
Social Media Work Policy in the US
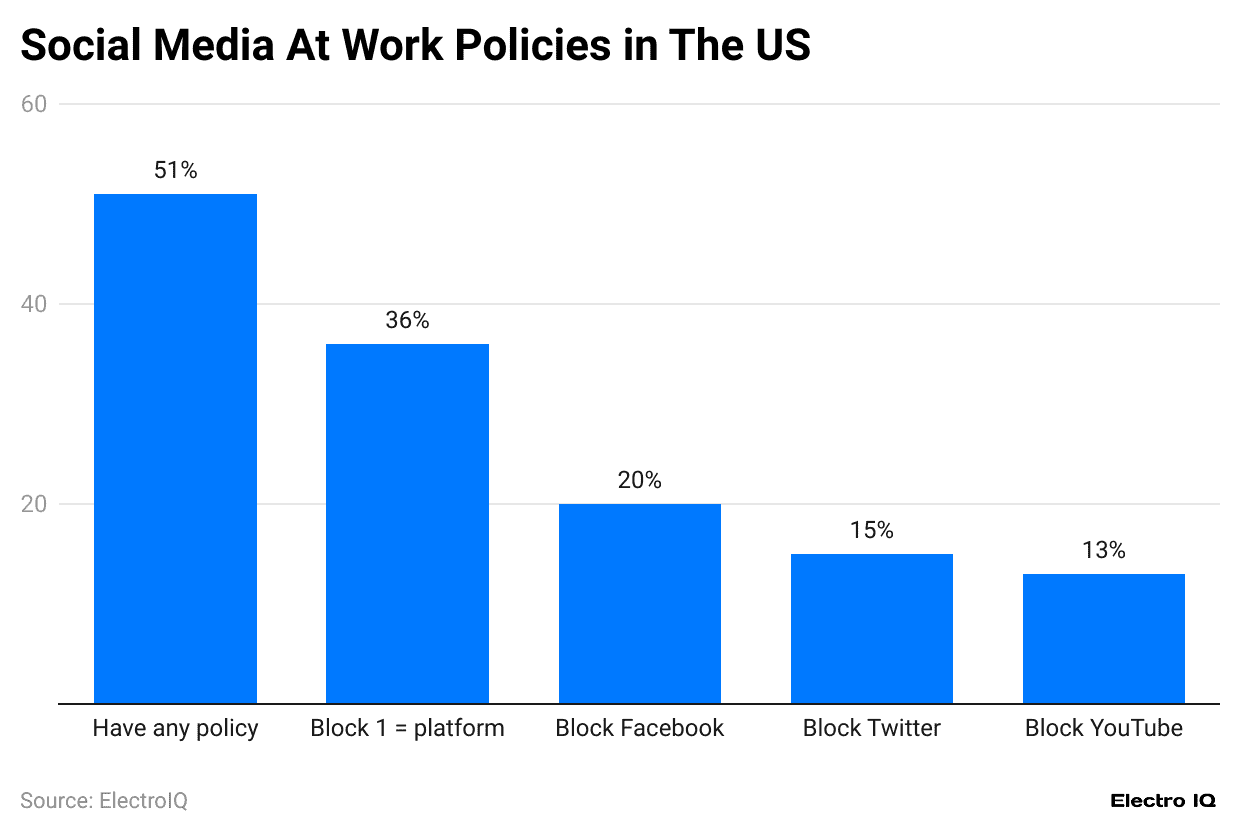
(Reference: zippia.com)
- Social Media At the Workplace Statistics show that social media usage in the US workplace is prominent.
- 51% of respondents show that they have a policy in the workspace.
- While 36% of respondents have blocked the +1 platform, 20% of users have blocked Facebook policy, 15% have blocked Twitter, and 13% said they have blocked YouTube policy.
Average Time Spent on Social Media
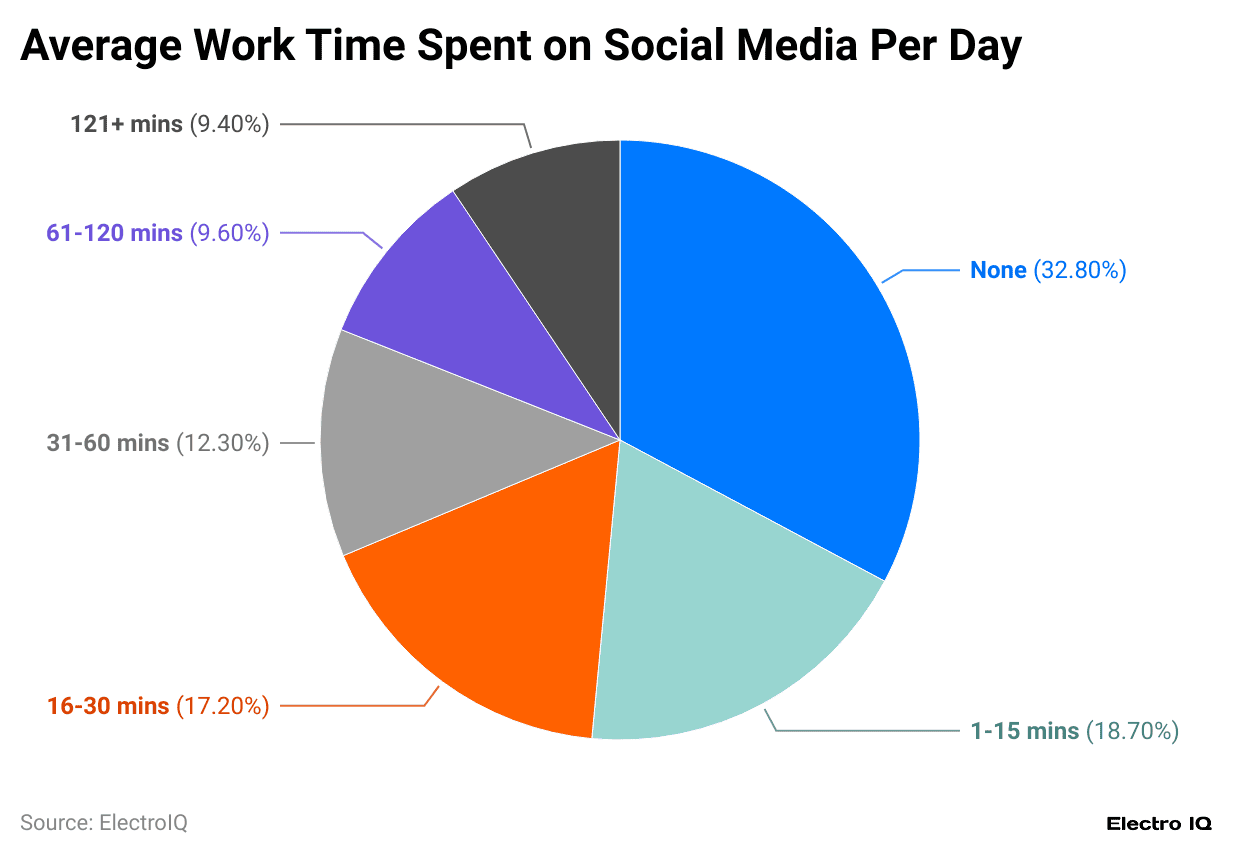
(Reference: zippia.com)
- Social Media At the Workplace Statistics show that the average time spent worldwide by social media users
- 08% of respondents don’t use social media, 18.70% of respondents use social media for 1-15 minutes, 17.20% of respondents use social media for 16-30 mins per day, 12.30 respondents use social media for 31-60 mins per day, 9.60% of respondents use social media for 61-120 mins per day, 9.40% of respondents use social media use work time spent on social media 121+ per day.
Age of Social Media Users at Work
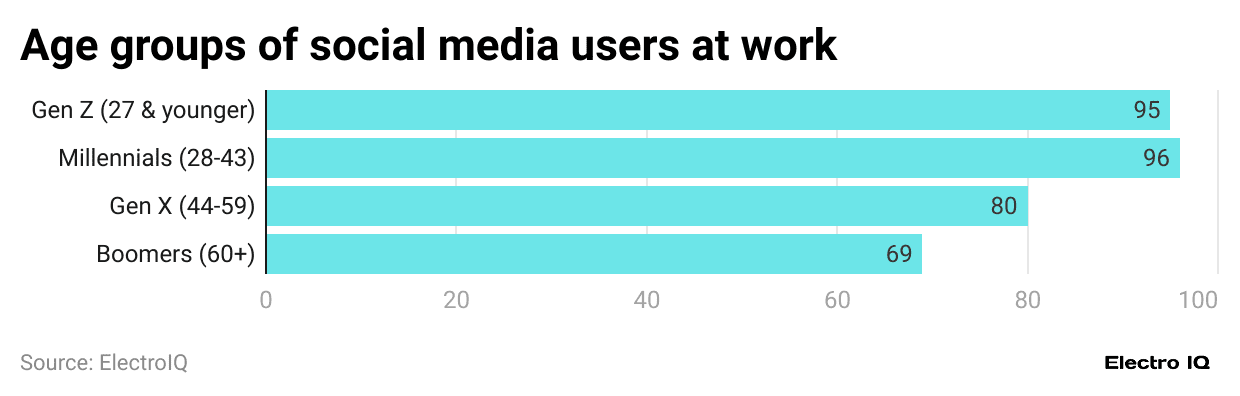
(Reference: standout-cv.com)
- Social Media At the Workplace Statistics show that different age groups use social media at work, among other respondents.
- Gen Z and the younger population (27 & younger) show social media usage with 90% of respondents, followed by Millennials (28 – 43) with a similar share of respondents.
- In contrast, with higher ages, the share of users who use social media is 80% of respondents, followed by boomers (60+) using social media, with 70% of respondents.
Usage of Social Media at Work
(Source: standout-cv.com)
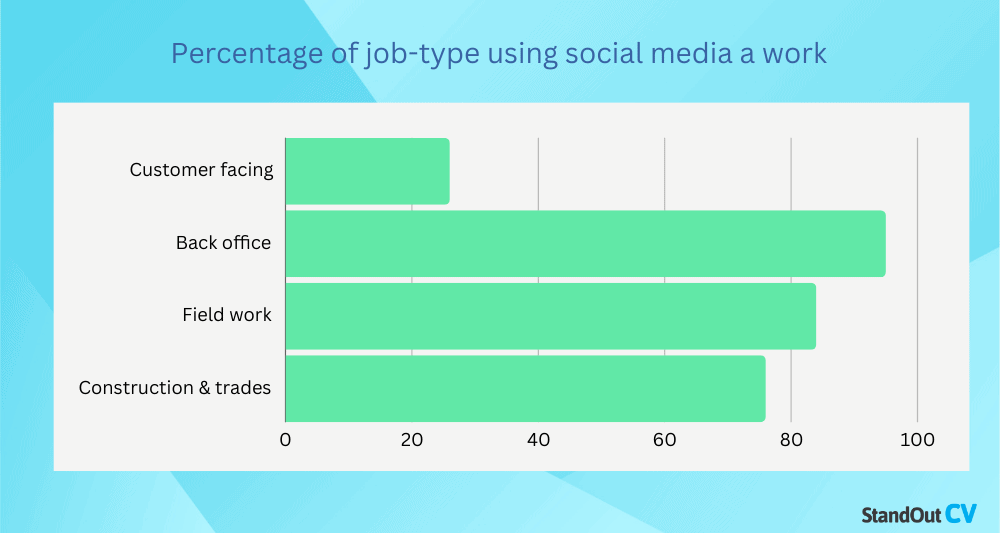
- Social Media At the Workplace Statistics show a wide variety of usage per requirements.
- More than 90% of users use social media for back-office work. In comparison, around 85% use it for fieldwork, 70% use social media for construction and trade opportunities, and 25% use it for customer-facing.
Income Level For Social Media at Work
(Reference: standout-cv.com)
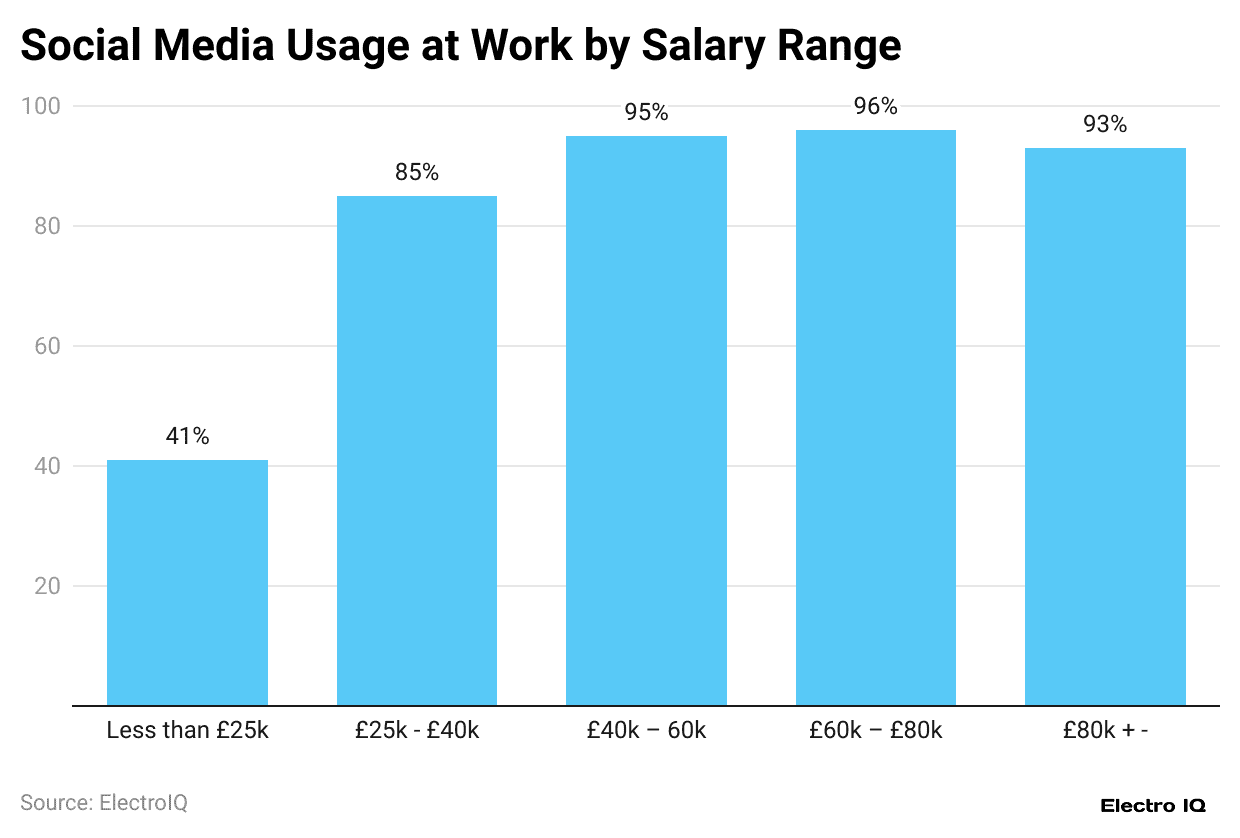
- Social Media At the Workplace Statistics show that social media usage increases according to income levels.
- Individuals whose income is less than 25k pounds have 41% of respondents using social media, whereas, with a population with a salary of more than 80k pounds, 93% use social media consistently over time.
Time Spent on Social Media at Work
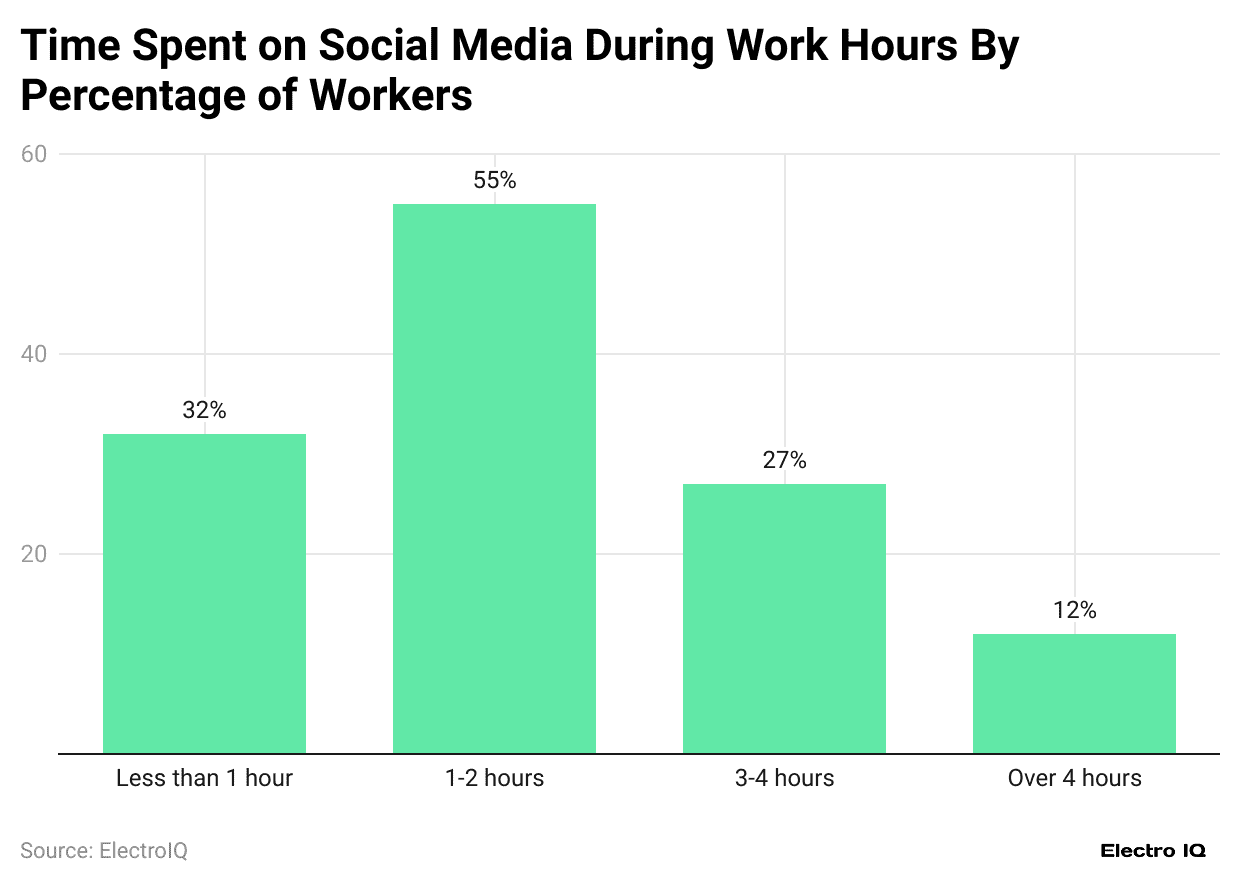
(Reference: standout-cv.com)
- Social Media At Workplace Statistics show that the average time spent on social media was 1-2 hours among 55% of respondents, followed by 32% of respondents using social media at work for less than 1 hour 32% of respondents, 27% of respondents using social media at work for 3-4 hours, while 12% of respondents use social media for more than 4 hours.
Work Functions For Social Media
(Reference: standout-cv.com)
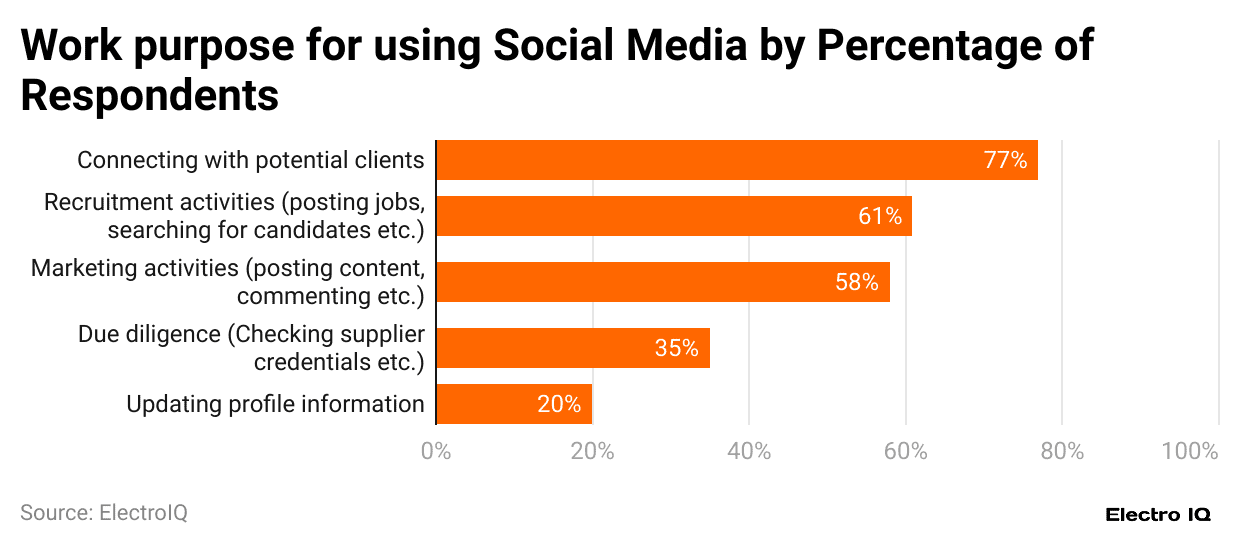
- Social Media in the Workplace Statistics show different uses for individuals to use social media.
- A majority of 77% of respondents use social media to connect with potential clients, followed by recruitment activities, with 58% of users utilizing it for marketing activities.
- Due diligence and updating profile information have the relatively lowest social media usage, with 35% and 20% of respondents overall.
Popular Social Media Platforms in The Workspace
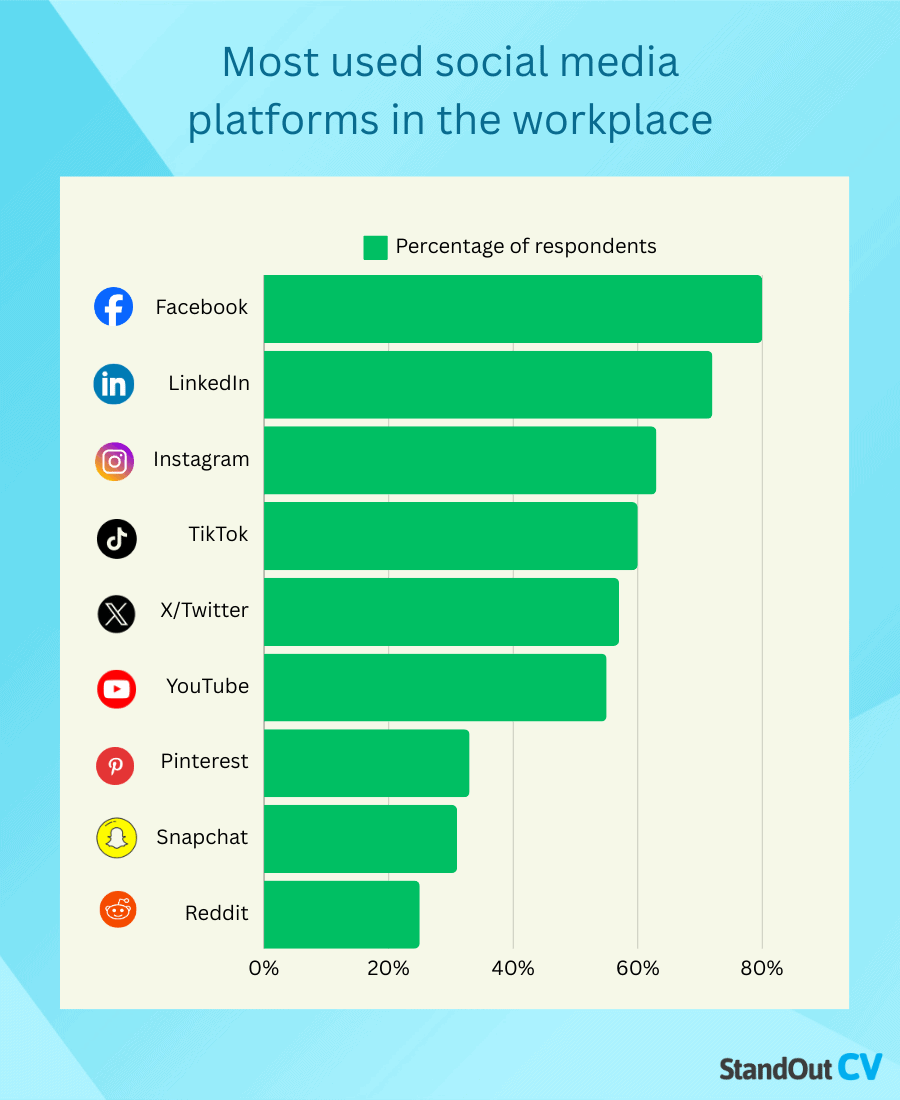
(Source: standout-cv.com)
- Social Media At Workplace Statistics show that Facebook is the most used social media platform, according to 80% of respondents.
- It is followed by LinkedIn, which has 70% of respondents; Instagram, which has 65% of respondents; and TikTok, which has 60%.
- Reddit is the least-used social media platform, with 22% of respondents.
Social Media in the Workplace Overview
- Social Media at Workplace Statistics have become increasingly significant as digital platforms integrate into professional environments. Analyzing data from 2023 and 2024 reveals notable trends in employee behavior, employer policies, and the economic impact of social media in the workplace.
- Employee Usage Rates: In 2023, approximately 73% of employees reported using social media during work hours for personal and professional purposes. This figure rose to 78% in 2024, indicating a growing integration of social media into daily work routines.
(source: pewresearch.org)
- Time Spent on Social Media: Employees’ average time on social media during work hours increased from 1.7 hours per day in 2023 to 1.9 hours in 2024. Notably, 55% of employees reported spending between 1 to 2 hours daily on these platforms in 2024.
(Source: backlinko.com)
- Industry-Specific Usage: The technology sector leads in workplace social media usage, with 82% of employees engaging on platforms like LinkedIn and Twitter. The finance and marketing industries follow closely, each with 78% of employees active on social media during work hours.
( Source: metricool.com)
- Impact on Productivity: Employer perceptions of social media’s impact on productivity have evolved. In 2023, 35% of employers believed social media negatively affected productivity. By 2024, this concern decreased to 30%, suggesting that companies adapt to and manage social media use more effectively.
( Source: metricool.com)
- Professional Development: Social media serves as a tool for professional growth. In 2024, 54% of employees reported using social media to follow industry trends and enhance their skills, up from 49% in 2023.
(source: apa.org)
- Demographic Trends: Younger employees (ages 18-34) are the most active on social media during work hours, with 84% engaging for various purposes. This group also spends the most time on these platforms, averaging 2.1 hours daily.
(source: apa.org)
- Work-Life Balance: In 2024, 61% of employees felt that using social media at work improved their work-life balance by allowing them to stay connected with family and friends, a slight increase from 59% in 2023.
(source: apa.org)
- Platform Preferences: LinkedIn remains the most-used platform for professional purposes, with 68% of employees accessing it during work hours in 2024. Facebook and Instagram are also of considerable use, especially among marketing professionals.
(source: pewresearch.org)
- Company Policies: The implementation of social media policies in workplaces has increased. In 2023, 75% of companies had such policies; this rose to 80% in 2024, reflecting a growing recognition of the need to manage social media use effectively.
(source: pewresearch.org)
- Economic Impact: U.S. companies are investing significantly in managing social media engagement. In 2023, organizations collectively spent approximately USD5 billion on social media monitoring and management tools, which increased to USD5.8 billion in 2024
(source: pewresearch.org)
- Recruitment Practices: Social media plays a critical role in recruitment. In 2024, 61% of HR managers acknowledged its importance in hiring processes, up from 57% in 2023.
- Marketing Strategies: Marketing departments heavily rely on social media for customer engagement and lead generation. In 2024, 58% of marketing teams reported daily use of social media for promotional activities, contributing to around USD 4 billion in digital marketing spending.
(source: pewresearch.org)
- Remote Work Communication: Remote employees use social media to maintain team communication. In 2024, 73% of remote workers in the tech and consulting sectors reported using social media.
(source: pewresearch.org)
- Security Measures: With increasing social media usage, companies focus on security. In 2023, 45% of businesses implemented measures to monitor social media access at work; this rose to 50% in 2024 to prevent data breaches and maintain confidentiality.
(source: pewresearch.org)
- Company Size and Policies: Smaller businesses are more flexible with social media use. In 2024, 68% of small companies allowed unrestricted access to social media, compared to 55% of larger corporations with stricter controls.
(source: pewresearch.org)
- Influencer Engagement: The rise of social media influencers has affected workplace dynamics. In 2024, 12% of employees reported engaging with influencers, particularly in marketing and brand management roles.
(source: pewresearch.org)
- Internal Networking Platforms: Internal networking platforms like Workplace by Facebook have seen increased adoption. In 2024, 47% of companies with over 500 employees used these platforms to improve internal communication and collaboration.
(source: pewresearch.org)
Conclusion
The landscape of social media usage in the workplace has evolved significantly, with statistics revealing both opportunities and challenges for organizations. Social Media at the Workplace Statistics show a clear trend toward increased social media integration in professional settings, with usage rates climbing to 78% in 2024. This growth is particularly pronounced among younger workers and in technology-focused industries, where social media has become essential for communication, networking, and professional development.
The future of social media usage is expected to move toward more integrated and strategic approaches to integrative platforms for the company.
Sources
FAQ.
Usage increased from 73% in 2023 to 78% in 2024
34% use it for taking mental breaks from work.
Gen Z and younger workers (27 & younger) with a 90% usage rate.
80% of companies had social media policies by 2024.
Facebook leads with 80% of workplace users.
55% spend 1-2 hours daily on social media during work hours.

Maitrayee Dey has a background in Electrical Engineering and has worked in various technical roles before transitioning to writing. Specializing in technology and Artificial Intelligence, she has served as an Academic Research Analyst and Freelance Writer, particularly focusing on education and healthcare in Australia. Maitrayee's lifelong passions for writing and painting led her to pursue a full-time writing career. She is also the creator of a cooking YouTube channel, where she shares her culinary adventures. At Smartphone Thoughts, Maitrayee brings her expertise in technology to provide in-depth smartphone reviews and app-related statistics, making complex topics easy to understand for all readers.


