Car Ownership Statistics And Facts (2025) – By Regional Analysis, Country, Sales, Brand And Trend
Updated · Sep 25, 2025


Table of Contents
- Introduction
- Editor’s Choice
- General Car Ownership Trends in the U.S.
- Top Car Population Statistics
- Condition of Owning First Car Statistics
- Car Ownership Statistics by Regional Analysis
- By Country
- By Category Breakdown
- Global Car Ownership Per Person
- By Country
- Global Car Sales Statistics
- Car Ownership Habits Across Generations
- Global Revenue of Top Car Manufacturers
- Car Ownership Statistics by Country-wise Purchase Intention
- Purchase Criteria for Car Ownership Statistics by Country (2024)
- Autonomous Car Market Statistics
- Car Ownership Statistics by Make / Brand in India
- Cost of Owning a Car Statistics
- Future Trends of Car Usage
- Global Top Car Models of 2025
- Top 10 Cheapest Cars, 2025
- Driver Death Rates by Car Type and Model
- Share of Car Owners Who Enjoy Driving
- Customer Experiences with Different Car Buying Methods
- Conclusion
Introduction
Car Ownership Statistics: In recent years, owning a car has had a big impact on the way of travelling and maintaining a lifestyle. Around the world, more and more people are buying cars as incomes rise, cities grow, and lifestyles change. Looking at car ownership statistics helps us understand how people choose to travel, what regions prefer, and how the economy is shifting.
This article on Car Ownership Statistics is not only about the number of vehicles people own, but also reflects broader changes, such as more drivers moving toward electric cars, increasing traffic issues in busy cities, and the global shift to eco-friendly transportation. All the statistical analyses and current trends from different readers can easily understand the evolution of travelling habits and how they affect businesses, governments, and daily life.
Editor’s Choice
- According to autokunbo.com, in 2025, the world is expected to have around 1.644 billion vehicles, marking a 21.8% increase over the past five years, with an average annual growth rate of about 4.4%.
- Hedges & Company estimates the global ratio of cars per 1,000 people at 203 in 2025, indicating roughly one in five individuals worldwide owns a vehicle.
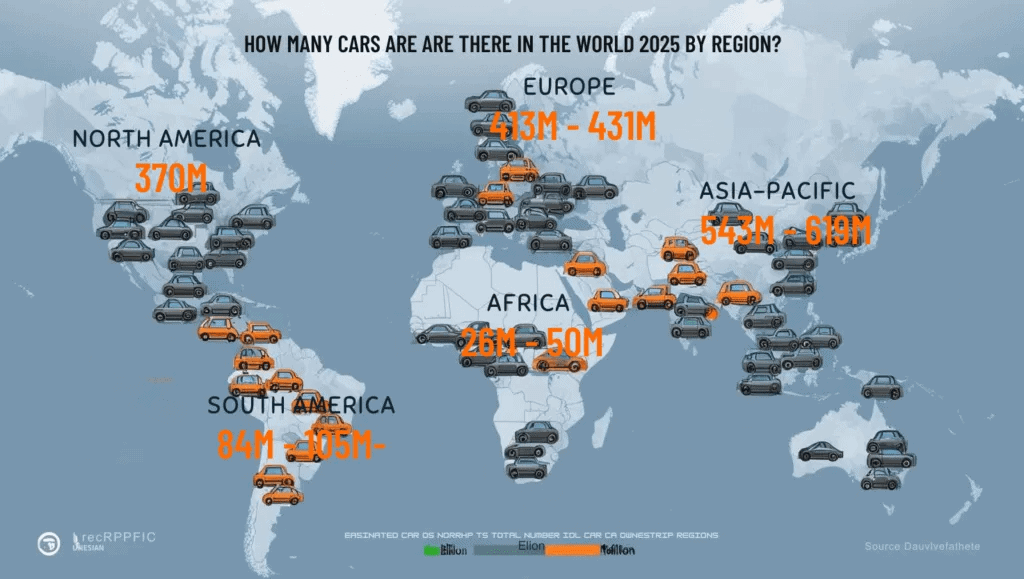
- The Asia-Pacific region had roughly 543 to 619 million cars, accounting for about one-third of the global vehicle fleet, or approximately 140 cars per 1,000 people in the region.
- As of 2024, the United States of America accounted for the largest car ownership share of 91.7%, followed by Canada (85.1%), Germany, and the United Kingdom (84.7%, each).
- As of 2025, in North America, the number of cars per 1,000 people is 860 in the United States, 707 in Canada, and 358 in Mexico, according to a report published by Visual Capitalist.
- The Statista report analysis estimated that by the end of 2025, the total number of sold-out cars is going to be around 79.4 million.
- A report published by Growth Shuttle states that in Generation Z, about 38% say they plan to hold on to their vehicles for a longer time.
- In 2024, about 21% of people in the United States purchased a new car, while 16% bought a used one.
- As of May 2024, Volkswagen Group leads the global automotive industry in revenue, generating around USD 348.6 billion.
- In 2024, the global autonomous car market was worth USD 41.1 billion and is estimated to reach almost USD 50.45 billion by 2025.
- Car use is projected to fall in North America and Europe, as the share of trips by car will be 76.1% and 44.4%, respectively, by the end of 2050.
- Millennials stand out the most, with 41% saying they love driving, followed by 37% of Gen X and 34% of Gen Z.
General Car Ownership Trends in the U.S.
- A majority of people (57%) own just one car, and 36% have had their current vehicle for one to five years, according to a report published by LanternCredit.
- More than half (52%) said they bought their car from a dealer after taking a test drive, and 59% felt they got a good deal.
- When it comes to financing, 55% were satisfied with the auto loan process, while 32% showed interest in refinancing.
- About 14% of respondents got their first car at age 16, and more than half (56%) gave their car a name.
- Finally, 48% reported that the COVID-19 pandemic did not change how much they drive.
Top Car Population Statistics
- According to autokunbo.com, in 2025, the world is expected to have around 1.644 billion vehicles, marking a 21.8% increase over the past five years, with an average annual growth rate of about 4.4%.
- ResearchAndMarkets analysis states that global new light vehicle sales are forecast to grow between 1.3% and 3.4% in 2025, with estimates ranging from 85.1 million units to 89.6 million units and 91.6 million units.
- Hedges & Company estimates the global ratio of cars per 1,000 people at 203 in 2025, indicating roughly one in five individuals worldwide owns a vehicle.
- S&P Global Mobility further reports that electric vehicles are expected to comprise 16.7% to 23.1% of light vehicle sales in 2025.
- The United States is projected to hold 17% of the world’s vehicle fleet, equivalent to around 279.5 million vehicles, while China leads in annual sales.
- The lifespan of cars varies by region: The average age of passenger cars in the US is estimated at 14.1 years in 2025, compared to 12.3 years in Europe in 2024.
- In 2024, commercial vehicles represented about 60% of fleet market share.
- Passenger vehicles form the majority of the global fleet, making up about 75% or nearly 1.23 billion units, with yearly sales expected to cross 80 million cars and light passenger vehicles (OICA, 2025).
- The rest, around 25% or roughly 411 million units, are commercial vehicles such as light vans and heavy-duty trucks.
- Daily production of new cars is expected to reach around 241,000 units, reflecting strong manufacturing demand.
- Looking ahead, the global electric vehicle (EV) fleet is projected to grow from 230 to 350 million units by 2030, and combined with traditional vehicles, the total global fleet could approach 2 billion vehicles.
Condition of Owning First Car Statistics
- A report published by thezebra.com shows that about 31.3% of people said their first car was a hand-me-down from family, while 33.3% bought an old beater on their own.
- Around 7.9% received a nicer car as a gift, and 13.9% managed to purchase a better one themselves.
- A smaller 1.8% never owned a car, and 12.2% chose none of these options.
Car Ownership Statistics by Regional Analysis
 (autokunbo.com)
- In 2025, Hedges & Company reported that the Asia-Pacific had roughly 543 to 619 million cars, making up about one-third of global vehicles, or 140 cars per 1,000 people in the region.
- Europe comes next, with 413 to 431 million vehicles, while North America (including the USA, Canada, and Mexico) has 359 million cars.
- Other regions have fewer cars in North America, with 370 million, followed by South America, accounting for 84 to 105 million, the Middle East has 50 million, and Africa has 26 to 50 million.
- Even Antarctica has about 60 vehicles, mainly used for research and transportation.
By Country
 (Reference: reddit.com)
- As of 2024, the United States of America accounted for the largest car ownership share of 91.7%, followed by Canada (85.1%), Germany, and the United Kingdom (84.7%, each).
- Furthermore, other countries’ car ownership across the world is followed as South Korea (82%), Japan (81.4%), Australia (78.2%), Israel (65.4%), UAE (38.2%), China (23.1%,) and India (7.5%).
By Category Breakdown
- The autokunbo.com report states that in 2025, passenger cars will form the largest share with over 1.2 billion vehicles.
- Light commercial vehicles (LCVs), such as vans and small trucks used in deliveries and services, make up more than 300 million units.
- Heavy-duty trucks, vital for freight and industries like mining and construction, number around 20 to 30 million, with annual sales expected at 3.5 million units
- Buses and coaches are fewer, estimated at 10 to 20 million units, while their global market size is about USD 51 billion in 2025.
- Electric vehicles (EVs) are growing fast, projected at 80 to 120 million units, or 5 to 7% of the fleet, with 16 to 23% of new sales.
- Within EVs, battery electric vehicles (BEVs) could reach 15.1 million sales, while plug-in hybrids (PHEVs) remain a transitional option.
- Autonomous cars (Level 3+) are still limited, with only about 33,570 vehicles worldwide.
Global Car Ownership Per Person
- North America has the highest vehicle ownership, with 0.71 cars per person, or 710 cars per 1,000 people.
- Europe follows with 0.52 vehicles per person (520 per 1,000 people).
- In South America, the rate drops to 0.21 vehicles per person (210 per 1,000 people), while the Middle East has 0.19 vehicles per person (190 per 1,000 people).
- Asia and Oceania have a lower ownership of 0.14 vehicles per person (140 per 1,000 people), and Africa trails with only 0.06 vehicles per person (58 per 1,000 people).
- Antarctica has the fewest, with 0.05 vehicles per person, or 50 per 1,000 people.
By Country

- As of 2025, in North America, the number of cars per 1,000 people is 860 in the United States, 707 in Canada, and 358 in Mexico, according to a report published by Visual Capitalist.
- In Europe, car ownership is generally high, with Poland leading at 761 cars per 1,000 people, followed closely by Italy (756) and France (704).
- Other countries like Czechia (658), Portugal (640), Norway (635), the United Kingdom (632), Austria (632), and Spain (627) also show strong car density, while countries such as Turkey (220) and Ukraine (192) have much lower ownership.
- In Asia, Oceania, and the Middle East, New Zealand tops the list with 869 cars per 1,000 people, followed by Australia (737) and Japan (612).
- Other countries in the region, including Malaysia (535), South Korea (458), Israel (404), and China (223), show moderate levels, while nations like India (33), Pakistan (20), and the Philippines (38) have very low car ownership.
- Argentina has the highest car ownership in Central and South America, with 311 vehicles per 1,000 people, compared to Brazil with 214, Chile with 246, and Colombia with 111. At the same time, in Africa, Libya leads at 490, followed by South Africa (176), Algeria (144), Morocco (112), Egypt (64), and Nigeria (56), showing that overall car use is much lower across the continent.
Global Car Sales Statistics
 (Reference: statista.com)
- The Statista report analysis estimated that by the end of 2025, the total number of sold-out cars is going to be around 79.4 million.
- Meanwhile, worldwide car sales grew to around 78 million automobiles in 2024, up from around 75.3 million units in 2023.
- Furthermore, the total number of car sales in the previous years is stated as 2022 (67.3 million), 2021 (66.7 million), 2020 (63.8 million), 2019 (74.9 million), and 2010 to 2019 (71.1 million).
Car Ownership Habits Across Generations
- A report published by Growth Shuttle states that in Generation Z, about 38% say they plan to hold on to their vehicles for a longer time.
- Millennials are slightly more likely, with 53% choosing to keep their cars instead of changing them quickly.
- The habit grows stronger with age, as around 61% of Generation X drivers prefer to keep their cars for longer periods.
- Baby Boomers show an even higher share, with 66% planning to continue using their current vehicles.
- The Silent Generation leads with 71% of them who would rather maintain the cars they already own than replace them.
Global Revenue of Top Car Manufacturers
 (Reference: statista.com)
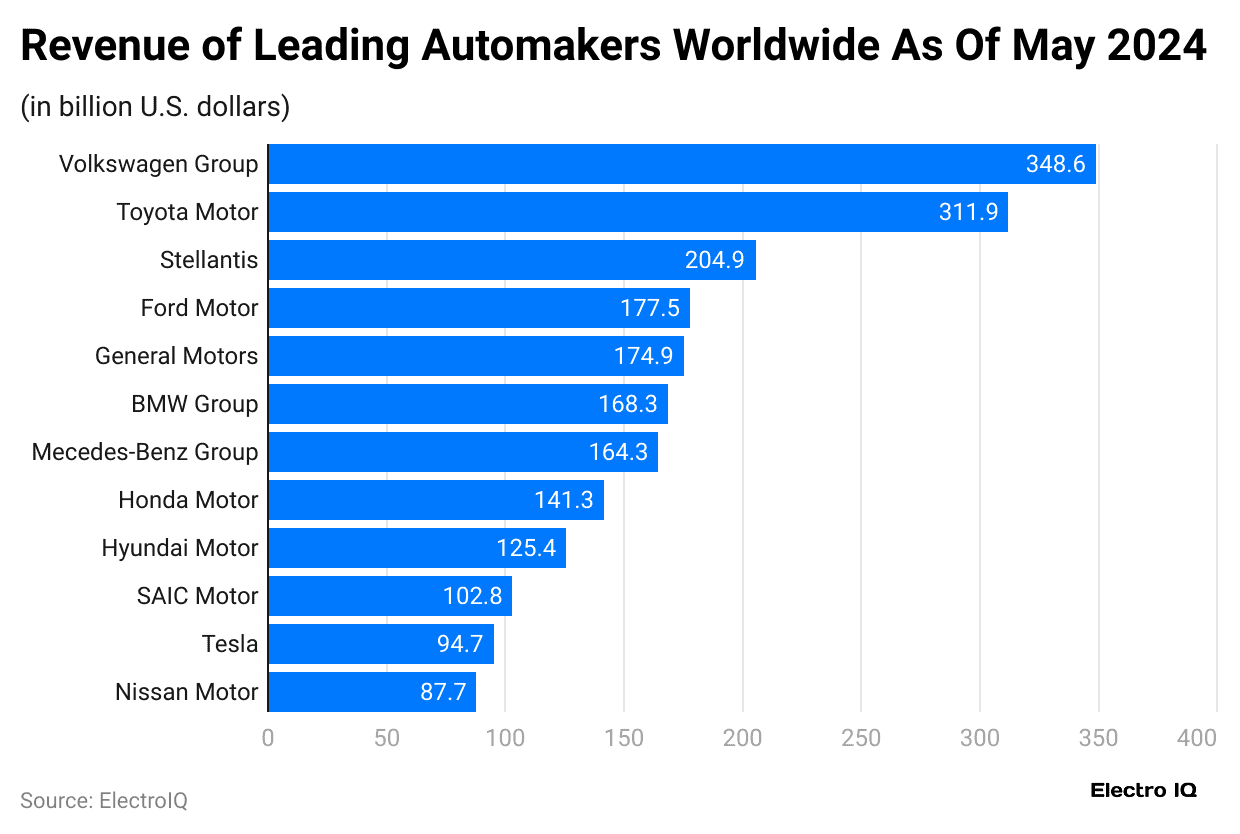
- As of May 2024, Volkswagen Group leads the global automotive industry in revenue, generating around USD 348.6 billion.
- Toyota Motor follows with USD 311.9 billion, while Stellantis ranks third at USD 204.9 billion.
- On the other side, Ford Motor and General Motors earned USD 177.5 billion and USD 174.9 billion, respectively,
- BMW Group follows other manufacturers’ revenue analyses at USD 168.3 billion and Mercedes-Benz Group ( USD 164.3 billion), Honda Motor (USD 141.3 billion), Hyundai Motor (USD 125.4 billion), SAIC Motor (USD 102.8 billion), Tesla (USD 94.7 billion), and Nissan Motor (USD 87.7 billion).
Car Ownership Statistics by Country-wise Purchase Intention

- In 2024, about 21% of people in the United States purchased a new car, while 16% bought a used one.
- Around 38% had no plans to buy, and 11% already purchased either new or used cars.
- Besides, 14% were unsure about their buying decision.
Furthermore, other countries’ analyses are stated below:
| Car Purchasing Intentions | Germany | United Kingdom |
| Share of respondents | ||
| Yes, a new car | 19% | 24% |
| Yes, a used car | 16% | 17% |
| Yes, a new/used car | 11% | 11% |
| No | 42% | 37% |
| Don’t Know | 12% | 11% |
Purchase Criteria for Car Ownership Statistics by Country (2024)
| Car Purchasing Criteria | United States | Germany | United Kingdom |
| Design | 30% | 31% | 34% |
| Environmental friendliness | 18% | 29% | 27% |
| Fuel Efficiency | 55% | 40% | 55% |
| Good Connectivity with smartphones and internet Services | 20% | 16% | 22% |
| Good driver assistance systems | 19% | 26% | 21% |
| Good multimedia system | 17% | 15% | 18% |
| Good warranty and customer service | 35% | 32% | 34% |
| High driving comfort | 38% | 38% | 43% |
| High quality | 42% | 45% | 44% |
| Low price | 47% | 38% | 40% |
| My preferred make | 21% | 20% | 20% |
| Propulsion type | 12% | 27% | 15% |
| Safety | 53% | 53% | 53% |
| Spaciousness | 30% | 27% | 30% |
| Sportyness | 13% | 19% | 11% |
| Suitability for everyday use | 41% | 47% | 47% |
| Other | 6% | 4% | 2% |
| Don’t Know | 4% | 5% | 7% |
Autonomous Car Market Statistics
 (Reference: statista.com)
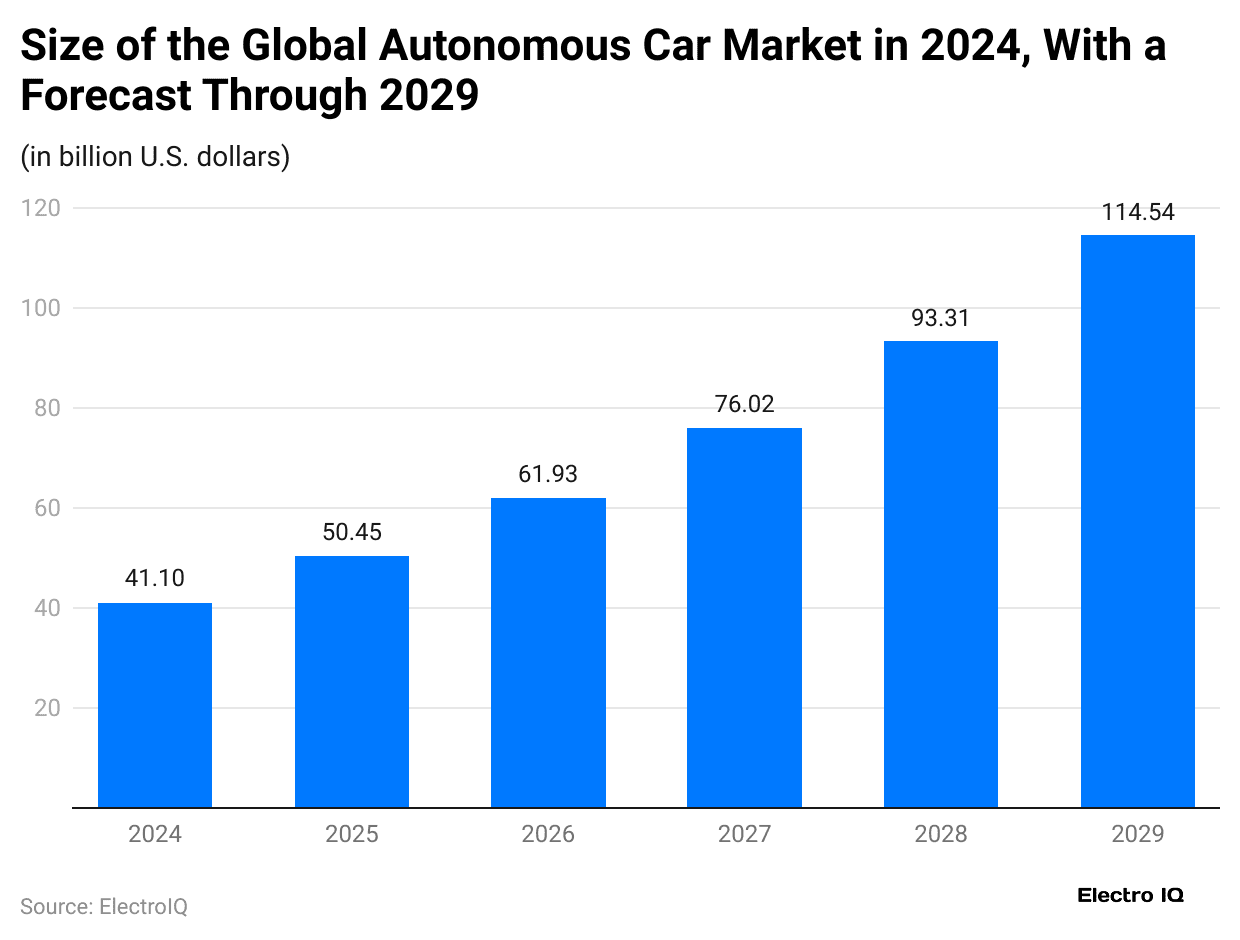
- The above Statista analysis further claimed that in 2024, the global autonomous car market was worth USD 41.1 billion and is estimated to reach almost USD 50.45 billion by 2025.
- In the coming years, the market size of the industry will grow by USD 61.93 billion by 2026, USD 76.02 billion by 2027, USD 93.31 billion by 2028, and USD 114.54 billion by the end of 2029.
Car Ownership Statistics by Make / Brand in India
| Brand | Units sold in June 2025 (Units) | Year-on-Year growth (vs June 2024) |
| Maruti Suzuki | 121,339 | −13.3% |
| Tata Motors | 65,019 | −12.3% |
| Mahindra & Mahindra | 66,654 | +12.2% |
| Hyundai India | 44,024 | −12.1% |
| Toyota Kirloskar | 26,453 | +2.7% |
| Honda | 4,618 | −3.9% |
| Kia | 20,625 | −3.2% |
Cost of Owning a Car Statistics
- In 2024, the American Automobile Association (AAA) reported that the yearly expense of owning and running a car reached USD 12,297 for 15,000 miles of driving, which was USD 115 more than in 2023.
- The biggest factor is the purchase price, with a new car averaging USD 49,740 and a used one averaging USD 25,565, based on figures from Cox Automotive and Kelley Blue Book.
- Routine costs such as servicing, fixing, and tyres added up to 10.13 cents per mile in the 2024 AAA Your Driving Costs study.
- Electric cars were the cheapest to keep up, at 7.89 cents per mile, while medium 4WD SUVs topped the list at 11.10 cents per mile.
- Insurance costs also varied: minimum-liability plans averaged USD 61 a month, and full coverage came to USD 203 monthly, according to Quadrant Information Services.
- AAA noted that small sedans were the most affordable to insure at USD 1,510 per year, while electric cars were the highest at USD 2,059 annually.
- Additional charges, including licenses, registration, and taxes, averaged USD 815 in 2024.
Future Trends of Car Usage
 (Source: statista.com)
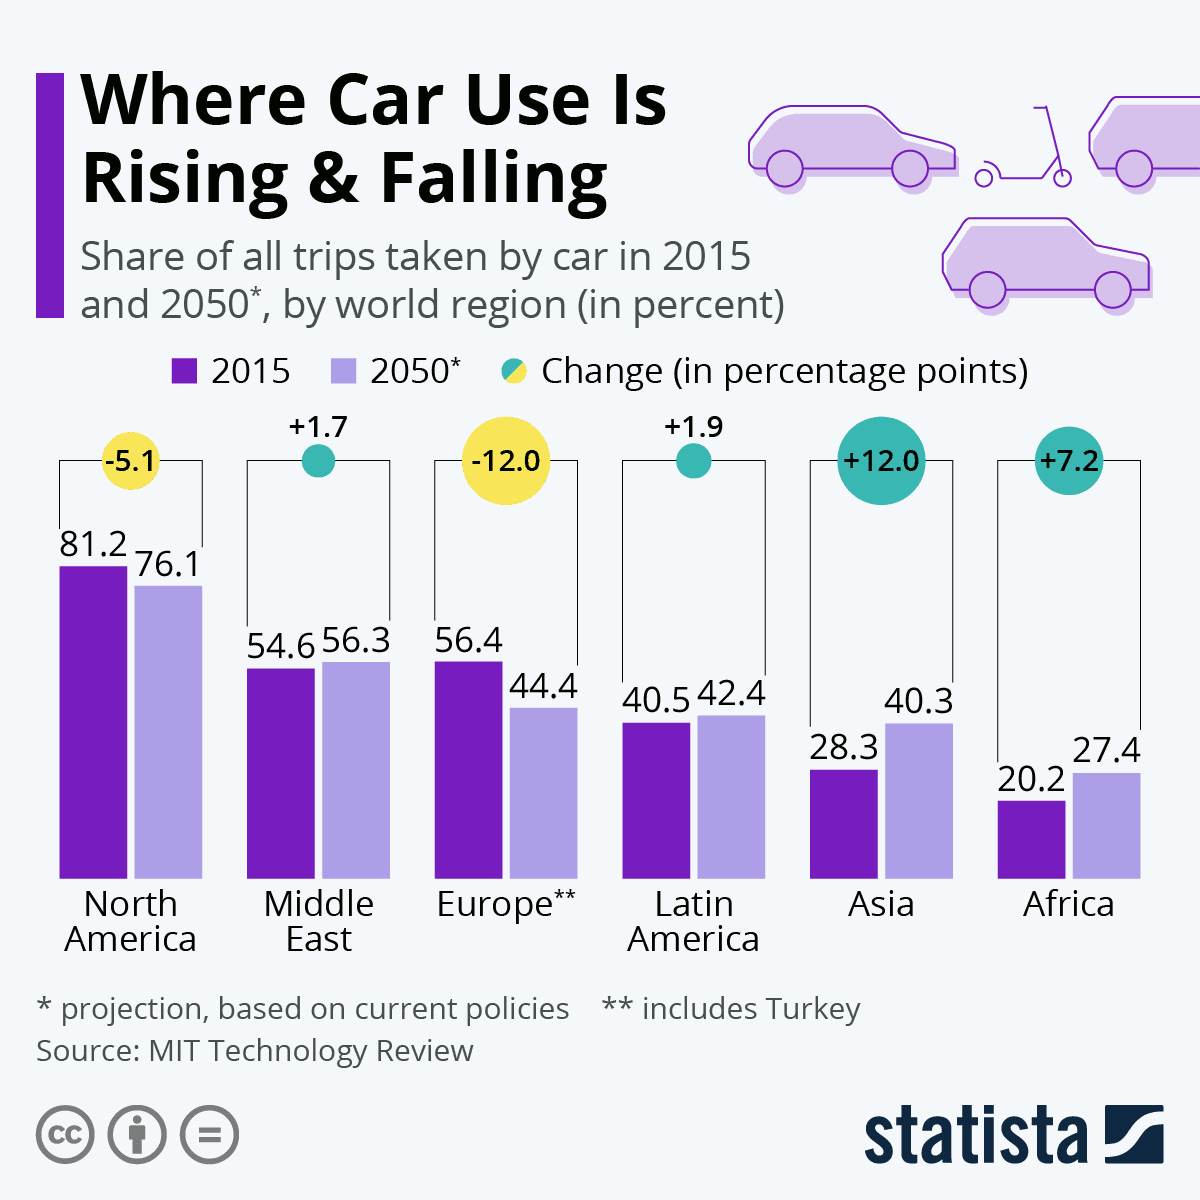
- Car use is projected to fall in North America and Europe, as the share of trips by car will be 76.1% and 44.4%, respectively, by the end of 2050.
- Meanwhile, the change in growth rate in North America will account for -5.1% from 2025 to 2050 and in Europe (-12%).
- Besides, other regional car trip shares in 2050 and change rate (from 2015 to 2050) are expected as Middle East: 56.3% (+1.7%), Latin America: 42.4% (+1.9%), Asia: 40.3% (+12%) and Africa: 27.4% (+7.2%).
Global Top Car Models of 2025
- In 2025, the world’s top-selling car was the Ford F-Series. Built for over 70 years, this pickup reached 198,557 sales by February 2025, according to finway.com.
Meanwhile, other top car models in 2025 are mentioned in the table below:
| Model Names | approximate sales and registrations (Units) |
| Toyota RAV4 | 189,392 |
| Toyota Corolla | 171,279 |
| Honda CR-V | 134,453 |
| Toyota Camry | 103,156 |
| Kia Sportage | 96,508 |
| Tesla Model Y | 95,956 |
| Hyundai Tucson | 92,329 |
| Toyota Hilux | 87,768 |
| Toyota Yaris | 84,877 |
Top 10 Cheapest Cars, 2025
| Model Names | Price (USD) |
| Nissan Versa | 20,130 |
| Nissan Sentra | 22,730 |
| Kia K4 | 23,165 |
| Hyundai Elantra | 23,370 |
| Toyota Corolla | 23,545 |
| Volkswagen Jetta | 23,720 |
| Mazda3 | 25,335 |
| Subaru Impreza | 25,530 |
| Honda Civi | 25,745 |
| Chevrolet Malibu | 26,995 |
Driver Death Rates by Car Type and Model
| Vehicle Type / Model | Deaths per Million Registered Vehicles |
| Minicars / Small cars (e.g. Ford Fiesta, Hyundai Accent, Chevrolet Sonic) | 95 to150+ |
| SUVs & Pickups | Many popular car models show 5 to 6 driver deaths, while some recent ones report none. |
| Midsize sedans / average cars | Many midsize cars from 2015 to 2018 record about 60 to 70 deaths per million vehicles. |
| Cars vs SUVs vs Pickups by crash type | Cars cause about 23 deaths in single crashes and 43 in multiple, while SUVs record 11. |
| Rollover crashes risk | Rollovers cause about 28% of pickup deaths, 24% of SUV deaths, and 16% of car deaths. |
 (Reference: ctfassets.net)
- Millennials stand out the most, with 41% saying they love driving, followed by 37% of Gen X and 34% of Gen Z.
- In contrast, only 22% of Baby Boomers say they truly enjoy it.
- On the other hand, when asked if they hate driving, just 3% of both Gen Z and Millennials agreed, compared to 7.5% of Gen X and 4.5% of Boomers.
Customer Experiences with Different Car Buying Methods
| Buying Method | Great (Got a Good Deal) | Neutral (Fair Price) | Upset (Ripped Off) |
| Car-buying app or online service | 80% | 19% | 2% |
| Private seller | 60% | 39% | 1% |
| Car dealer | 51% | 45% | 4% |
Conclusion
Car ownership continues to reflect wider social, economic, and environmental changes globally as the number of vehicles is increasing with every passing year, representing a strong demand for personal vehicles. However, the more cars adopted include challenges, such as congestion, pollution, and infrastructure pressure.
At the same time, the growing shift toward electric and sustainable vehicles shows that mobility is entering a new era. Knowing car ownership trends helps today’s businesses, governments, and communities get ready for the changes, while balancing everyday convenience with future sustainable solutions.
Sources
FAQ.
Income, city size, lifestyle, public transport availability, cultural preferences, fuel prices, and government policies influence car ownership.
Increasing car ownership leads to traffic congestion, higher pollution, rising fuel demand, and strained road infrastructure.
People own cars for convenience, personal mobility, access to work, education, social activities, and independence.
More cars lead to traffic jams, higher pollution, increased fuel use, and pressure on infrastructure.
Car ownership is highest in North America and Europe, moderate in the Asia-Pacific region, and lower in Africa.

Maitrayee Dey has a background in Electrical Engineering and has worked in various technical roles before transitioning to writing. Specializing in technology and Artificial Intelligence, she has served as an Academic Research Analyst and Freelance Writer, particularly focusing on education and healthcare in Australia. Maitrayee's lifelong passions for writing and painting led her to pursue a full-time writing career. She is also the creator of a cooking YouTube channel, where she shares her culinary adventures. At Smartphone Thoughts, Maitrayee brings her expertise in technology to provide in-depth smartphone reviews and app-related statistics, making complex topics easy to understand for all readers.


