Used Car Statistics By Revenue And Country
Updated · Oct 08, 2024
Table of Contents
- Introduction
- Editor’s Choice
- Used vs. New Car Sales Overview
- User Cars Consumer Price Index
- Monthly Used Vehicles
- Vehicle Value Index Over The Years
- Market Size of Used Car Dealers
- Used Vehicle Average Selling Price
- Leading Automation Dealers By Revenue
- Market Share Among Used Light Vehicles
- Used Car And Light Car Revenue
- Used Car Price By Vehicle Type
- Car Loan By Risk Type
- Source of Used Vehicle Dealerships
- Phasing Out Gasoline Vehicles By Country
- Used Car Industry Overview
- Conclusion
Introduction
Used Car Statistics: User car refers to vehicles that retail owners have previously used. Mostly, they are sold in various options, namely outlets and independent car dealers. If one goes through the Used Car Statistics, different aspects are based on determining the price of resold cars. Likewise, here we will discuss the essential elements involved in used cars so that readers will better understand the crucial features of used cars. Accordingly, users will get a better holistic understanding of the used cars industry.
Editor’s Choice
- Used car sales increased from 36.9 million in 2010 to 38.6 million by 2022.
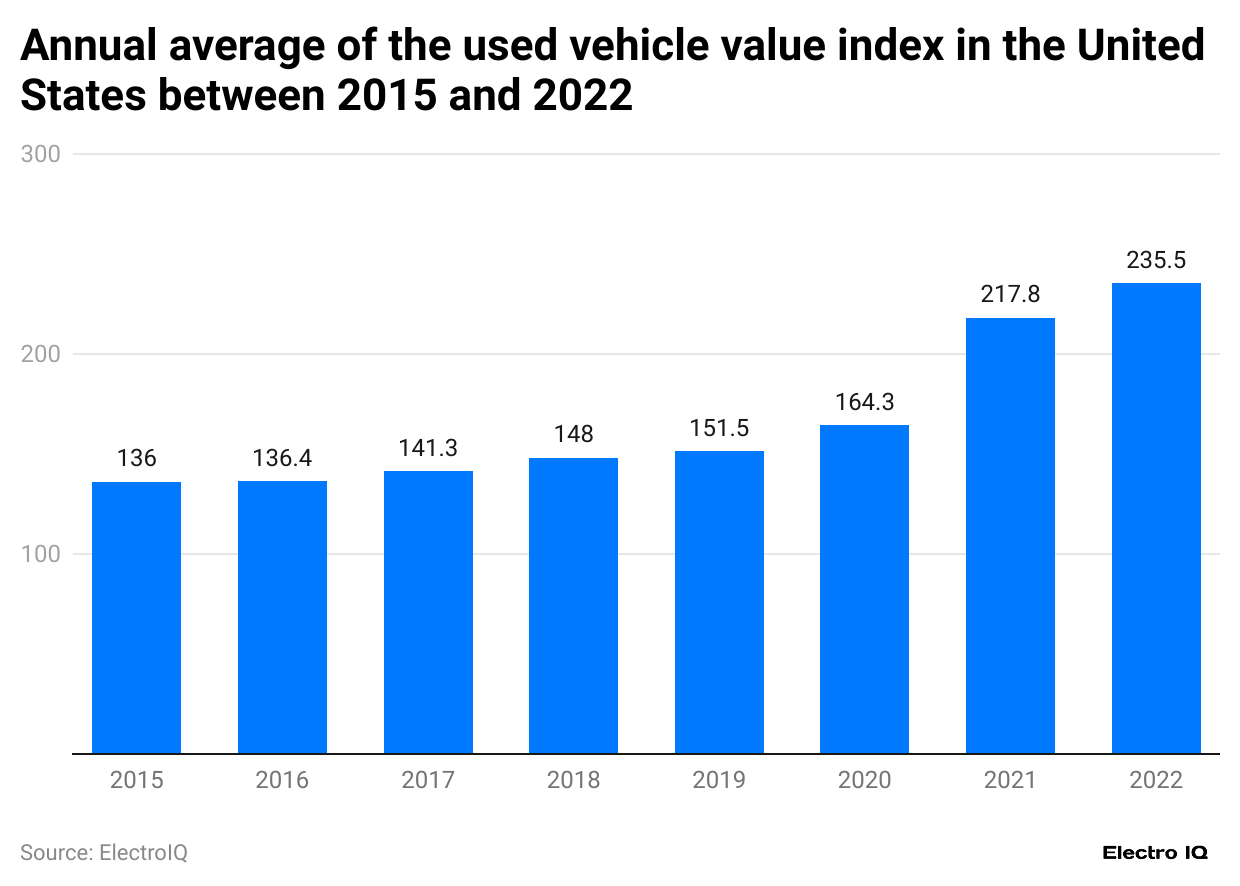
- The vehicle value index rose significantly from 136 in 2015 to 235.5 in 2022.
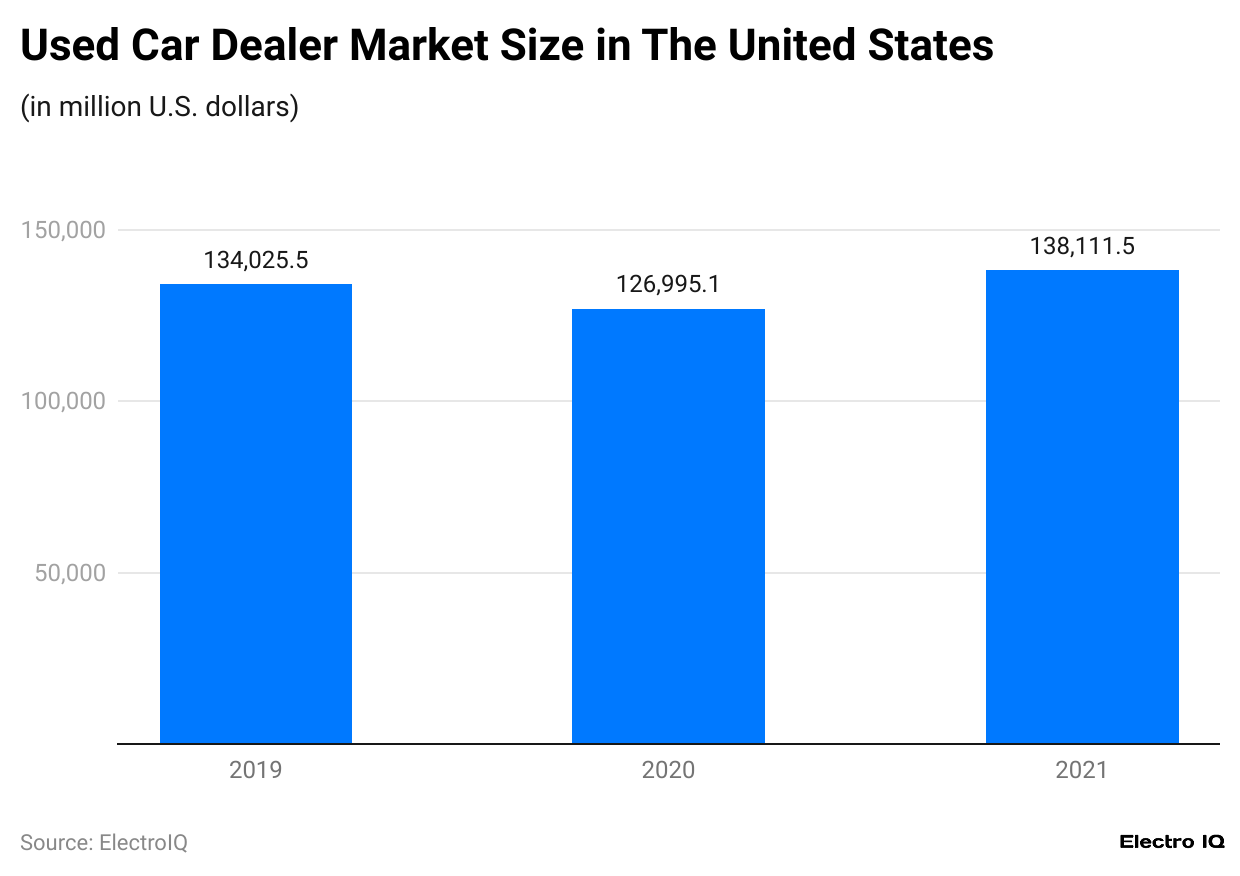
- The used car dealer market grew to $138,111.5 million by the end of 2021.
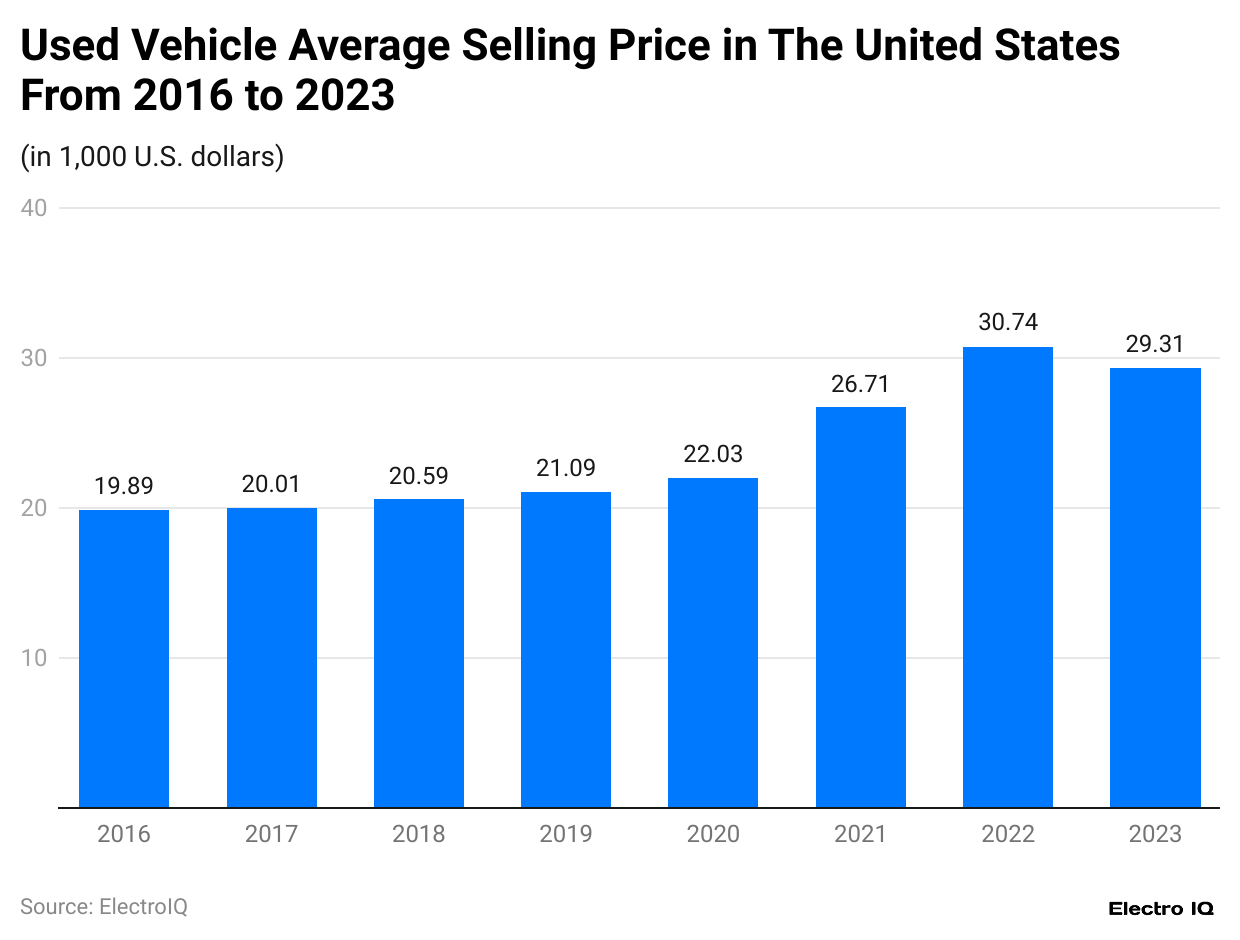
- The average used vehicle price jumped from $19.98k in 2016 to $29.31k in 2023.
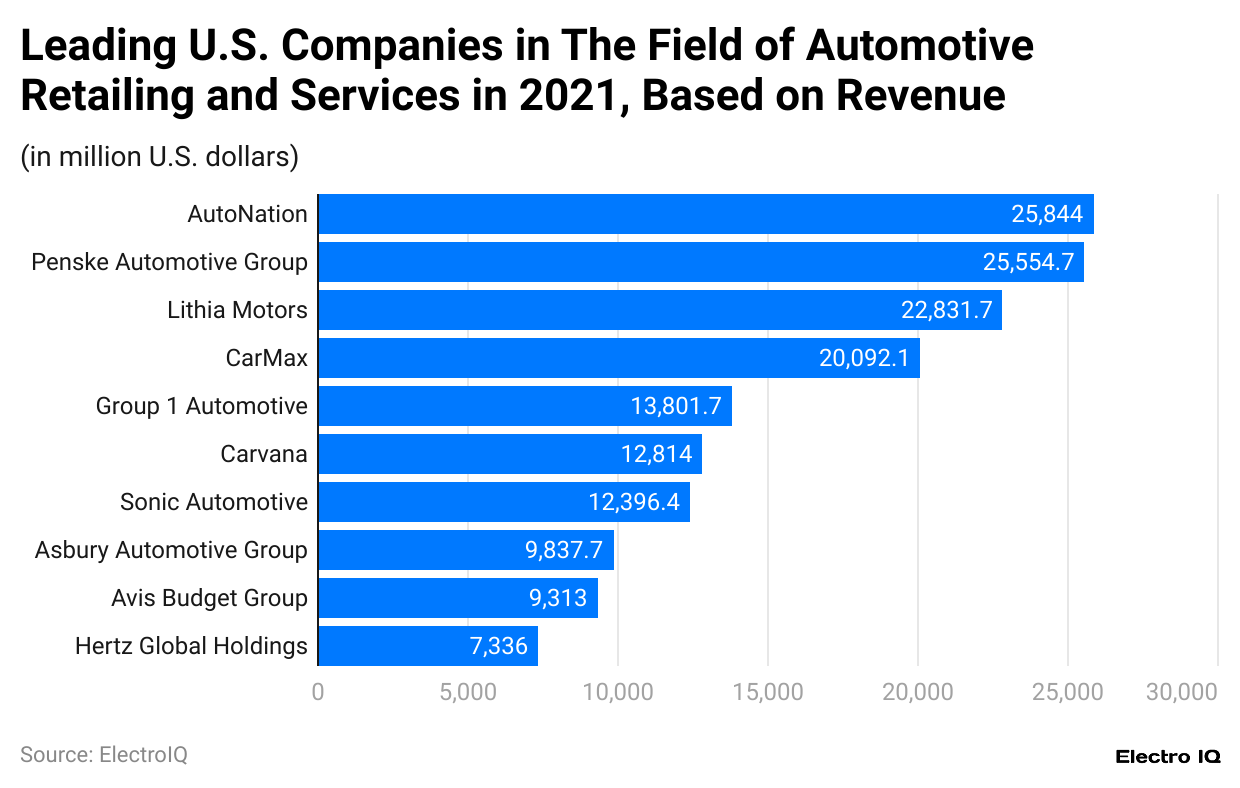
- AutoNation leads the market with $25,844 million in revenue.
- Ford F-150 holds the highest market share at 3.3% among used vehicles.
- Light trucks generated $194.75 billion in revenue by Q2 2022.
- Coupes command the highest average used price at $49,745.
- Prime loans dominate with 45.56% of car loan distribution.
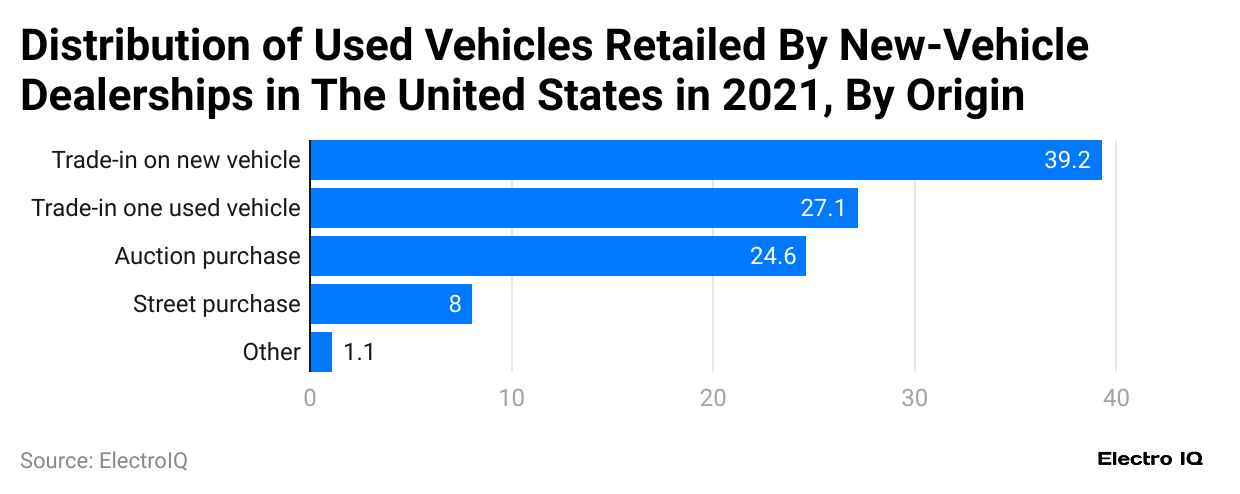
- Trade-in on new vehicles accounts for 39.2% of used vehicle sources.
Used vs. New Car Sales Overview
(Reference: statista.com)
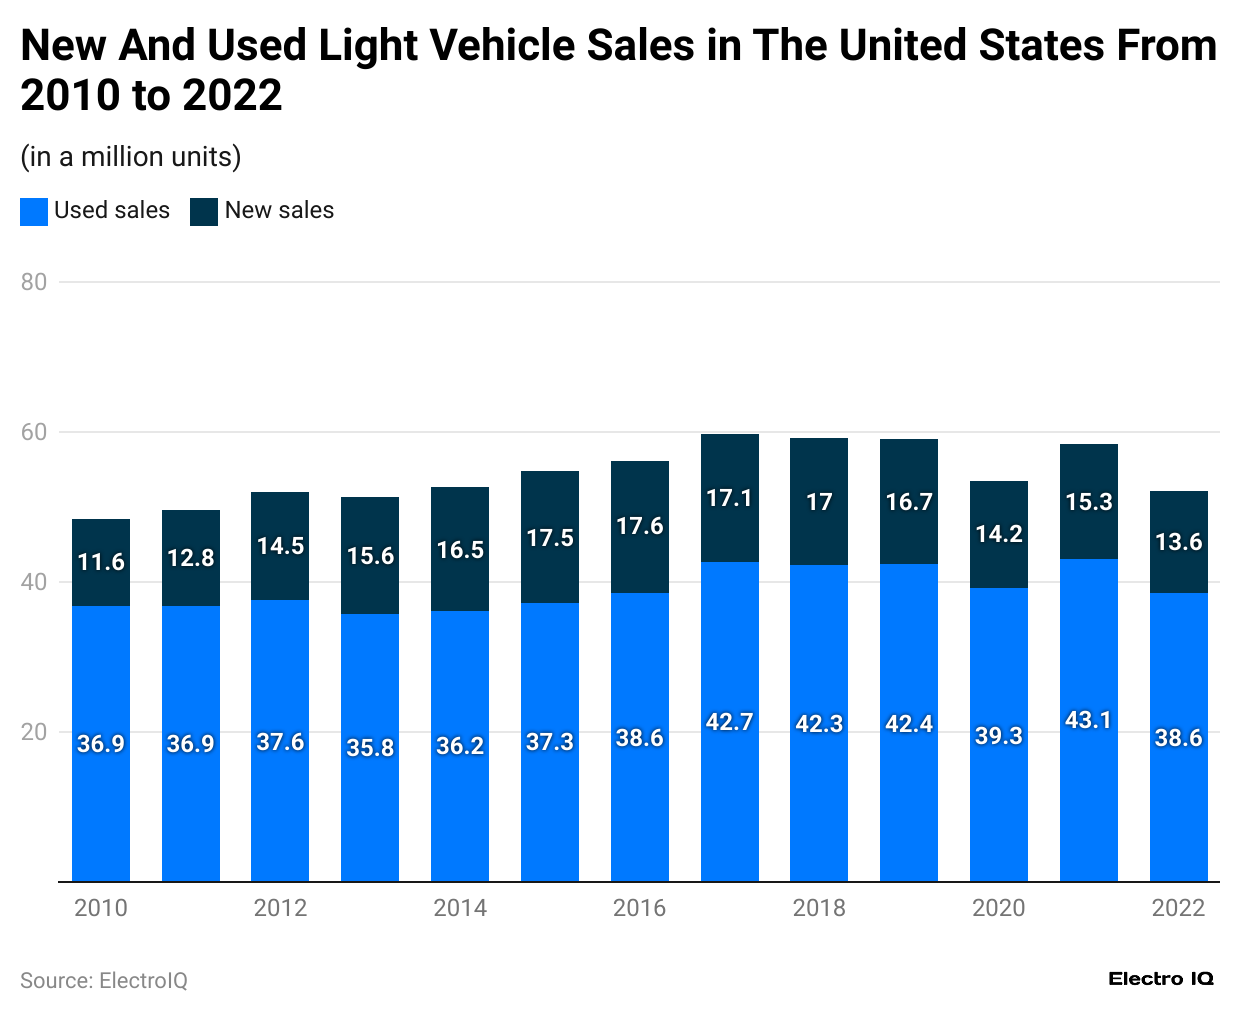
- Used Car Statistics showcase that car sales have been consistent.
- In 2010, the used car sales were 36.9 million. It has increased to 38.6 million by the end of 2022.
User Cars Consumer Price Index
(Reference: statista.com)
- The consumer price index refers to the average change in price paid by consumers in a representative market of goods and services.
- Used Car Statistics showcase that used vehicles have been consistent over time.
- Between Sep 2021 and Sept 2022, the highest month-over-month sales were recorded in Dec 2021 with 3.3%, while the lowest was in March 2022 with -3.8%.
Monthly Used Vehicles
(Reference: statista.com)
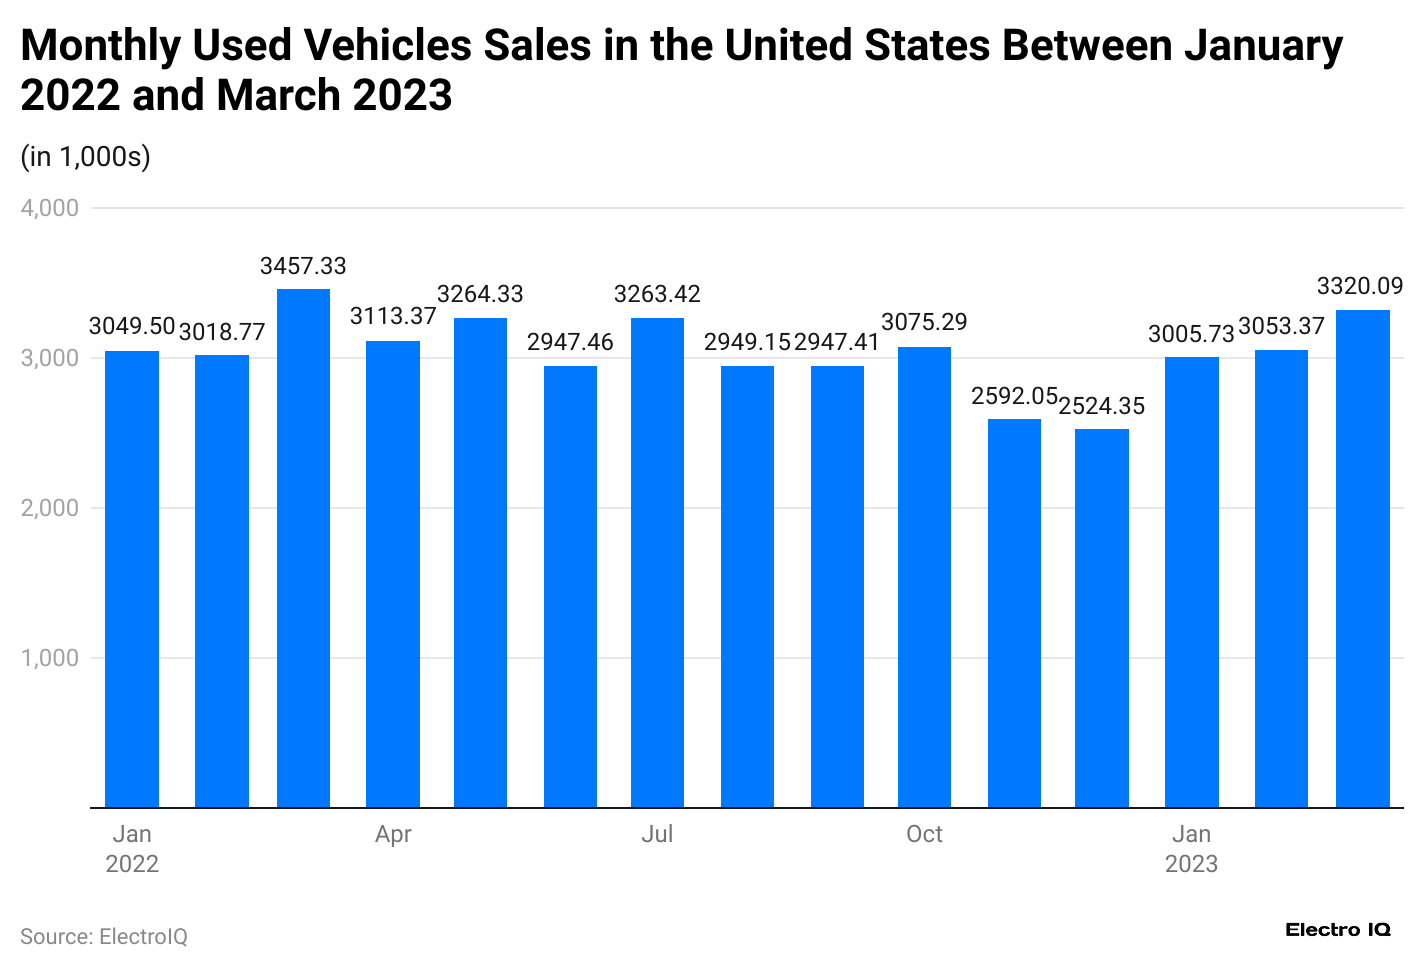
- Used Car Statistics showcase that monthly used vehicles were consistent, ranging around 3000k vehicles annually.
- Between Jan 2022 and March 2023, the highest revenue was recorded in March 2022 with 3,457.33k, and the lowest was in Dec 2022 with 2,524.25k vehicles.
Vehicle Value Index Over The Years
(Reference: statista.com)
- The vehicle value index is the price index used to determine the value of used cars.
- Used Car Statistics showcase that the value of vehicle value index is consistently rising.
- By the end of 2022, the vehicle value index was 235.5, a noteworthy rise from 136 in 2015.
Market Size of Used Car Dealers
(Reference: statista.com)
- Used Car Statistics showcase that the used car dealer market size has consistently increased.
- In 2019, the dealer market size was $134,025.5 million; it increased to $138111.5 million by the end of 2021.
Used Vehicle Average Selling Price
(Reference: statista.com)
- Used Car Statistics show that vehicles' average selling price is increasing consistently. In 2016, the used vehicle price was $19.98k it increased to $29.31k by the end of 2023.
Leading Automation Dealers By Revenue
(Reference: statista.com)
- Used Car Statistics show that AutoNation, Penske Automotive Group, Lithia Motors, CarMax, Group 1 Automotive, Carvana, Sonic Automotive, Asbury Automotive Group, Avis Budget Group, and Hertz Global Holdings are top automation dealers.
- AutoNation has the highest revenue among auto dealers with $25,844 million revenue, followed by Penske Automotive Group with $25,554.7 million revenue, Lithia Motors with $22,831.7 million revenue, CarMax with $20,092.1 million revenue, Group 1 Automotive with $13,801.7 million revenue, Carvana with $12,814 million revenue, Sonic Automotive with $12,396.4 million revenue, Asbury Automotive Group with $9,837.7 million revenue, Avis Budget Group with $9,313 million revenue, Hertz Global Holdings with $7,336 million revenue.
(Reference: statista.com)
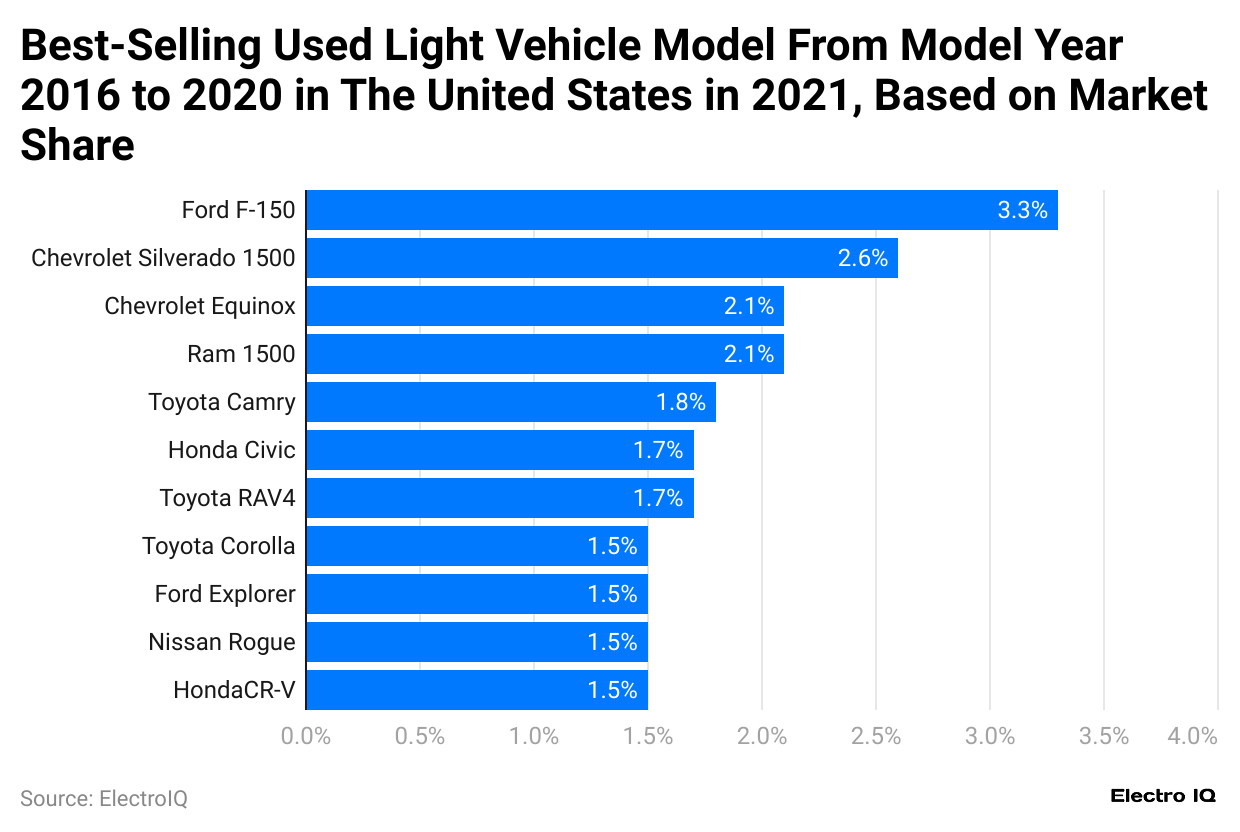
- Used Car Statistics show that Chevrolet Equinox, Toyota Corolla, Ram 1500, Ford F-150, Honda Civic, Nissan Rogue, Toyota RAV4, Ford Explorer, Honda CR-V, Toyota Camry, Chevrolet Silverado 1500
- Ford F-150 has the highest market share with 3.3% market share followed by Chevrolet Silverado 1500 with a 2.6% market share, Chevrolet Equinox with 2.1% market share, Ram 1500 with a 2.1% market share, Toyota Camry with 1.8% market share, Honda Civic with 1.7% market share, Toyota RAV4 with 1.7% market share, Toyota Corolla with 1.5% market share, Ford Explorer with 1.5% market share, Nissan Rogue with 1.5% market share, Honda CR-V with 1.5% market share
Used Car And Light Car Revenue
(Reference: statista.com)
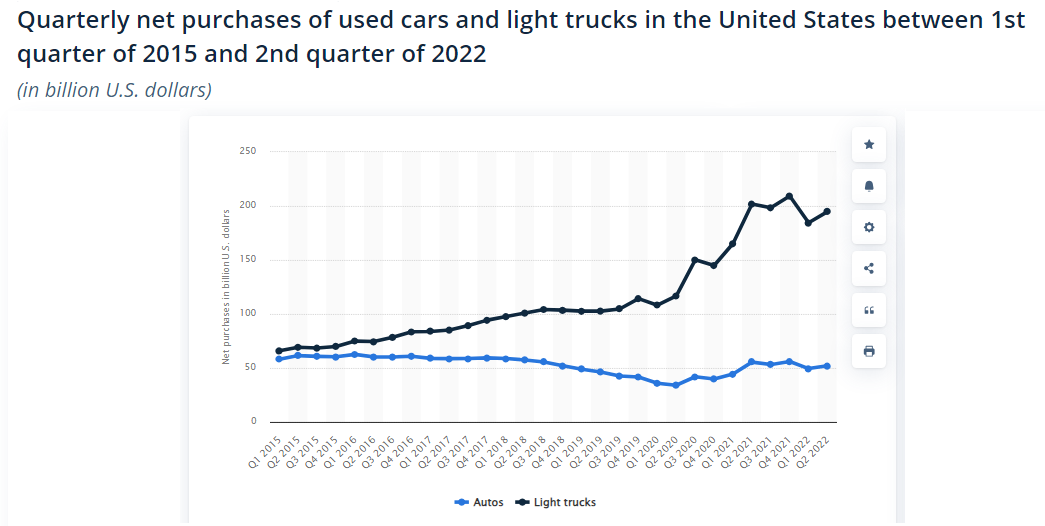
- Used Car Statistics show that the net purchase of used cars and light trucks has increased consistently.
- In Q1 2015, Autos had $58.05 billion in revenue and Light Trucks 65.89. The revenue increased in Q2 2022, with autos having $52.05 billion in revenue and light trucks having $194.75 billion in revenue.
Used Car Price By Vehicle Type
(Reference: statista.com)
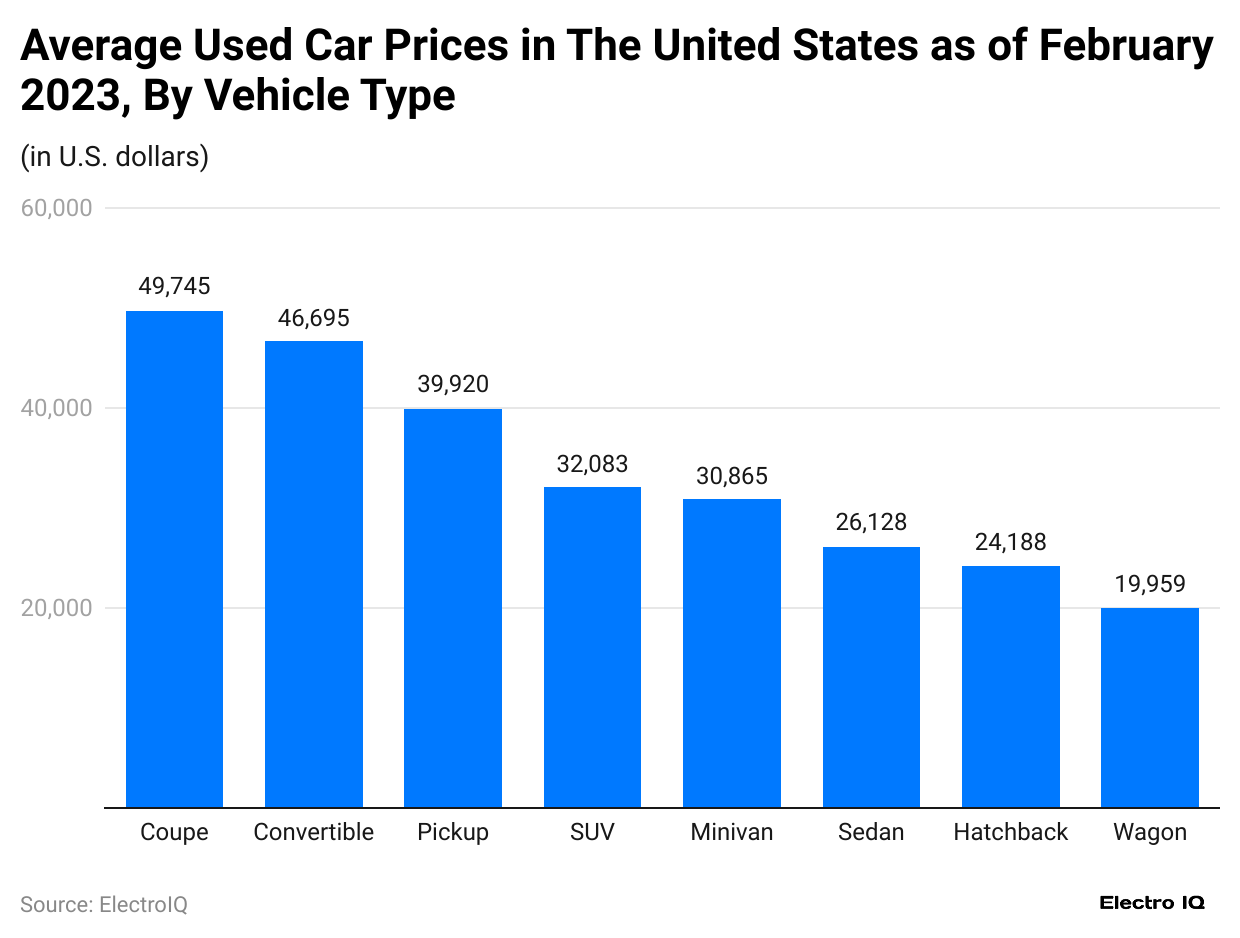
- Used Car Statistics showcase that Convertible, Minivan, Pickup, SUVs, Hatchbacks, Wagons, Coupes, and Sedans are used car categories.
- Coupe has the highest used car value with a $49,745 average price, followed by Convertible with a $46,695 price, Pickup with a $39,920 price, SUV with $32,083 price, Minivan with $30,865 price, Sedan with a $26,128 price, Hatchback with $24,188 price, Wagon with $19,959 price.
Car Loan By Risk Type
(Reference: statista.com)
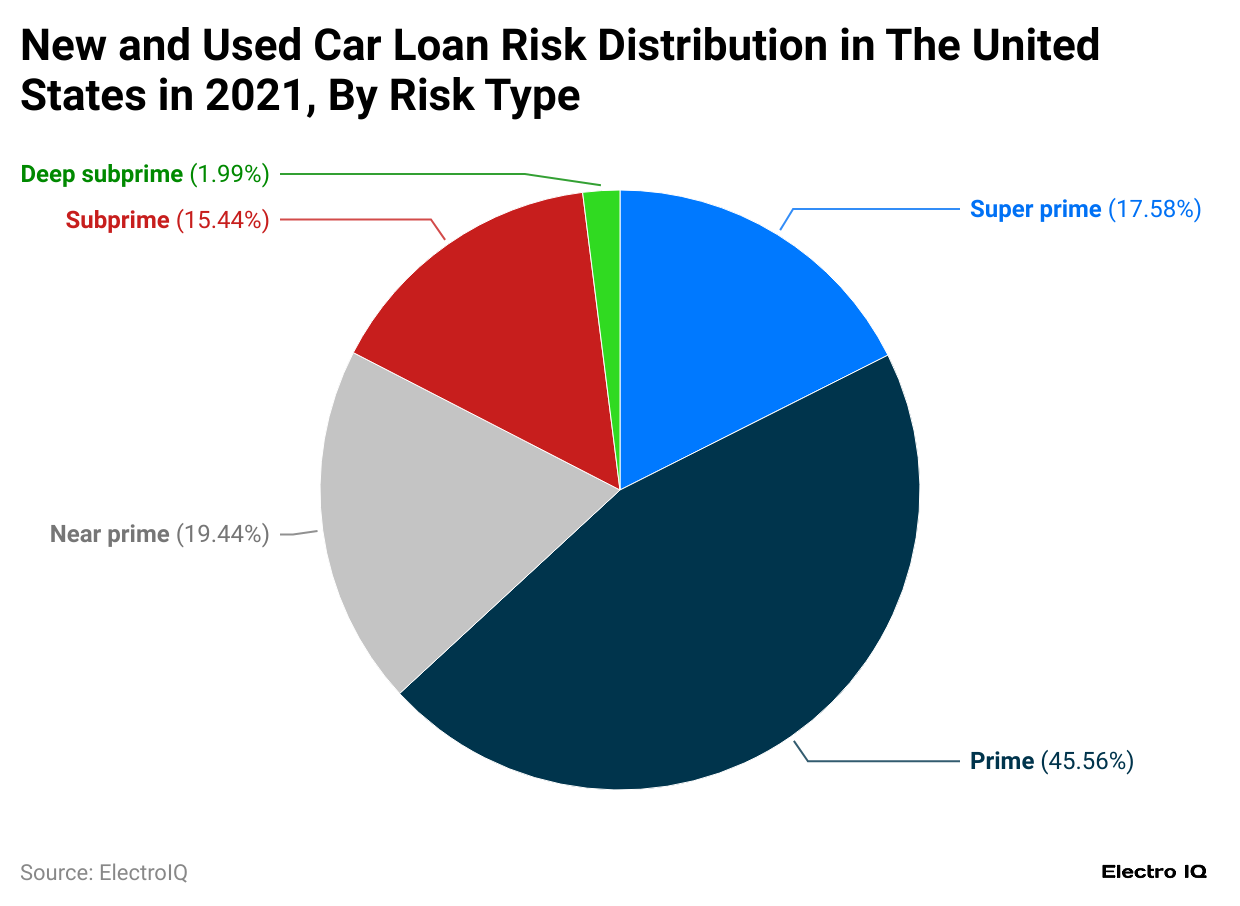
- Used Car Statistics showcase that car loan distribution can be divided into the following categories: Deep subprime, Subprime, Near prime, Prime, and Super prime.
- Prime has the highest market share among loan distribution with 56%, followed by Super prime at 17.58%, Near prime at 19.44%, Subprime at 15.44%, and Deep subprime at 1.99%.
Source of Used Vehicle Dealerships
(Reference: statista.com)
- Used Car Statistics show that when it comes to the distribution of used vehicles, the following categories are there: trade-in on new cars, trade-in on used vehicles, auction purchase, street purchase, and others.
- Trade-in on new vehicles has the highest market share with 39.2%, followed by Trade-in on used cars with a 27.1% market share, Auction purchases with a 24.6% market share, Street purchases with an 8% market share, and others with a 1.1% market share.
Phasing Out Gasoline Vehicles By Country
Countries worldwide understand the environmental harm caused by gasoline vehicles and thus plan to phase out in the following manner.
| Country | Start Year |
| Turkey | 2040 |
|
Sweden |
2030 |
| Portugal |
2035 |
|
Singapore |
2023 |
| Vietnam |
2040-2050 |
|
Netherlands |
2030 |
| Paraguay |
2040 |
|
Rwanda |
2040 |
| Italy |
2035 |
|
Spain |
2035 |
| United States |
2035 |
|
United Kingdom |
2035 |
| Thailand |
2035 |
|
Taiwan |
2040 |
| Slovenia |
2031 |
|
Norway |
2025 |
| Poland |
2035 |
|
Pakistan |
2040 |
| New Zealand |
2040 |
|
Malaysia |
2050 |
| Israel |
2030 |
|
Ireland |
2035 |
| Iceland |
2030 |
|
India |
2040 |
| Hungary |
2035 |
|
Hong Kong |
2035 |
| Holy See |
2040 |
|
Ghana |
2040 |
| Germany |
2030 |
|
Greece |
2035 |
| Ethiopia |
2024 |
|
El Salvador |
2040 |
| Egypt |
2040 |
|
Dominican Republic |
2040 |
| Denmark |
2030 |
|
Cyprus |
2035 |
| Croatia |
2035 |
|
Costa Rica |
2050 |
| People's Republic of China |
2035 |
|
Chile |
2035 |
| Cape Verde |
2040 |
|
Canada |
2035 |
| Cambodia |
2040 |
|
Belgium |
2026 |
| Austria |
2035 |
|
Azerbaijan |
2040 |
| Armenia |
2040 |
(Source: wikipedia.org)
Used Car Industry Overview
The used car market has been experiencing significant growth in recent years, with consumers and businesses increasingly turning to second-hand vehicles as a cost-effective option. In 2023, the global used car market reached approximately $1.5 trillion in US dollars. This surge is attributed to several factors, including the rising prices of new cars, the shortage of semiconductor chips, and the overall demand for affordable transportation. According to Used Car Statistics, the market is expected to continue its upward trend, with a projected growth rate of 6% by the end of 2024.
#1. Key Market Drivers in 2023
Several factors contributed to the expansion of the used car market in 2023. First, the global shortage of semiconductor chips significantly impacted the production of new cars, leading to delayed deliveries and increased prices. This pushed many consumers to consider used cars as a viable alternative. The average cost of a new car in the US rose to over $47,000 US dollars in 2023, while the average used car price was around $27,000 US dollars, making used cars a more affordable option for many buyers.
Additionally, the rise of online platforms and dealerships specializing in used car sales has further fueled market growth. Companies like CarMax, Carvana, and Vroom reported a substantial increase in their sales during 2023. Used Car Statistics indicate that online car sales grew by 15% in 2023, with online marketplaces accounting for a larger share of the overall market compared to previous years.
#2. Regional Trends in Used Car Sales
The used car market varies significantly by region. In the United States, used car sales accounted for nearly 40 million vehicles sold in 2023. The total revenue from these sales reached approximately $840 billion US dollars. The Used Car Statistics for the US market show that the demand for used cars is primarily driven by the high cost of new vehicles and the economic uncertainty many consumers face.
The used car market in Europe was valued at approximately $400 billion US dollars in 2023, with countries like Germany, the UK, and France leading the way. More than 7 million used cars were sold in Germany alone in 2023, representing a 4% increase from the previous year. In the UK, the market was similarly robust, with 6.5 million used vehicles sold. The trend toward used cars is expected to continue into 2024, with European countries forecasting a 5% growth in the used car sector.
The Asia-Pacific region is also experiencing growth in used car sales. In China, the world's largest automotive market used car sales reached approximately 18 million units in 2023, generating around $240 billion US dollars in revenue. This growth was driven by the increasing affordability of used vehicles and a shift in consumer behavior toward more sustainable and cost-effective transportation options. In 2024, the Chinese used car market is expected to grow by 8%, reflecting the country's evolving automotive landscape.
#3. Market Segmentation: Vehicle Types and Age
When examining the types of vehicles sold in the used car market, sedans and SUVs dominate. In 2023, sedans accounted for approximately 35% of used car sales globally, while SUVs represented around 30%. Pickup trucks and smaller compact cars made up the remaining share. The demand for larger vehicles, especially SUVs and pickup trucks, is higher in North America, where they are preferred for their versatility and reliability.
In terms of the age of vehicles, Used Car Statistics from 2023 reveal that cars between three and five years old are the most popular among buyers. These vehicles are typically off-lease or former rental cars and offer a good balance between price and condition. In the US, vehicles in this age range accounted for 25% of total used car sales in 2023. Cars over ten years old make up approximately 20% of sales, as they are often the most affordable but come with higher maintenance costs.
#4. Pricing Trends and Forecast for 2024
The average price of used cars has steadily risen over the past few years, which continued in 2023. As mentioned earlier, the average used car price in the US was around $27,000 US dollars, representing a 10% increase from 2022. The rising demand for used cars and limited new inventory has increased prices. Europe's average used car price was slightly lower, around $20,000 US dollars.
Looking ahead to 2024, the used car market is expected to slightly moderate prices as new car production gradually recovers. Analysts predict that used car prices will stabilize, with an expected average price of $28,500 US dollars in the US by the end of 2024. In Europe, prices are forecasted to rise by 5%, reaching an average of $21,000 US dollars.
#5. Role of Financing in the Used Car Market
Financing is critical in the used car market, especially for consumers purchasing vehicles like SUVs and trucks. In 2023, approximately 55% of all used car sales were financed, with an average loan of $22,000 US dollars. Interest rates for used car loans remained relatively stable, ranging from 4% to 6%, depending on the buyer's credit score and vehicle age.
In 2024, the availability of financing is expected to continue supporting used car sales. Lenders offer more flexible loan terms, including extended repayment periods and lower down payments to attract buyers. As interest rates are projected to rise slightly in 2024, consumers may face higher monthly payments. Still, the overall demand for financing in the used car market is expected to remain strong.
Conclusion
The used car market has demonstrated remarkable resilience and growth, evolving into a trillion-dollar industry globally. Various factors have shaped the sector, including new vehicle shortages, rising prices, and changing consumer preferences. Used Car Statistics show a clear trend toward digital transformation, with online sales growing significantly. Market dynamics show a strong preference for certain vehicle types, particularly SUVs and trucks, while financing continues to play a crucial role in facilitating purchases. The impending global phase-out of gasoline vehicles in various countries will likely reshape the used car market landscape in the coming decades.
Sources
FAQ.
The average used car price in the US was around $27,000 in 2023.
AutoNation leads with $25,844 million in revenue.
The Ford F-150 holds the highest market share at 3.3%.
Most commonly through trade-ins on new vehicles (39.2% of acquisitions).
Coupes have the highest average price at $49,745.
Approximately 55% of all used car sales were financed in 2023.

Saisuman is a skilled content writer with a passion for mobile technology, law, and science. She creates featured articles for websites and newsletters and conducts thorough research for medical professionals and researchers. Fluent in five languages, Saisuman's love for reading and languages sparked her writing career. She holds a Master's degree in Business Administration with a focus on Human Resources and has experience working in a Human Resources firm. Saisuman has also worked with a French international company. In her spare time, she enjoys traveling and singing classical songs. Now at Smartphone Thoughts, Saisuman specializes in reviewing smartphones and analyzing app statistics, making complex information easy to understand for readers.

