Agile Statistics and Facts: Adoption, Market Size & Trends (2025)
Updated · Sep 09, 2025


Table of Contents
- Introduction
- Editor’s Choice
- General Agile Statistics
- Enterprise Agile Transformation Statistics
- Agile Methodologies Statistics
- Agile Methodology Statistics By Industry
- Agile Usage Statistics by Industry
- Popularity Statistics of Agile
- Widely Used Agile Metrics Statistics
- Agile Adoption Statistics
- Agile Statistics in Software Development
- Reasons for Implementing Agile in Organisations
- Agile Effectiveness Statistics
- Agile Tools Statistics
- Positive Impacts of Implementing Agile Statistics
- Challenges of Adopting Agile Statistics
- Conclusion
Introduction
Agile Statistics: Agile has been one of the most popular development frameworks for many years. Its focus on people and teamwork has made it the top choice for several Fortune 500 companies. Agile changes the way organizations build software and handle projects by promoting flexibility, collaboration, and faster delivery.
In the last ten years, more industries have started using Agile, leading experts to study how well it works, its success rates, and the challenges teams face. Looking at Agile statistics helps businesses understand its benefits, how widely it’s adopted, and where improvements are needed, giving useful insights for better planning and decision-making in today’s fast-moving business world.
Editor’s Choice
- The enterprise agile transformation services market is expected to grow from USD 41.2 billion in 2024 to USD 48.75 billion in 2025, as mentioned in Business Research Company.
- According to run.io, in 2025, Technology leads with 27%, followed by financial services at 18%.
- Agile methodology is used most in software development (86%) and IT (63%).
- Agile teams face several challenges, with the most common being plans changing too often (33%)
- StarAgile report states that Agile development tools have grown from USD 5.7 billion in 2020 to USD 9.2 billion by 2024.
- Methodology usage among respondents: 87% Scrum, 56% Kanban, 27% ScrumBan, 20% Iterative, 13% Scrum/XP Hybrid.
- Agile usage statistics state that in 2025, Technology leads with 27%, followed by financial services at 18%.
- Research from McKinsey & Co. shows Agile teams often perform better than non-Agile ones, with 93% reporting higher customer satisfaction.
- According to Radix, adopting Agile software development helps companies manage changing priorities more effectively, with 64% of organisations.
- A report published by Simform states that around 58% of companies rely on Atlassian Jira to manage Agile projects.
- 54% of companies improved teamwork between teams, while 52% adopted agile to boost software quality.
General Agile Statistics
- runn.io shows that Agile began in the 1990s as a flexible approach for software teams, offering an alternative to traditional methods like waterfall.
- In 2001, 17 developers created the Agile Manifesto, defining its core values and 12 guiding principles.
- By the 2010s, Agile had evolved into a broader philosophy, focusing on organisation-wide agility, culture, and adaptability in all business areas.
- According to Notta’s report analysis, around 86% of marketers intend to shift part or all of their teams to Agile methods.
- In contrast, Engineering and R&D teams are adopting Agile the fastest, making up 48% of all Agile users.
- Organisations mainly adopt Agile to speed up delivery and focus on measuring business value.
- According to StarAgile, nearly 97% of organisations use Agile development methods in some form.
- Projects managed with Agile show a 75% success rate, much higher than traditional project management, which averages 56%.
- The global market for Agile development tools has grown from USD 5.7 billion in 2020 to USD 9.2 billion by 2024.
- As projects become larger, 65% of organisations now adopt a scaled Agile approach, with the Scaled Agile Framework (SAFe) being the most popular, used by 35% of companies practising scaled Agile.
Enterprise Agile Transformation Statistics
 (Source: thebusinessresearchcompany.com)
- The enterprise agile transformation services market is expected to grow from USD 41.2 billion in 2024 to USD 48.75 billion in 2025.
- The market is expected to reach USD 96.28 billion by 2029, growing at a compound annual growth rate (CAGR) of 18.5% from 2026 to 2029.
 (Reference: cloudfront.net)
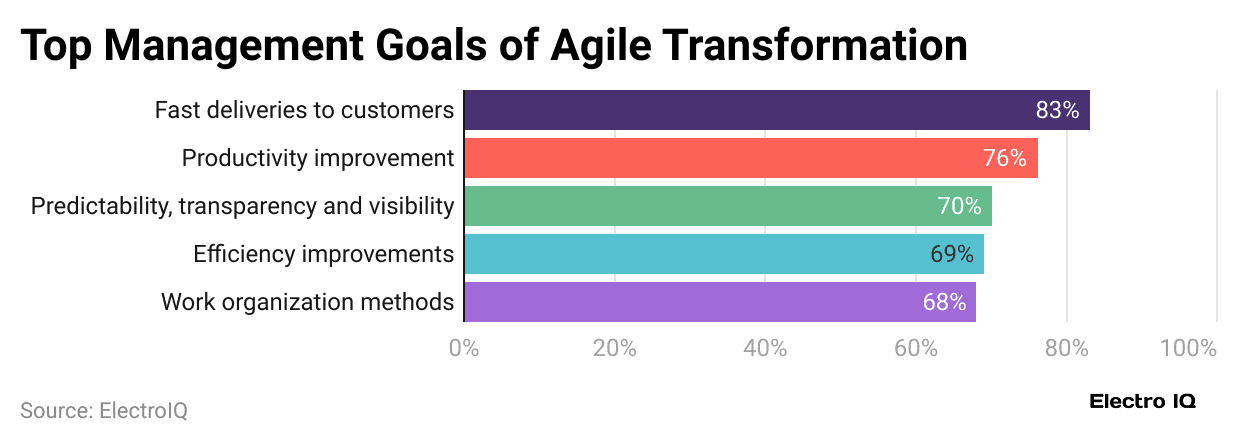
- The main goals of agile transformations are improving overall performance and delivery, with 83% prioritising faster customer deliveries and 76% focusing on productivity gains.
- Other key goals include predictability, transparency, and visibility (70%), efficiency improvements (69%), and refining work organisation methods (68%).
- According to radixweb.com, only 13% of agile survey participants said top management fully supports the transition, while 62% reported no repercussions for leaders.
- Meanwhile, 68% of agile followers felt empowered, and creating a strong agile culture can boost commercial performance by 237%.
- Among regions surveyed, Africa scored 79% for agile culture, whereas only 32% of North Americans were said to have it.
Agile Methodologies Statistics
- Agile includes various approaches, with Scrum being the most popular, as per Digital.ai’s 16th State of Agile report.
- Methodology usage among respondents: 87% Scrum, 56% Kanban, 27% ScrumBan, 20% Iterative, 13% Scrum/XP Hybrid.
- Other methods: 10% Lean Startup, 7% XP, 12% other approaches, 2% none.
- A report published by run.io states that Agile methodology is used most in software development (86%) and IT (63%).
- Followed by operations (29%), marketing (17%), security (17%), HR (16%), sales (11%), finance (10%), and hardware development (10%).
- docs.broadcom.com states that teams following full Scrum practices achieved around 250% higher quality than those skipping estimates; using retrospectives boosted quality 42% and responsiveness 24%, while 85% reported better work-life quality.
- According to the 2022 State of Kanban Report, 87% think Kanban works better than other Agile methods, and 86% plan to use it more next year.
- com reported that SAFe teams had 20% higher release effectiveness than waterfall, 55% fewer help desk tickets, 27% higher employee satisfaction, and improved collaboration (71%), dependency management (68%), and transparency (66%).
Agile Methodology Statistics By Industry
| Industry | Adoption Rate | 2024, Annual Spending (USD) | Benefits / Impact |
| Technology | 80% | 1.5 billion |
25% faster project completion, 30% higher customer satisfaction. |
|
Finance |
60% | 1 billion | 20% productivity increase. |
| Healthcare | 50% | 800 million |
15% faster project completion, 25% better regulatory adaptability. |
|
Government |
45% | 700 million | 18% efficiency improvement, 10% higher citizen satisfaction. |
| Manufacturing | 40% | 500 million |
15% productivity increase, faster market response. |
|
Insurance |
55% | 600 million | 20% reduction in time-to-market. |
| Telecoms | 65% | 900 million |
20% faster service delivery. |
|
Transportation |
40% | 500 million | 15% operational efficiency, 10% fewer project delays. |
| Energy | 35% | 400 million |
18% faster project completion. |
|
Retail |
50% | 600 million | 15% faster product launches, 22% higher customer satisfaction. |
| Education | 30% | 300 million |
15% faster project completion, 10% program effectiveness. |
Agile Usage Statistics by Industry
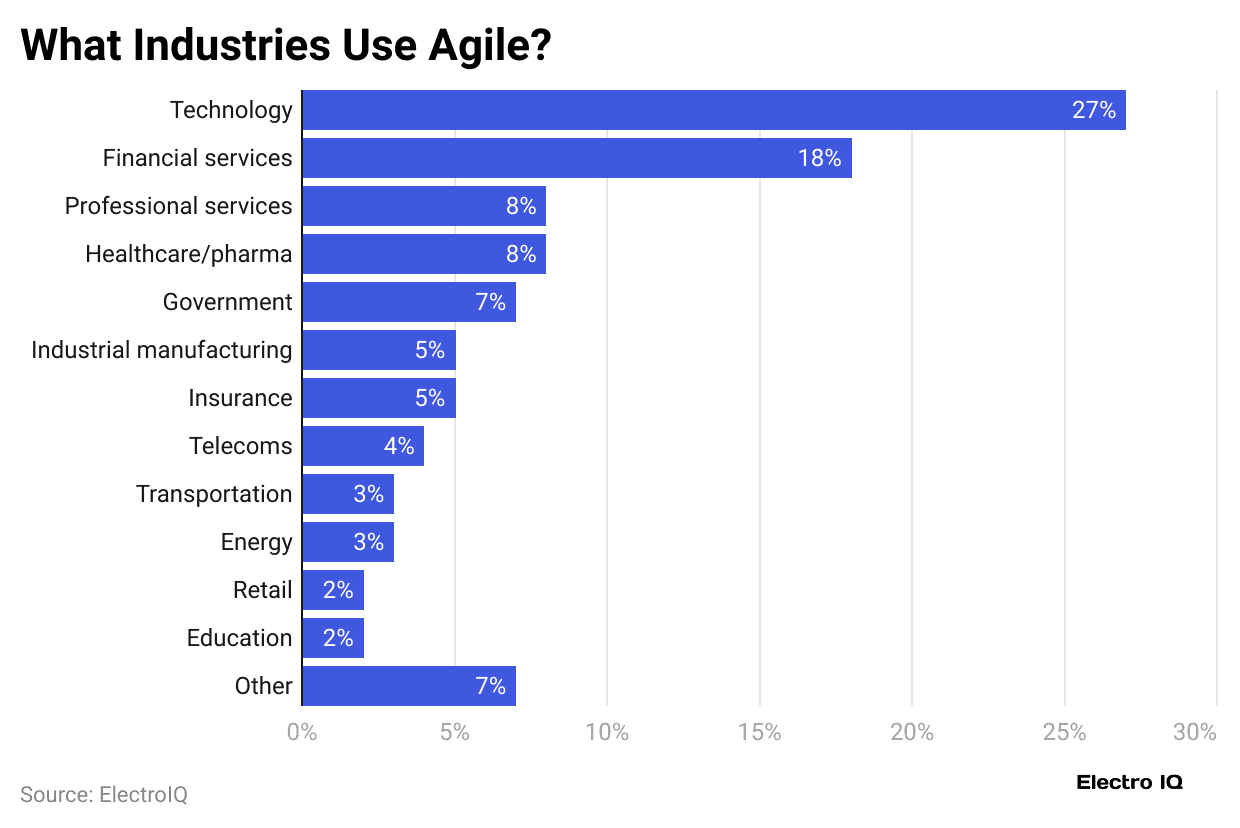
- The chart shows Agile usage statistics states that in 2025, Technology leads with 27%, followed by financial services at 18%.
- Professional services and healthcare/pharma both account for 8%, while government represents 7%.
- Industrial manufacturing and insurance each contribute 5%, and telecoms make up 4%.
- Transportation and energy account for 3% each, retail and education for 2%, and other industries collectively represent 7%.
Popularity Statistics of Agile
- runn.io shows that Agile Sherpas found many marketers are interested in Agile, with 42% planning to start using it within a year.
- ai reported that software professionals adopt Agile mainly to handle changing priorities (64%), speed up software delivery (64%), and boost team productivity (47%).
- Organise Agile highlighted key benefits: better flexibility (83%), improved financial results (68%), and a more open, productive culture (61%).
Widely Used Agile Metrics Statistics
- According to The data shows that the most commonly used Agile metrics are cycle time (66%), velocity (61%), and work in progress (53%).
- Metrics like sprint burndown (47%), happiness (42%), cumulative flow (40%), lead time (37%), and throughput (37%) are also frequently tracked.
- Less commonly used metrics include escaped defect rate (16%), blocked time (13%), Net Promoter Score (11%), and other measures (3%).
Agile Adoption Statistics
- According to Radix, adopting Agile software development helps companies manage changing priorities more effectively, with 64% of organisations reporting improvements in this area.
- As of 2024, around 47% of companies noticed better communication and teamwork between IT and business teams after using Agile.
- About 42% of respondents said software product quality improved significantly, and 47% experienced higher team productivity.
- Using an Agile enterprise architecture framework also helped 41% of companies predict software deployment more accurately.
- In addition, 40% of organisations observed greater project transparency across departments through Agile practices.
- Nearly 94% of organisations have practised Agile for 1 to 5 years, with 33% specifically using it for 3 to 5 years.
- Only 4% of companies have not yet implemented Agile.
- About 65% of companies have used Agile for at least 3 years, while 29% have 1 to 2 years of experience.
Agile Statistics in Software Development
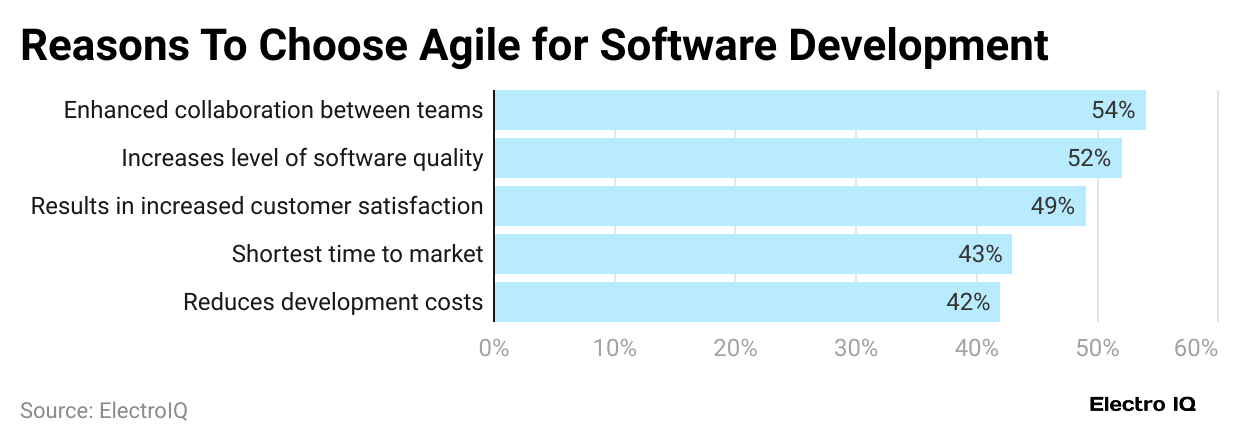 (Reference: simform.com)
- 54% of companies improved teamwork between teams, while 52% adopted agile to boost software quality.
- Almost 49% noticed better customer satisfaction, 43% aimed to speed up delivery, and 42% wanted to cut development costs.
Reasons for Implementing Agile in Organisations
- A report published by Echometer states that 64% of organisations are adopting Agile to increase their capability to handle changing priorities, while another 64% accelerating software deployment.
- Meanwhile, 47% improved communication between business and IT and 47% increase in team productivity.
- Furthermore, other reasons are followed as an increase in product quality (42%), improvement in predictability of software deployment (41%), and improved project transparency (40%).
Agile Effectiveness Statistics
- Research from McKinsey & Co. shows Agile teams often perform better than non-Agile ones, with 93% reporting higher customer satisfaction.
- Followed by 76% seeing stronger employee engagement, and 93% experiencing improved operations.
- CA Technologies found that Agile teams fully using Scrum deliver 250% higher quality than teams without proper estimation.
- Scrum Alliance reports that 78% of Scrum users would recommend it.
- Success is measured by 47% through on-time delivery and 44% by achieving business goals.
- JCURV notes that a strong Agile culture can increase engagement and commercial results by 237%.
Agile Tools Statistics
- A report published by Simform states that around 58% of companies rely on Atlassian Jira to manage Agile projects.
- Microsoft Excel follows with 46% usage, while both Microsoft Project and TFS are used by 21% of organisations.
- Furthermore, others agile management tools used by share of companies arefollowed as VersionOne (20%), Google Docs (17%), HP Quality Center/ALM (14%), CA Agile Central (9%), In-house/home-grown (8%), IBM Rational Team Concert (6%), Bugzilla (4%), LeanKit (4%), Pivotal Tracker (2%), CollabNet TeamForge (2%)HP Agile Manager (2%), Axosoft (1%), Target Process (1%), ThoughtWorks Mingle (1%), and Hansoft (1%).
Positive Impacts of Implementing Agile Statistics
- As of 2024, almost 98% of businesses that have adopted Agile have achieved a higher success rate.
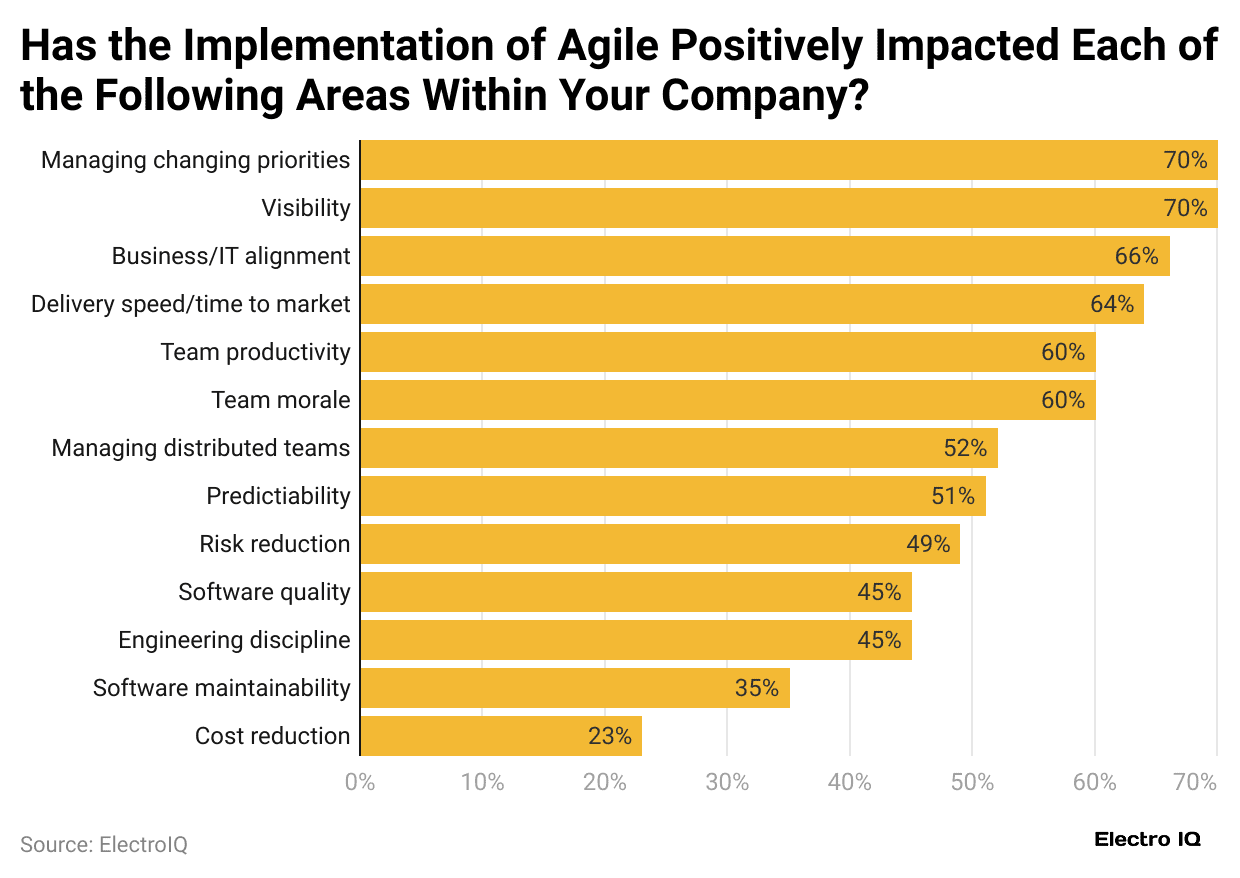 (Reference: cloudfront.net)
- The top three positive impacts of implementing Agile within businesses in 2024 were managing changing priorities (70%), visibility (70%), and business/IT alignment (66%).
- Furthermore, other impacts include delivery speed (64%), team productivity (60%), team morale (60%), managing distributed teams (52%), predictability (51%), risk reduction (49%), software quality (45%), engineering discipline (45%), software maintainability (35%), cost reduction (23%).
Challenges of Adopting Agile Statistics
- Agile teams face several challenges, with the most common being plans changing too often (33%).
- Other major issues include team members reverting to old, non-Agile methods (29%) and difficulty handling unplanned work (28%), along with problems in effective capacity planning.
- Employees unhappy with Agile practices cited legacy systems needing mixed approaches (42%), inconsistent use across teams (40%), and conflicts with company culture (40%) as key reasons.
- McKinsey found that 46% of teams ensure full utilisation during sprint planning.
Conclusion
After completing the article, it can be concluded that in recent years, Industries are increasingly adopting Agile methodology to boost flexibility, accelerate project delivery, and enhance team collaboration. Sectors like technology, finance, healthcare, and retail are allowing better productivity and customer satisfaction.
As in recent years, global companies are increasing their investments in Agile, thus resulting in more innovation, enhancing operational performance, and fostering adaptability, helping organisations stay agile and maintain a strong competitive position in a rapidly evolving market.
Sources
FAQ.
The five pillars are customer focus, collaboration, adaptability, iterative delivery, and continuous improvement to ensure project success.
This suggests keeping meetings under 3 minutes for updates, 5 minutes for discussion, and 3 minutes for decisions.
Agile differs from traditional methods by using iterative cycles, continuous feedback, flexibility, and collaboration instead of rigid, linear processes.
It works best for projects needing flexibility, frequent updates, and collaboration, but not fixed plans.
Implementing Agile varies by organisation size and culture, but noticeable improvements usually appear within six months.

Maitrayee Dey has a background in Electrical Engineering and has worked in various technical roles before transitioning to writing. Specializing in technology and Artificial Intelligence, she has served as an Academic Research Analyst and Freelance Writer, particularly focusing on education and healthcare in Australia. Maitrayee's lifelong passions for writing and painting led her to pursue a full-time writing career. She is also the creator of a cooking YouTube channel, where she shares her culinary adventures. At Smartphone Thoughts, Maitrayee brings her expertise in technology to provide in-depth smartphone reviews and app-related statistics, making complex topics easy to understand for all readers.