Business Jet Statistics By Revenue, Profit/Loss, EBIT Margin And Brand Value
Updated · Sep 19, 2024
Table of Contents
- Introduction
- Editor’s Choice
- Global Air Traffic Worldwide
- Revenue Of Cargo Airlines
- Profit/Loss of Airline Companies Worldwide
- The EBIT Margin Of Commercial Airlines
- Annual Growth Of Traffic With Passenger Demand
- Number Of Scheduled Passengers Boards In The Global Airline Industry
- Revenue Per Kilometer Of Commercial Airlines By Region
- Air Cargo Traffic Volume
- Cargo Load Changes In Commercial Airlines
- Leading Airlines By Brand Value
- Leading Airline By Passengers
- Passengers Kilometers Flown Worldwide
- Leading Airport By International Passenger Air Traffic
- Aircraft Hull Loss Per Region
- Number Of Worldwide Air Traffic Fatalities
- Business Jet Industry Overview
- Conclusion
Introduction
Business Jet Statistics: A business jet is an aircraft designed to transport groups of business executives to different destinations. It typically focuses on high-ranking individuals who must travel frequently as part of their business requirements. For the most part, business jets are designed to be quicker and have more comfortable seating than general aircraft.
Large corporations, government agencies, VIPs, and the military usually use them. It would be interesting to review the business jet statistics and garner essential information about this lucrative form of commercial transportation.
Editor’s Choice
- The North American business jet market was valued at USD 16 billion in 2023.
- China Southern is the leading airline group worldwide with 96.85 million passengers.
- Global air traffic revenue reached $522 billion by the end of 2023.
- The worldwide EBIT margin for commercial airlines was -2.7% in 2022.
- 3,781 million passengers were scheduled to board flights worldwide by the end of 2022.
- Air cargo traffic volume reached an all-time high of 65.6 million metric tons in 2021.
- Atlanta’s ATL airport leads in international passenger traffic with 104.65 million passengers.
- Delta Airlines has the highest brand value among airlines at almost USD 11 billion.
- The Africa region had the highest aircraft hull loss per one million flights in 2015 at 3.51.
- American Airlines leads in passenger-kilometers flown with 124 billion km.
- The Asia-Pacific business jet market is experiencing the fastest growth, with a 12.5% rate in 2024.
- In 2023, North America was the only region with a profit in the airline industry, at USD 9.9 billion.
- Worldwide cargo airline revenue peaked at USD 175 billion between 2004 and 2022.
Global Air Traffic Worldwide
(Reference: Statista.com)
- As previously mentioned, the usage of business jets has significantly impacted air transportation.
- As expected in business jet statistics, air traffic saw a significant dip in 2020, at $189 billion, primarily due to covid pandemic lockdowns.
- By the end of 2023, the worldwide revenue of passengers in air traffic reach $522 billion.
- Between the period (2005 and 2023), the revenue had an all-time high of $607 billion.
Revenue Of Cargo Airlines
(Reference: Statista.com)
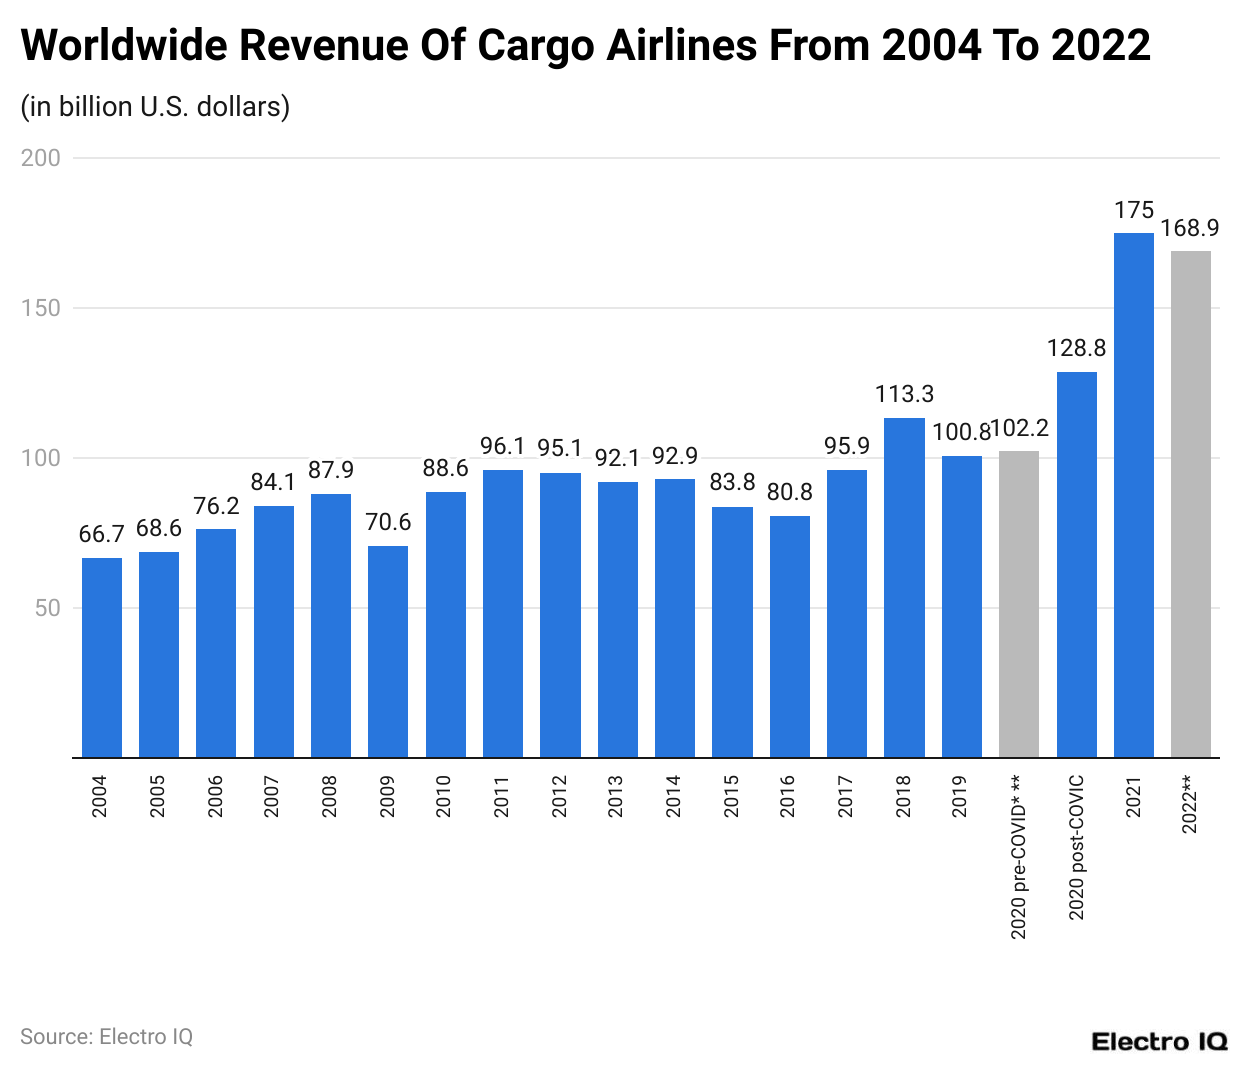
- Courier companies such as FedEx and DHL are known to use cargo-based airline wings to accumulate their operations.
- The business jet statistics showcase that between the period (2004 to 2022), the worldwide revenue reached a peak of $175 billion.
- By the end of 2022, the company had attained revenue of $168.9 billion.
Profit/Loss of Airline Companies Worldwide
(Reference: Statista.com)
- The economic performance of commercial airlines is in tandem with the performance of business jets; hence, it is vital to understand the financial performance of different modes of air travel.
- As shown in business jet statistics, the revenue since covid has been almost negative in all regions.
- As of 2023, except for North America with a profit of $9.9 billion, the reaming of regions showed a loss, namely Europe with $9.2 billion loss, Asia Pacific with $2.4 billion loss, Middle East with $4.6 billion loss, Latin America with $3.7 billion loss, Africa with $1.5 billion loss resulting in overall worldwide loss of $11.6 billion loss.
The EBIT Margin Of Commercial Airlines
(Reference: Statista.com)
- One can obtain a holistic overview of their global performance by examining commercial airlines’ EBIT margins.
- According to the business jet statistics until 2020, in the COVID era, the worldwide EBIT margin was 5.5%, comprising North America at 9.1%, Europe at 5.3%, the Asia Pacific at 4.7%, Latin America at 3.7%, Africa at 1.1%, and the Middle East with -4.2% growth overall.
- As expected during COVID, the worldwide revenue reduced, and the EBIT margin became negative, as showcased in the graph with Latin America with a 34% loss, Europe with a 32% loss, North America with a 32% loss, Asia Pacific with a 28% loss, Africa with 22% loss, Middle East with 21% loss resulting in overall worldwide loss of 30%.
- Since then, in 2022, there have been signs of recovery. However, it is still far from COVID levels, as showcased with only North America showing 4.8% profit while the rest of the regions are as follows: Africa with 9.9% loss, Latin America with 9.7% loss, the Middle East with 9.6% loss, the Asia Pacific with 9.1% loss, and Europe with 5.9% loss, which results in an overall worldwide loss of 2.7%.
Annual Growth Of Traffic With Passenger Demand
(Reference: Statista.com)
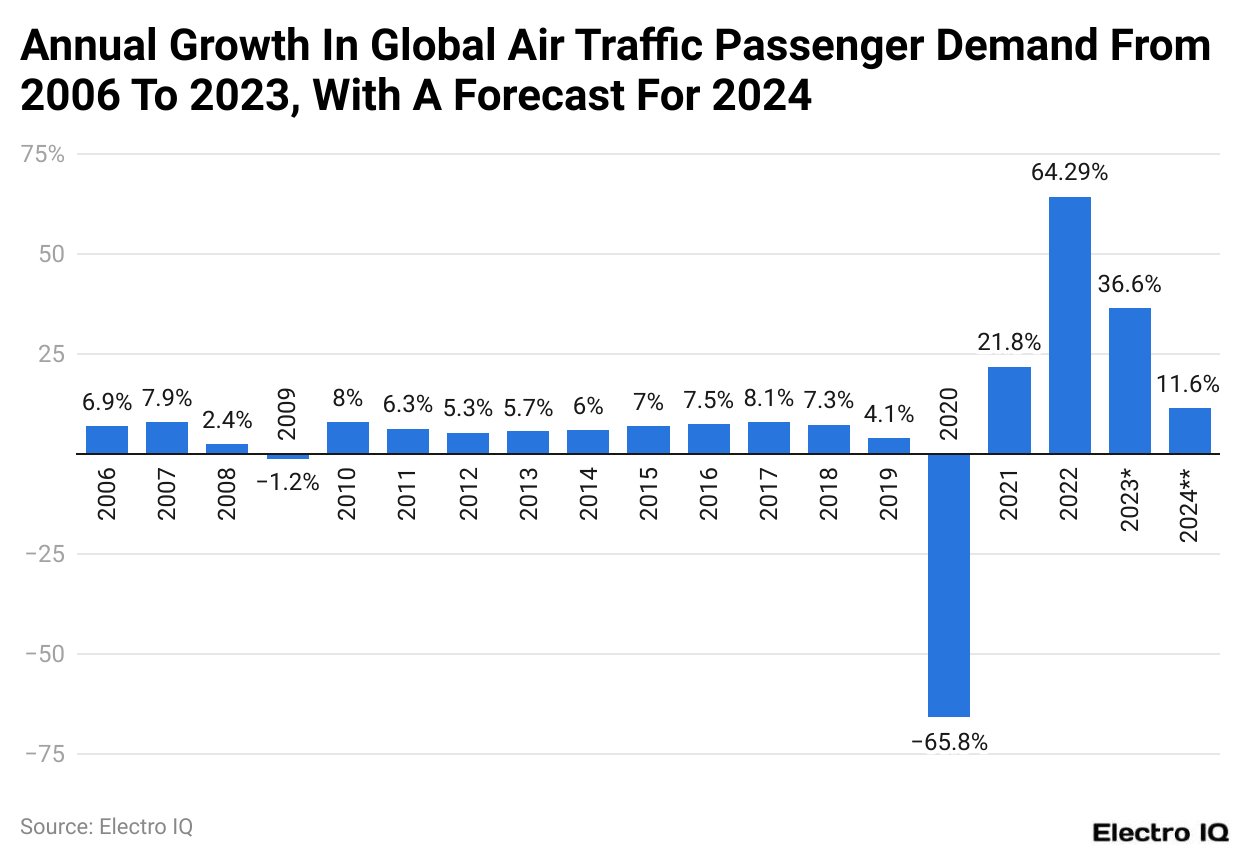
- If one refers to the business jet statistics, one will find that the annual air traffic growth rate has been consistently increasing till the pandemic in 2020.
- Before 2020, the demand for air traffic passengers was highest in 2017, with an 8.1% rise in demand.
- However, due to the pandemic, revenue significantly reduced to 65.8% in 2020, as expected, mainly due to travel restrictions and lockdowns.
- Between the period (2006 – 2024), the highest rise in global air traffic demand was in 2022, with a 64.29% rise in demand for air traffic passengers.
- As of August 2024, there has been an 11.6% increase in global air traffic passenger demand.
Number Of Scheduled Passengers Boards In The Global Airline Industry
(Reference: Statista.com)
- The global airline industry's numbers involving boarding passengers provide essential information about the number of scheduled passengers boarded worldwide.
- Until the precovid era, the number of scheduled passengers boarded was at an all-time high, with 4,723 billion passengers.
- With the introduction of covid lockdowns and travel restrictions, the number of passengers boarded reduced significantly, with 1,807 billion in 2020.
- The business jet statistics show that scheduled passengers worldwide showed signs of recovery, with 3,781 million passengers planned by the end of 2022.
Revenue Per Kilometer Of Commercial Airlines By Region
(Reference: Statista.com)
- The revenue per kilometer of passengers has shown similar regions in different regions.
- The business jet statistics showcase that till the 2020 precovid era, there was an increase of 4.1%.
- Since COVID imposed lockdown and travel restrictions, the revenue has reduced to 65.9% per kilometer loss.
- Since then, per-kilometer revenue has recovered; as shown in the graph, there was a relatively low 39.2% loss.
Air Cargo Traffic Volume
(Reference: Statista.com)
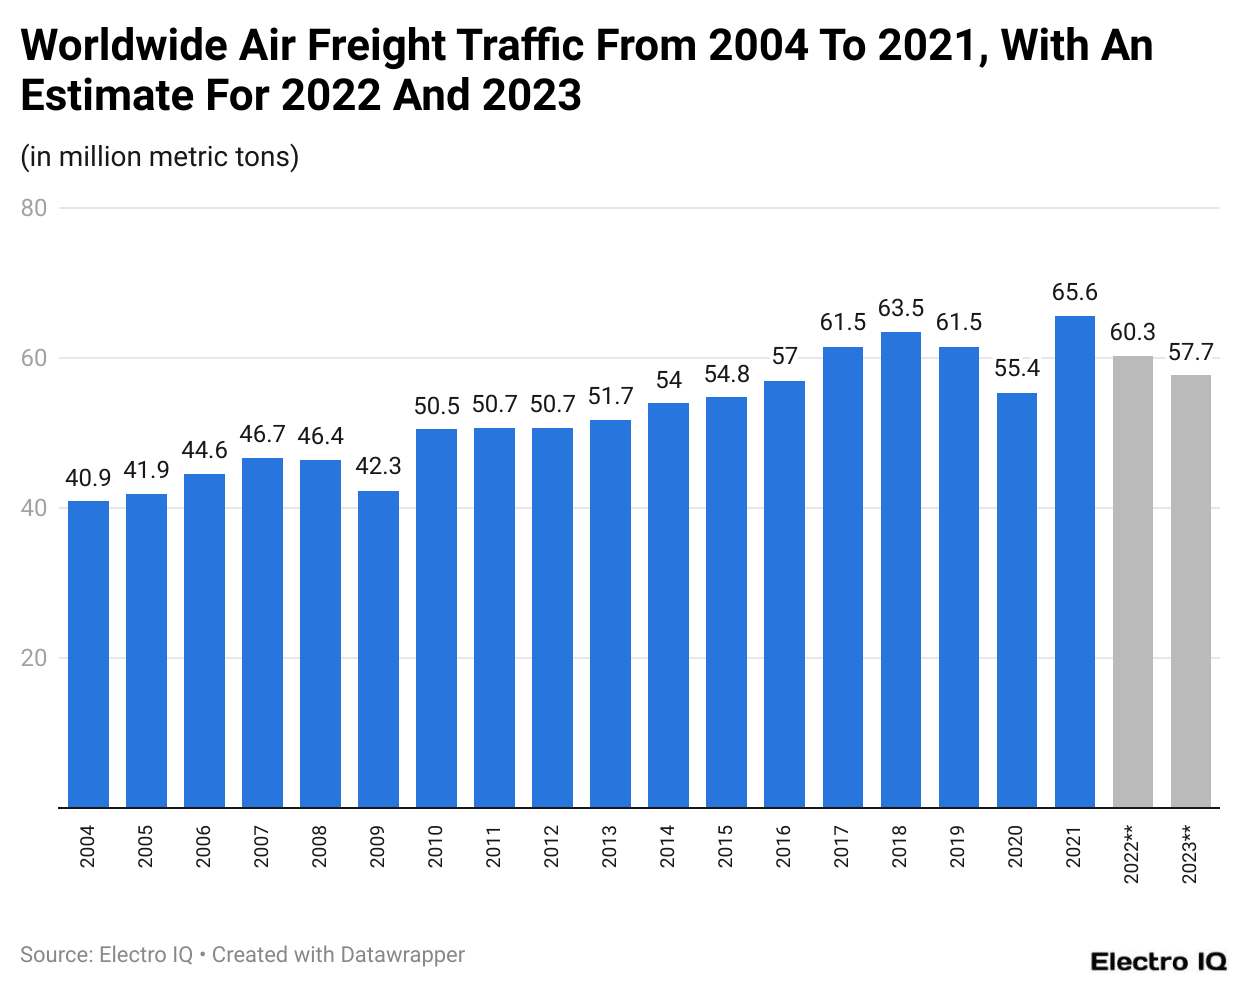
- Referring to the business jet statistics can give a holistic overview of the increase in worldwide air freight traffic.
- Between the period (2004 to 2023), the worldwide freight traffic was highest in 2021, with an air freight traffic load of 65.6 million metric tons.
- Even during COVID-19 in 2020, the worldwide freight air traffic was 55.4 million metric tons.
Cargo Load Changes In Commercial Airlines
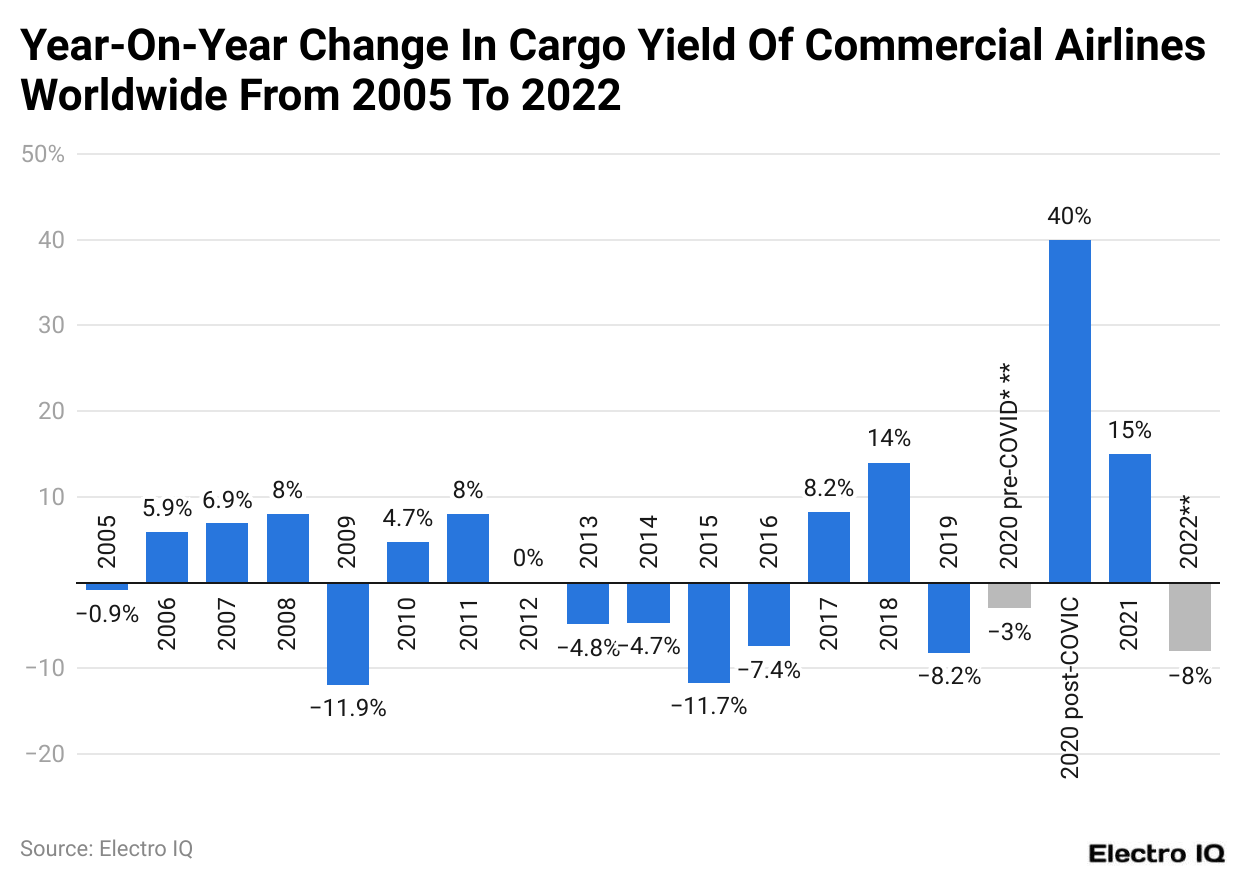
- By reviewing the business jet statistics, one can gain essential information based on the year-on-year changes in the cargo yield of commercial airlines worldwide.
- In post-COVID 2020, the cargo yield of commercial airlines increased to 40% holistically.
- However, in 2021, the cargo yield change showed only a more minor 15% yield increase.
- Going forward, in 2022, the cargo yield of commercial airlines decreased net by 8%.
Leading Airlines By Brand Value

(Reference: Statista.com)
- Based on the business jet statistics, Delta Airlines has the highest brand value, at almost $11k million.
- It is followed by American Airlines and United Emirates, which have brand values of $10.2 million, $8 million, and $6.6 million, respectively.
Leading Airline By Passengers
(Reference: Statista.com)
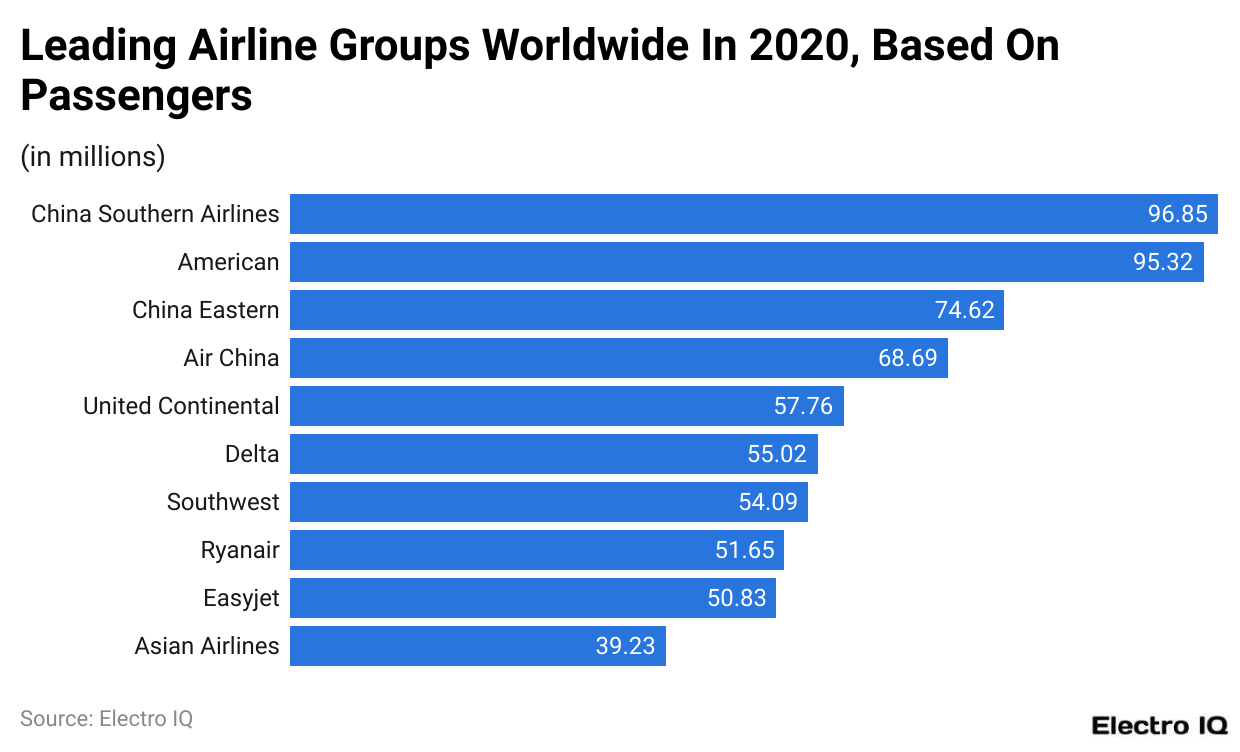
- Information about the leading airline group is essential to learning about the growth of business jets, and it comprises potential customers who are likely to transition to the business jet spectrum of the aviation industry.
- The China Southern is the leader among airline groups worldwide based on passengers, with 96.85 million.
- It is followed by America, with 95.32 million passengers; China Eastern, with 74.62 million; Air China, with 68.69 million; United Continental, with 57.76 million; and Delta, with 55.02 million.
Passengers Kilometers Flown Worldwide
(Reference: Statista.com)
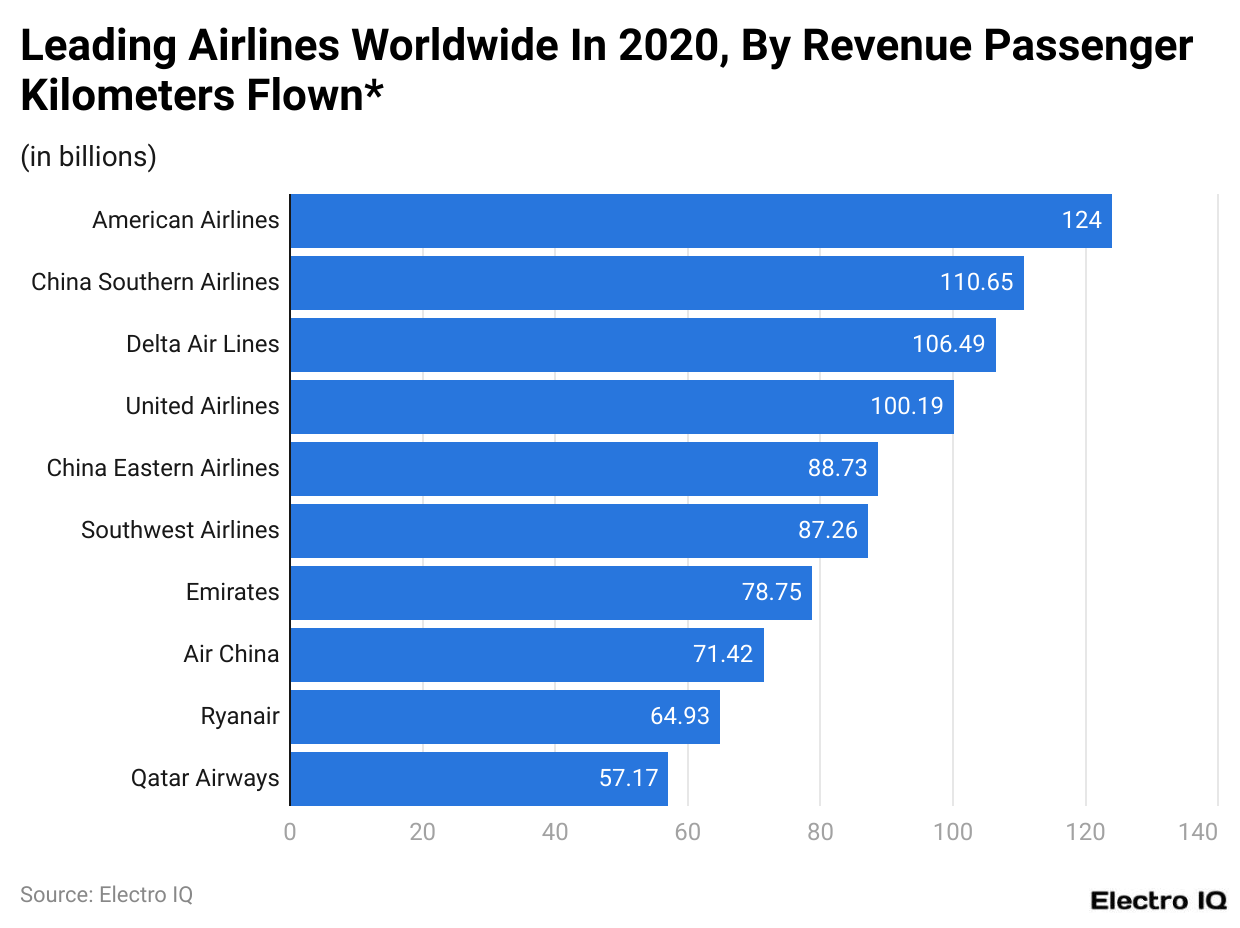
- Based on the information provided in the business jet statistics, American Airlines has the highest number of passenger-kilometers flown, with 124 billion km.
- It is followed by China Southern Airlines with 110.65 billion km, Delta Air Lines with 106.49 billion km, United Airlines with 100.19 billion km, China Eastern Airlines with 88.73 billion km, Southwest Airlines with 87.26 billion km, and Emirates with 78.75 billion km.
Leading Airport By International Passenger Air Traffic
(Reference: Statista.com)
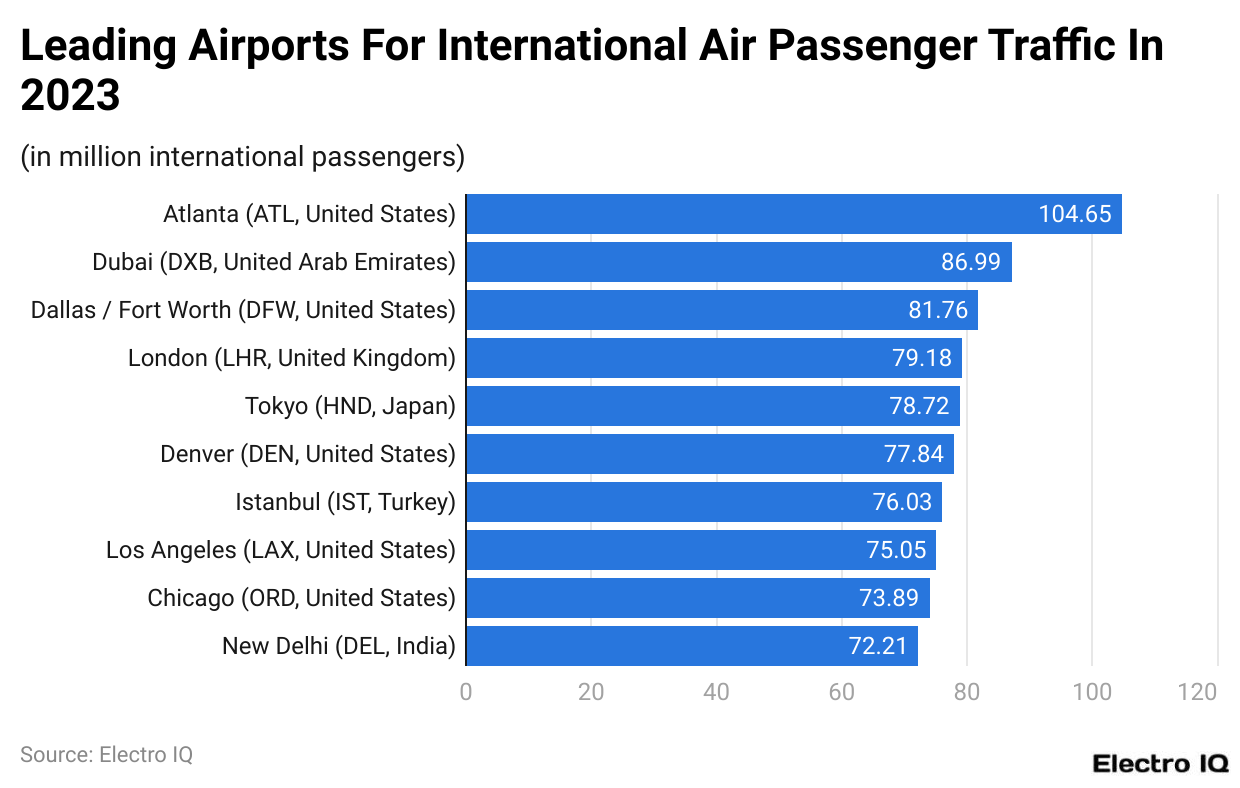
- By learning information about leading airports for international air traffic, one can garner essential information about which regions are the top destinations for business travelers.
- The business jet statistics showcase that ATL airport in Atlanta is the leader in international passenger traffic, with 104.65 million passengers.
- It is followed by DXB in Dubai, with 86.99 million passengers; DFW in Dallas/Fort Worth, with 81.76 million passengers; LHR in London, with 79.18 million passengers; HND in Tokyo, with 78.72 million passengers; DEN in Denver, with 77.84 million passengers, and IST in Istanbul, with 76.03 million passengers.
Aircraft Hull Loss Per Region
(Reference: Statista.com)
- Aircraft hull loss refers to damages caused by aviation accidents that are beyond repair and thus inaccessible. It serves as a vital component while studying business jet statistics.
- The region of Africa had the highest aircraft hull loss per one million flights in 2015, reaching 3.51 million.
- The region of CIS had the highest hull loss of 2.21 per million in 2019.
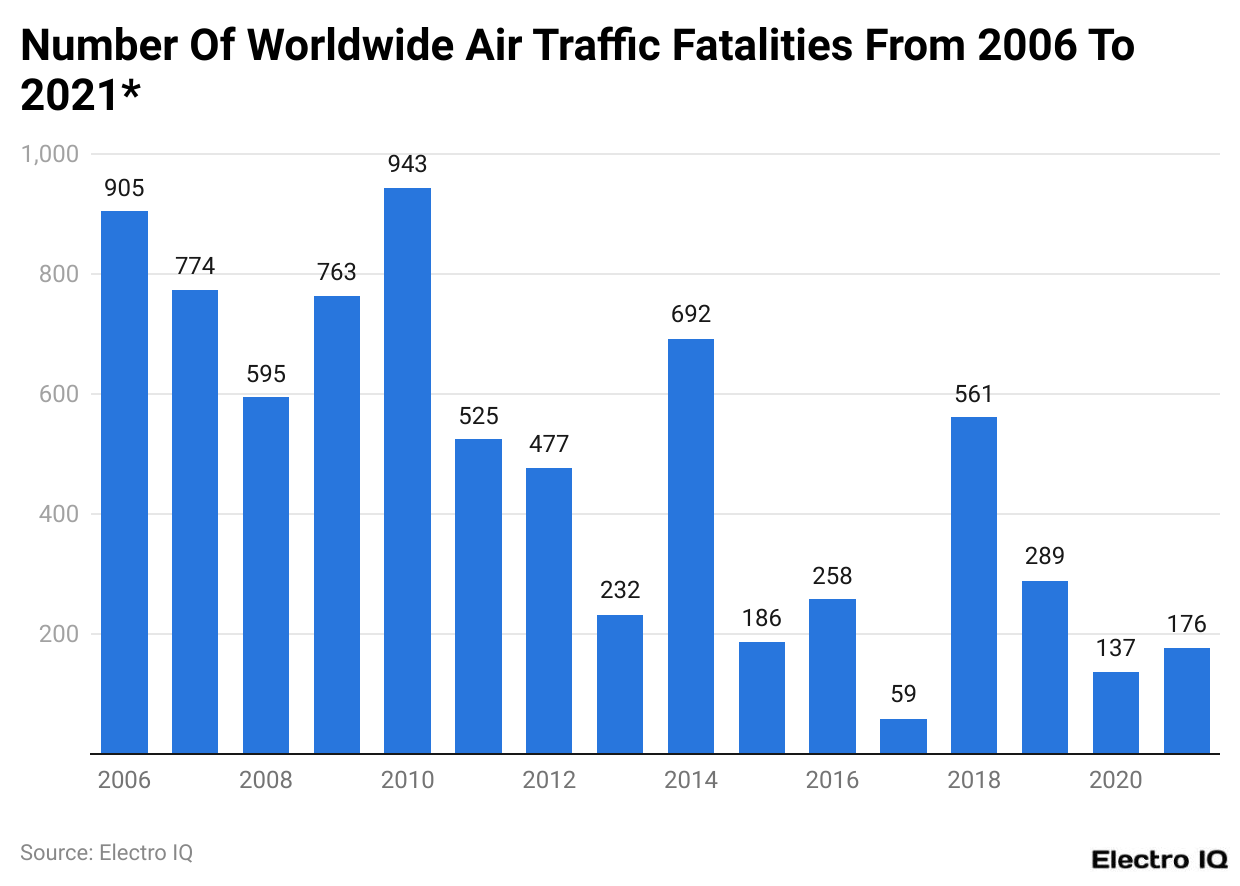
Number Of Worldwide Air Traffic Fatalities
(Reference: Statista.com)
- Airlines are widely regarded as one of the safest forms of travel, and the reduction-based trend in worldwide air traffic fatalities showcases the increase in safety measures of air traffic facilities.
- As per the business jet statistics between the period (2006 - 2021), the highest worldwide revenue was in 2010 with 943 fatalities.
- However, more than a decade later, in 2021, the number of worldwide traffic facilities was reduced to 176.
Business Jet Industry Overview
The business jet market has shown significant growth in 2023 and 2024, driven by increasing demand from corporate executives, high-net-worth individuals, and government agencies. In 2023, the global business jet market was valued at approximately $26.7 billion US dollars, reflecting a robust demand for private aviation solutions. This growth trend has continued into 2024, with the market expected to reach $29.2 billion US dollars, representing a 9.4% year-over-year increase.
A key factor driving this growth is the increasing need for flexibility and efficiency in travel, especially among business leaders who prioritize time management. The ability to bypass commercial aviation's limitations, such as fixed schedules and crowded airports, has made business jets a preferred option for many. This trend is evident in the rising number of deliveries; in 2023, over 700 new business jets were delivered worldwide, which is expected to surpass 750 deliveries in 2024.
In terms of regional market performance, North America continues to dominate, accounting for nearly 60% of the global market share in both 2023 and 2024. The region's dominance is largely due to the presence of a large number of corporate headquarters and the high concentration of wealthy individuals. In 2023, the North American market alone was valued at $16 billion US dollars and is projected to grow to $17.5 billion US dollars in 2024.
Europe and Asia-Pacific are also significant markets for business jets, with Europe holding about 20% of the market share and Asia-Pacific approximately 15%. The European market was valued at $5.3 billion US dollars in 2023 and is expected to reach $5.7 billion US dollars in 2024. The Asia-Pacific market, on the other hand, is experiencing faster growth, with its market value increasing from $4 billion US dollars in 2023 to an estimated $4.5 billion US dollars in 2024, reflecting a 12.5% growth rate.
Another notable trend in the business jet statistics is the growing preference for mid-size and large jets, which offer more space and longer range, making them suitable for transcontinental flights. In 2023, these categories accounted for 70% of all deliveries, a trend expected to continue in 2024.
Conclusion
The business jet industry has shown strong resilience in the face of the pandemic and its restrictions. It could be attributed to the fact that the global market of the aviation industry has a market value of $26.7 billion which is expected to reach $29.2 billion by the end of 2024.
Business Jet statistics show that North America is the region that has had a dominant position in the aviation sector, with an impressive 60% market share. With the advancements in technology, the preference for business jets is expected to increase.
Sources
FAQ.
As of 2023, the global business jet market was valued at approximately $26.7 billion US dollars.
North America dominates the market, accounting for nearly 60% of the global market share.
Over 700 new business jets were delivered worldwide in 2023.
There’s a growing preference for mid-size and large jets, which accounted for 70% of all deliveries in 2023.
The pandemic caused a significant dip in air traffic and revenue in 2020, but the industry has shown strong signs of recovery since then.

Maitrayee Dey has a background in Electrical Engineering and has worked in various technical roles before transitioning to writing. Specializing in technology and Artificial Intelligence, she has served as an Academic Research Analyst and Freelance Writer, particularly focusing on education and healthcare in Australia. Maitrayee's lifelong passions for writing and painting led her to pursue a full-time writing career. She is also the creator of a cooking YouTube channel, where she shares her culinary adventures. At Smartphone Thoughts, Maitrayee brings her expertise in technology to provide in-depth smartphone reviews and app-related statistics, making complex topics easy to understand for all readers.


