Data Centre Server Statistics By Market, Region, Countries, Capacity, Provider, Trends, Insights And Facts (2025)
Updated · Oct 20, 2025


Table of Contents
- Introduction
- Editor’s Choice
- Data Centre Server Market Statistics
- Factors Impacting the Data Centre Server Market Trends
- Data Centre Market Statistics
- Top Countries by Number of Data Centers
- Data Centre Market Share Statistics By Top Provider
- Global Data Centre Capacity Statistics
- Largest Data Centre Markets by Installed Capacity
- Global Data Centre Electricity Consumption by Equipment
- Conclusion
Introduction
Data Centre Server Statistics: A data centre server is a strong and advanced computer used inside data centres. It helps businesses and users by storing, processing, and managing large amounts of data while also running different applications. They allow companies to run applications, use cloud platforms, apply AI, and deliver online services.
With hybrid cloud, edge computing, and AI growing, businesses need servers that are fast, secure, and efficient. They are also improving energy use, virtualisation, and hardware for better performance. This article on Data Centre Server Statistics includes a clear view of industry growth, new technology shifts, and the changing needs of IT systems worldwide.
Editor’s Choice
- According to the Mordor Intelligence report analysis, in 2025, the global data centre server market will be worth about USD 110 billion.
- Cognitive Market Research analysis states that in 2024, North America led the global data centre server market with a size of USD 24,616.88 million.
- Meanwhile, the United States data centre server market reached USD 19,422.72 million and is expected to grow steadily at an 8.6% CAGR through 2031.
- AI and machine learning workloads needing GPU-heavy servers are the top growth driver, adding about +4.9% between 2025 and 2030.
- According to Statista report analysis, the Data Centre market is expected to reach USD 527.46 billion in revenue by 2025.
- As of March 2025, the countries with the largest number of data centres are led by the United States with 5,426, followed by Germany (529) and the United Kingdom (523).
- Equinix holds the largest share of the global data centre market at 13%.
- By 2025, global installed capacity is projected to reach 114.3 gigawatts (GW), reflecting an annual growth rate of 17.7%.
- In 2024, Northern Virginia accounted for the highest in data centre capacity, with 6.98 gigawatts (GW) installed and 5.38% of that capacity currently under construction.
- In the same period, data centre electricity consumption reached around 420 TW.
Data Centre Server Market Statistics
 (Reference: mordorintelligence.com)
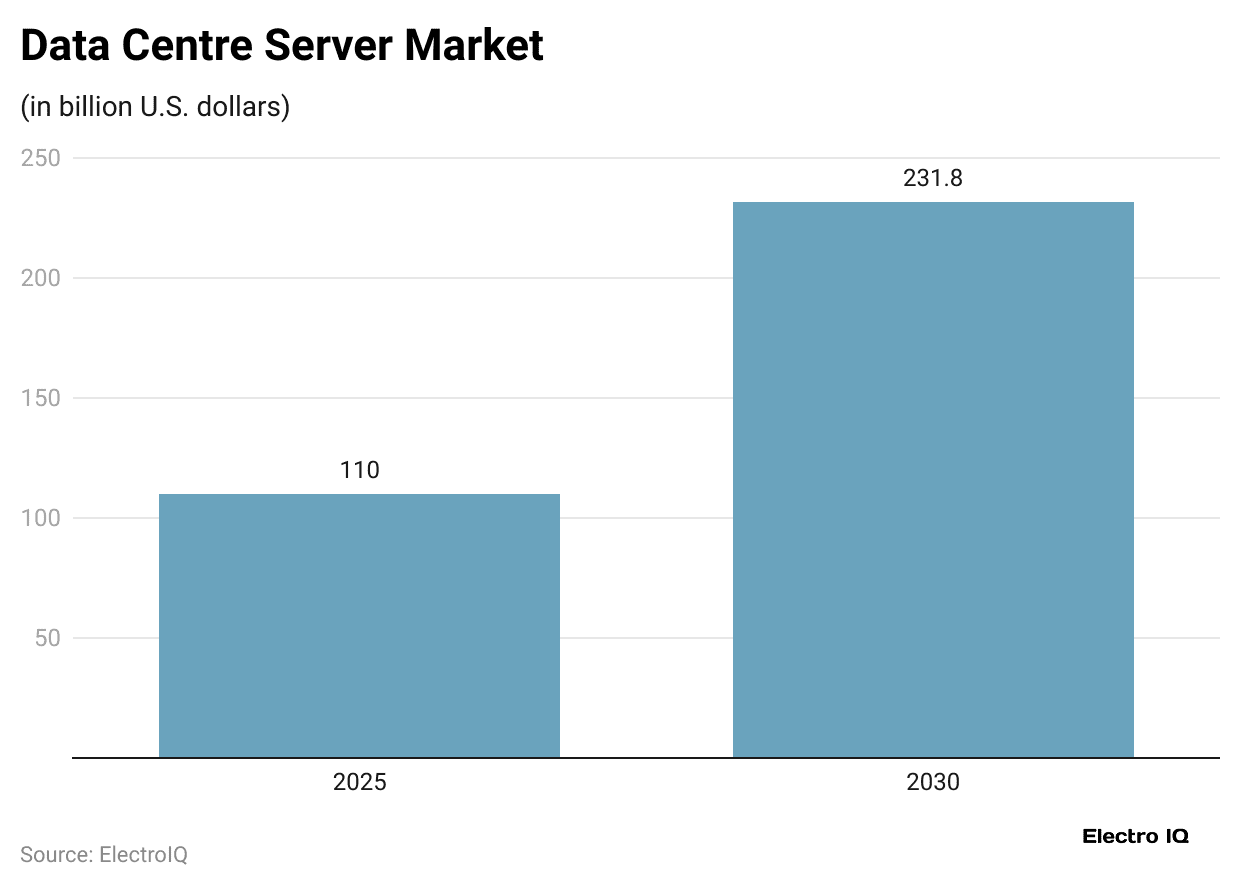
- In 2025, the global data center server market will be worth about USD 110 billion.
- By 2030, it is expected to reach approximately USD 231.8 billion, growing at a CAGR of 16.08%.
By Segmental Analysis
| Metrics | Market Revenue Share, 2024 | CAGR (2025to 2030) |
| By data-centre tier | Tier 3 facilities (72.3%) |
Tier 4 (17.9%) |
|
By form factor |
Half-height blades (63.2%) | quarter-height and micro-blade systems (16.2%) |
| By application/workload | Artificial intelligence and machine learning (35.3%) |
Virtualisation and private cloud (16.9%) |
|
By data-centre type |
Colocation facilities (58.5%) | Hyperscalers and cloud service (18.1%) |
| By end-use industry | IT and telecom (36.4%) |
Manufacturing and Industry 4.0 workloads (17.3%) |
|
By Geography |
North America (45.7%) |
Asia-Pacific (18.2%) |
By Region
- According to Cognitive Market Research in 2024, North America led the global data centre server market with a size of USD 24,616.88 million, holding over 40% share, and is projected to expand further at a strong 8.8% CAGR through 2031.
In the same period, other regional analyses are stated in the table below.
| Region | Market Size (USD million) | Market Share | CAGR (2024 to 2031) |
| Europe | 18,462.66 | >30% | – |
| Asia Pacific | 14,154.71 | Approx. 23% | 12.6% |
| Latin America | 3,077.11 | >5% | 10% |
| Middle East & Africa | 1,230.84 | Approx. 2% | 10.3% |
By Country
- In 2024, the United States data centre server market reached USD 19,422.72 million and is expected to grow steadily at an 8.6% CAGR through 2031.
| Country | Market Size, 2024 (USD million) | CAGR (2024 to 2031) |
| United States | 19422.72 | 8.6% |
| Canada | 2954.03 | 9.6% |
| Mexico | 2240.14 | 9.3% |
| United Kingdom | 3101.73 | 9.9% |
| France | 1698.56 | 8.3% |
| Germany | 3655.61 | 9.3% |
| Italy | 1587.79 | 8.5% |
| Russia | 2861.71 | 8.1% |
| Spain | 1513.94 | 8.2% |
| Luxembourg | 572.34 | 9.2% |
| Portugal | 387.72 | 8.9% |
| Greece | 221.55 | 9.4% |
| Rest of Europe | 2861.71 | 7.8% |
| China | 6369.62 | 12.1% |
| Japan | 1953.35 | 11.1% |
| India | 1698.56 | 14.4% |
| South Korea | 1415.47 | 11.7% |
| Australia | 736.04 | 12.3% |
| South East Asia | 976.67 | 13.6% |
| Rest of Asia Pacific | 1004.98 | 12.4% |
| Brazil | 1317 | 10.6% |
| Argentina | 516.95 | 10.9% |
| Colombia | 273.86 | 9.8% |
| Peru | 252.32 | 10.2% |
| Chile | 221.55 | 10.3% |
| Rest of Latin America | 495.41 | 9.1% |
| GCC Countries | 526.80 | 11.1% |
| Egypt | 129.24 | 10.6% |
| South Africa | 194.47 | 11.3% |
| Turkey | 105.85 | 9.8% |
| Nigeria | 129.24 | 9.4% |
| Rest of MEA | 145.24 | 9.3% |
Factors Impacting the Data Centre Server Market Trends
- Mordor Intelligence notes that AI and machine learning workloads needing GPU-heavy servers are the top growth driver, adding about +4.9% between 2025 and 2030.
- Hyperscale and edge data centre expansion also plays a big role, with an impact of +4.1%.
- Growing cloud-service use contributes +3.2%, while wider 5G rollout adds +2.8%.
- On the hardware side, liquid-cooling server designs bring +1.8%, and the industry shift toward ARM and RISC-V architectures supports another +1.4% of market growth.
Data Centre Market Statistics
- According to Statista report analysis, the Data Centre market is expected to reach USD 527.46 billion in revenue by 2025.
- Network infrastructure is the largest segment, with a projected value of USD 254.80 billion in the same year.
- From 2025 to 2030, the market is expected to grow at an average rate of 6.98% CAGR, reaching USD 739.05 billion by 2030.
- Meanwhile, the United States is expected to generate the highest revenue, estimated at USD171.90 billion in 2025.
By Region
| Region | Market Size (USD billion) | CAGR (2025 to 2030) | Dominating Segment (Network Infrastructure), 2025 | |
| 2025 | 2030 | |||
| Africa | 8.96 | 12.63 | 7.12% | USD 3.88 billion |
| Americas | 206.21 | 293.32 | 7.30% | USD 98.57 billion |
| Asia | 179.42 | 248.37 | 6.72% | USD 104.07 billion |
| Australia & Oceania | 9.02 | 12.68 | 7.05% | USD 4.03 billion |
| Caribbean | 1.21 | 1.68 | 6.71% | USD 689.86 million |
| Europe | 123.85 | 172.04 | 6.79% | USD 67.80 billion |
By Country
- A report published by Statista shows that in 2025, the United States data centre market will earn USD 171.90 billion, with servers leading at USD 85.88 billion.
- From 2025 to 2030, the market is expected to grow annually by 7.38%, reaching around USD 245.37 billion.
Furthermore, other countries’ analyses are stated in the table below:
| Country | Market Size (USD billion) | CAGR (2025 to 2030) | Dominating Segment (Network Infrastructure), 2025 | |
| 2025 | 2030 | |||
| Germany | 23.13 | 32.30 | 6.90% | USD 11.65 billion |
| India | 11.53 | 15.91 | 6.66% | USD 7.13 billion |
| Japan | 25.30 | 35.06 | 6.74% | USD 14.62 billion |
| China | 103.19 | 142.64 | 6.69% | USD 60.59 billion |
Top Countries by Number of Data Centers
 (Reference: statista.com)
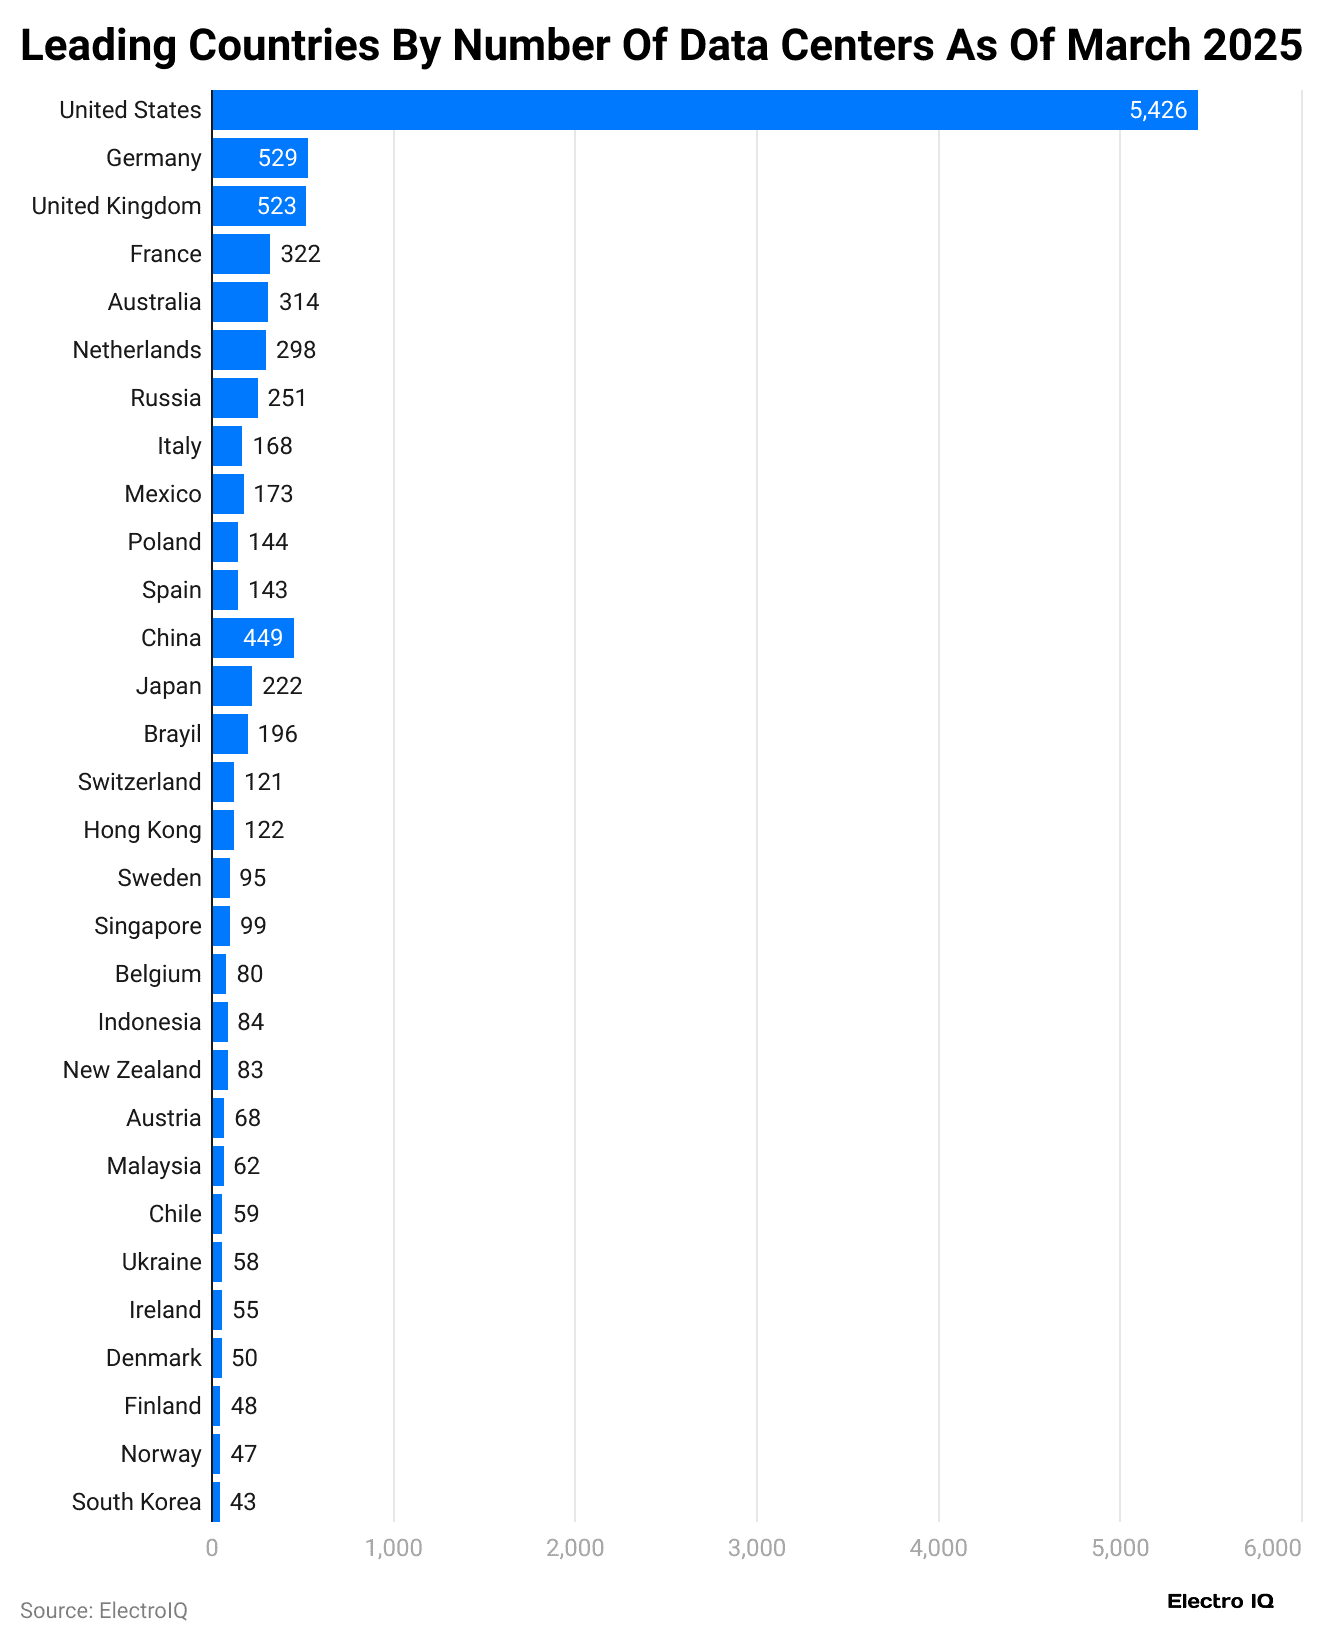
- As of March 2025, the countries with the largest number of data centres are led by the United States with 5,426, followed by Germany (529), the United Kingdom (523), China (449), France (322), Australia (314), and the Netherlands (298).
- Other countries include Russia (251), Japan (222), Brazil (196), Mexico (173), Italy (168), Poland (144), Spain (143), Hong Kong (122), Switzerland (121), Singapore (99), Sweden (95), Indonesia (84), New Zealand (83), Belgium (80), Austria (68), Malaysia (62), Chile (59), Ukraine (58), Ireland (55), Denmark (50), Finland (48), Norway (47), and South Korea (43).
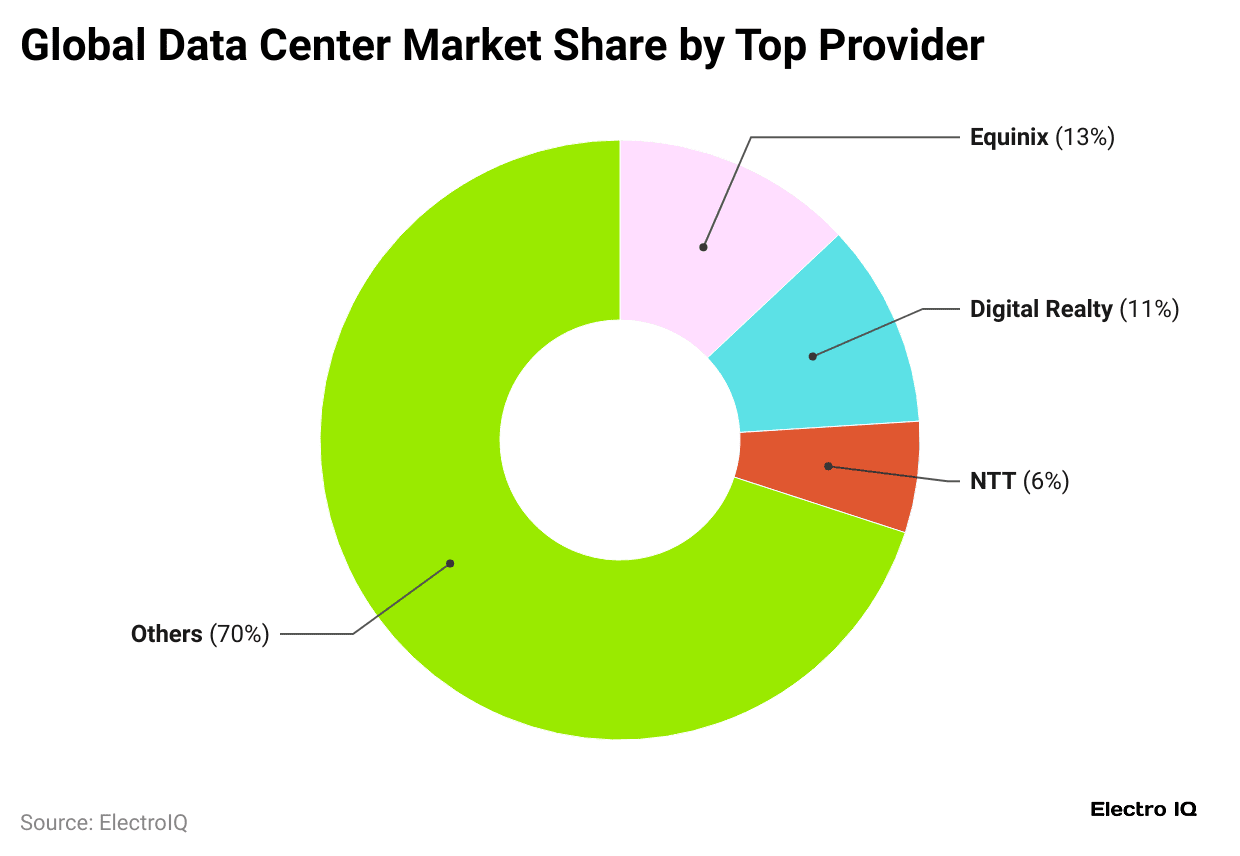
- Equinix holds the largest share of the global data centre market at 13%, followed by Digital Realty with 11% and NTT at 6%.
- The remaining 70% of the market is distributed among numerous smaller and regional providers.
Global Data Centre Capacity Statistics
 (Source: voronoiapp.com)
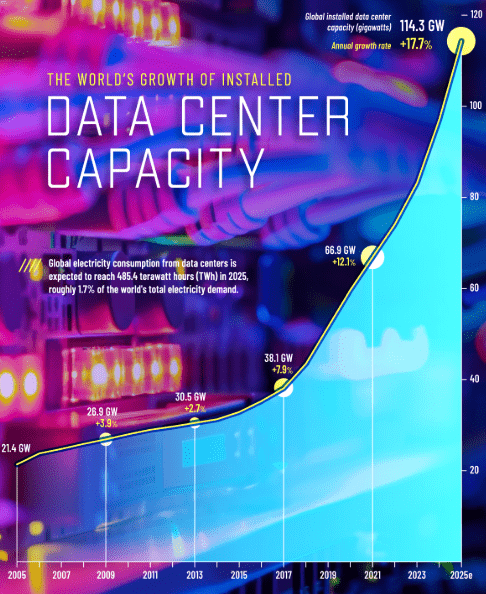
- By 2025, global installed capacity is projected to reach 114.3 gigawatts (GW), reflecting an annual growth rate of 17.7%.
- This surge aligns with rising electricity consumption by data centres, which is expected to hit 485.4 terawatt-hours (TWh) in 2025, representing about 1.7% of the world’s total electricity demand.
Previous years’ demands for the Data Centre are mentioned in the table below:
| Year | Global installed data centre capacity (GW) | Annual growth rate |
| 2024 | 97.1 | 16.7% |
| 2023 | 83.2 | 12.3% |
| 2022 | 74.1 | 10.8% |
| 2021 | 66.9 | 12.1% |
| 2020 | 59.7 | 15.7% |
| 2019 | 51.6 | 18.6% |
| 2018 | 43.5 | 14.2% |
| 2017 | 38.1 | 7.9% |
| 2016 | 35.3 | 7.3% |
| 2015 | 32.9 | 5.1% |
| 2014 | 31.3 | 2.6% |
| 2013 | 30.5 | 2.7% |
| 2012 | 29.7 | 2.4% |
| 2011 | 29 | 3.6% |
| 2010 | 28 | 4.1% |
| 2009 | 26.9 | 3.9% |
| 2008 | 25.9 | 4.4% |
| 2007 | 24.8 | 4.2% |
| 2006 | 23.8 | 11.2% |
| 2005 | 21.4 | – |
Largest Data Centre Markets by Installed Capacity
 (Source: statcdn.com)
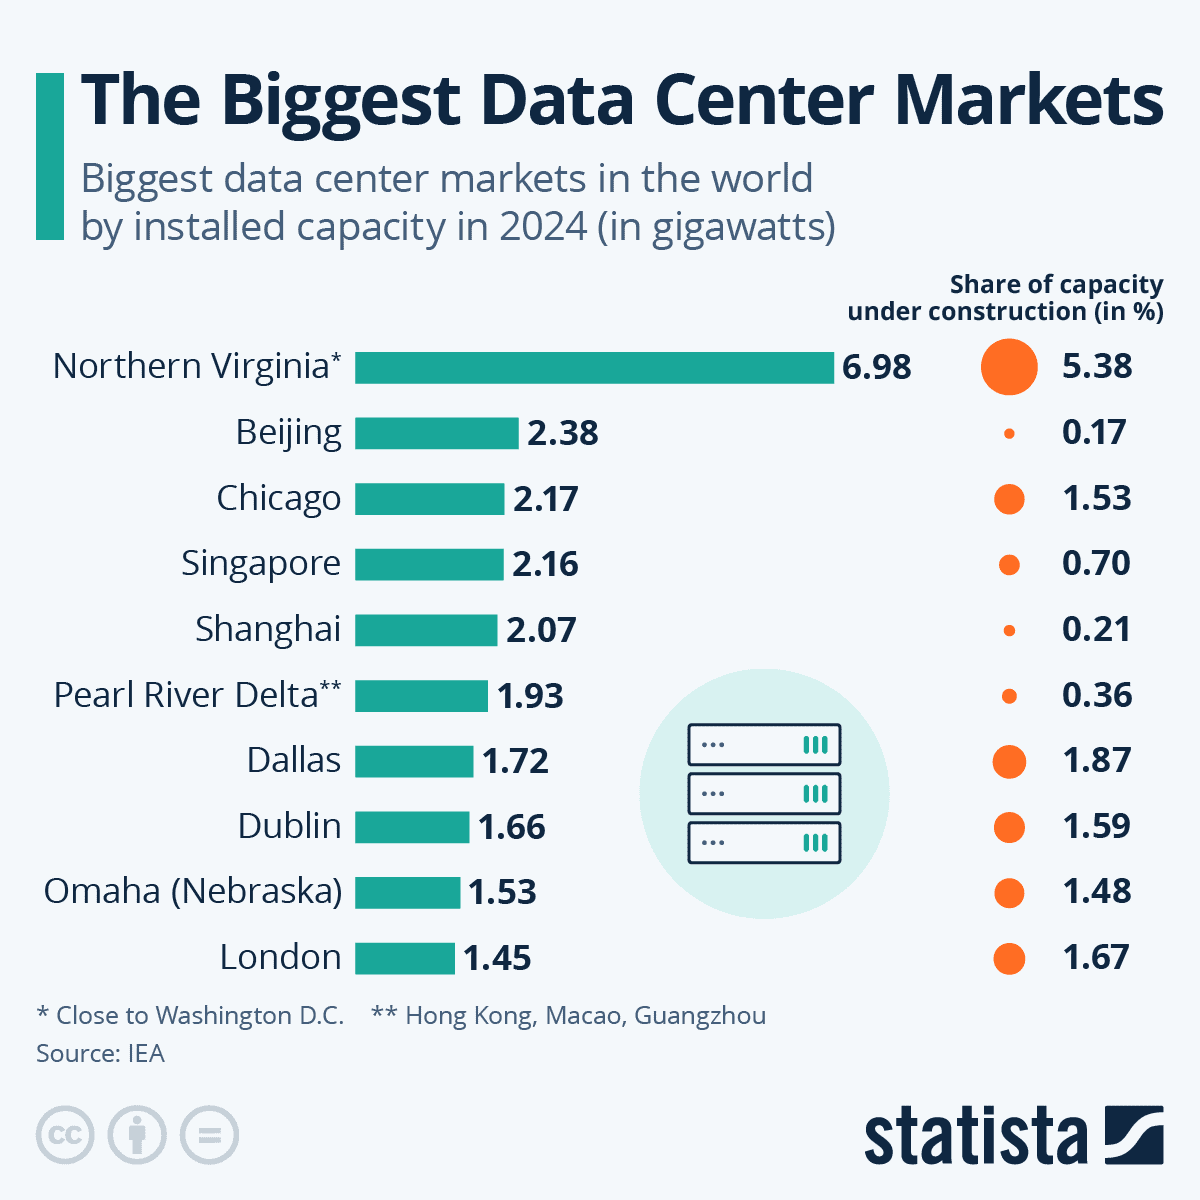
- In 2024, Northern Virginia led the world in data centre capacity, with 6.98 gigawatts (GW) installed and 5.38% of that capacity currently under construction.
- Other major markets include Beijing with 2.38 GW (0.17% under construction), Chicago at 2.17 GW (1.53% under construction), and Singapore at 2.16 GW (0.70% under construction).
- Shanghai follows closely with 2.07 GW (0.21% under construction), while the Pearl River Delta, encompassing Hong Kong, Macao, and Guangzhou, has 1.93 GW (0.36% under construction).
- Additionally, Dallas has 1.72 GW (1.87% under construction), followed by Dublin at 1.66 GW (1.59%), Omaha, Nebraska, with 1.53 GW (1.48%), and London with 1.45 GW (1.67%).
Global Data Centre Electricity Consumption by Equipment
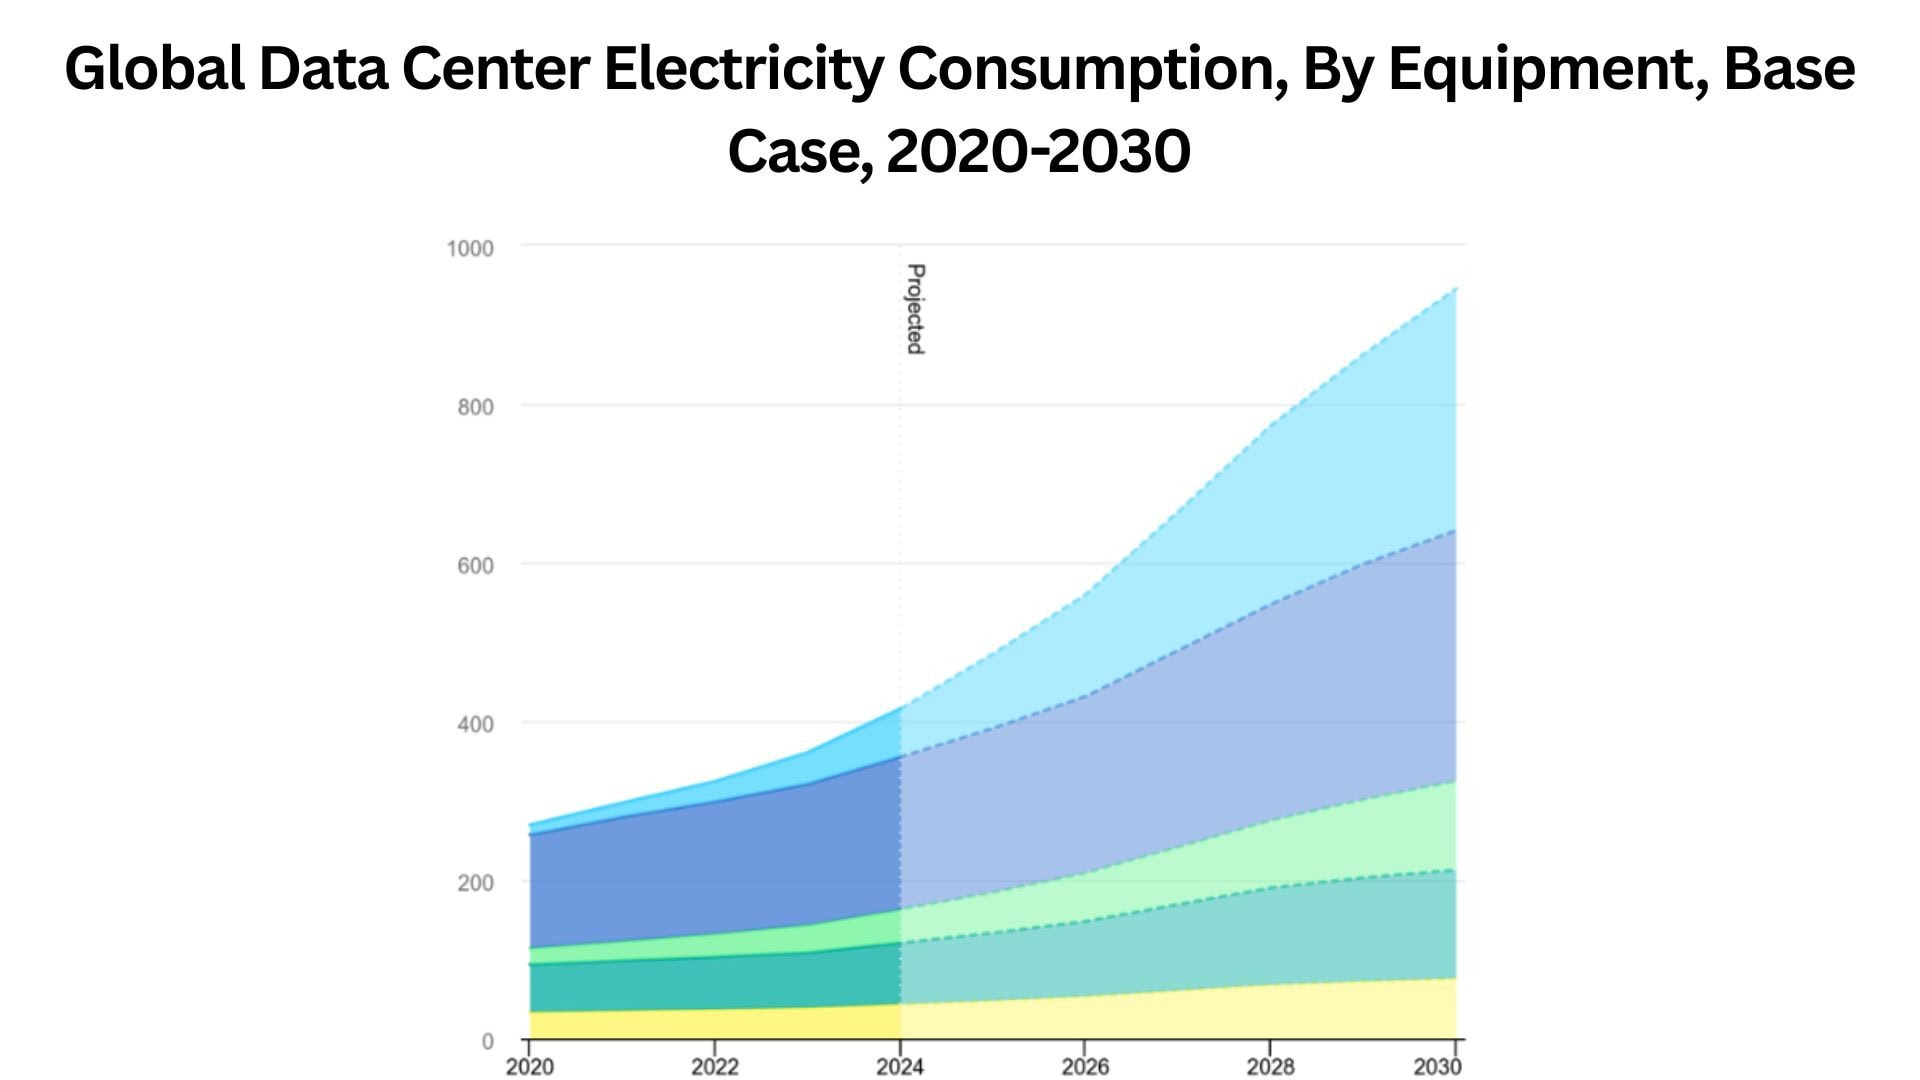
- In 2020, total electricity usage was approximately 275 TWh.
- By 2024, consumption reached around 420 TWh, marking a notable rise.
- Beyond 2024, projections indicate a sharp increase, with total electricity consumption expected to reach nearly 950 TWh by 2030.
- The chart shows a layered contribution that shows the largest portion, represented in dark blue, grows from about 140 TWh in 2020 to roughly 315 TWh in 2030.
- Light blue segments increase from around 10 TWh in 2020 to approximately 300 TWh in 2030.
- Green equipment rises from nearly 20 TWh to 110 TWh, while teal segments grow from 60 TWh to 135 TWh over the same period.
- Yellow equipment consumption steadily climbs from about 35 TWh in 2020 to roughly 80 TWh in 2030.
Conclusion
In summary, the data center server market can be concluded for solid growth, driven by greater adoption of AI, cloud solutions, and edge computing. North America remains the top revenue contributor, while Asia-Pacific is expanding the quickest, offering both mature and emerging opportunities.
Improvements in server design, cooling systems, and the spread of 5G are expected to make operations more efficient and powerful. Altogether, servers are set to remain a key foundation for global digital infrastructure.
FAQ.
Data centres use rack servers, blade servers, tower servers, and increasingly, microservers for edge computing.
The total servers in a data centre varies, typically ranging from hundreds to thousands.
A data centre server’s lifespan lasts for three to five years before replacement.
Servers mainly use HDDs, SSDs, and hybrid storage systems for reliable, scalable, and high-performance data management.

Maitrayee Dey has a background in Electrical Engineering and has worked in various technical roles before transitioning to writing. Specializing in technology and Artificial Intelligence, she has served as an Academic Research Analyst and Freelance Writer, particularly focusing on education and healthcare in Australia. Maitrayee's lifelong passions for writing and painting led her to pursue a full-time writing career. She is also the creator of a cooking YouTube channel, where she shares her culinary adventures. At Smartphone Thoughts, Maitrayee brings her expertise in technology to provide in-depth smartphone reviews and app-related statistics, making complex topics easy to understand for all readers.