Table of Contents
Introduction
Diversity In Tech Statistics: Technology is transforming the way we live, work, and connect, but is it providing everyone with a fair shot? Although the tech world leads in innovation, it still lacks diversity in areas such as race, gender, age, and background.
This gap doesn’t just hurt job seekers; it also impacts how products are developed, how teams operate, and how effectively companies perform. In this article, “Diversity In Tech Statistics “, you’ll find out which groups are still underrepresented and learn why building a more inclusive tech industry is important for future success, fairness, and fresh ideas.
Editor’s Choice
- Around 70% of tech internships now offer financial support or stipends to help students from low-income families join the workforce.
- About 26% of tech companies have clear policies that let transgender employees safely share their identity without fear of discrimination.
- Nearly 53% of the females stated that they think it is hard for females to gain senior-level promotions at tech companies.
- Tech companies in the top 25% for racial and ethnic diversity are 35% more likely to earn above-average income.
- The tech jobs with the smallest number of women in 2023–24 were in computer, ATM, and similar repair positions, with a total of 9,880 women.
- In 2024–25, women comprised approximately 22% of all European tech jobs. In the U.S., women held about 21% of software developer positions.
- According to BLS data, the average weekly salary for a female in the tech industry in 2003 was USD 1,005, almost 16% less than the typical male tech worker.
General Diversity In Tech Statistics
- In 2024, Google boosted the number of Black, Latino/Hispanic, and Native American leaders at the company by 30%.
- In the U.S., Black workers make up 13% of support roles in tech but only 6% of web developer jobs. Asian professionals hold 34% of tech jobs, while Hispanic or Latino workers make up 5.9% of the workforce.
- In the UK, 25% of tech workers are from ethnic minority groups, but only 5% identify as Black. That drops to just 14% for senior tech positions.
- Tech companies in the top 25% for racial and ethnic diversity are 35% more likely to earn above-average income.
- Diversity in Tech Statistics stated that only 6% of tech employees in the UK report having a disability, even though 23% of working-age adults have one.
- Currently, 60% of large tech companies have programs in place to support workers with disabilities and enhance accessibility.
- During the COVID-19 outbreak, 23% more women in tech reported feeling burned out than men. This shows how important better mental health support is, especially for disabled employees.
- Although about 15–20% of people in the UK are believed to be neurodivergent, only 3% of tech employees have shared that with their employer.
- BCS (Chartered Institute for IT) says almost 90,000 people with visible or hidden disabilities are missing from the tech industry.
- Just 9% of tech workers in the UK come from low-income backgrounds despite making up 39% of the population.
- About 45% of people working in tech had parents with professional or management careers.
- However, the industry is seeing some improvement. Today, 30% of entry-level tech jobs are held by people from underrepresented groups, including those from lower-income families.
- Additionally, 45% of tech workers grew up in households where neither parent attended college, indicating a trend of greater social mobility in the field.
- Around 70% of tech internships now offer financial support or stipends to help students from low-income families join the workforce.
- Only 0.09% of tech workers identify as non-binary, likely due to outdated or limited company data systems.
- Transgender professionals make up 17% of the tech workforce, compared to just 0.5% of the overall working-age population in the UK.
- Diversity in Tech Statistics stated that about 26% of tech companies have clear policies that let transgender employees safely share their identity without fear of discrimination.
- More than 40% of large tech firms have support groups for LGBTQIA+ staff.
- Still, LGBTQIA+ workers in tech are 20% less likely to get promoted than those who are not part of the LGBTQIA+ community.
Hiring, Pay, and Job Statistics
- A report released this year stated that 36% of tech recruiters think that equity, inclusion, and diversity are essential problems in the industry.
- Around 97.8% of tech companies provide managers with some education on eliminating bias from their performance and management processes.
- Diversity in Tech Statistics reported that nearly 53% of females believe it is challenging for women to secure senior-level promotions at tech companies.
- The previous year stated that women CEOs at tech startups earned USD 20,000 less than men in these roles.
- Companies pay males higher salaries than females for 62% of jobs in technology, according to a survey.
- As of 2024, females in tech are promoted at a higher rate than men.
Women in Tech Industry Statistics
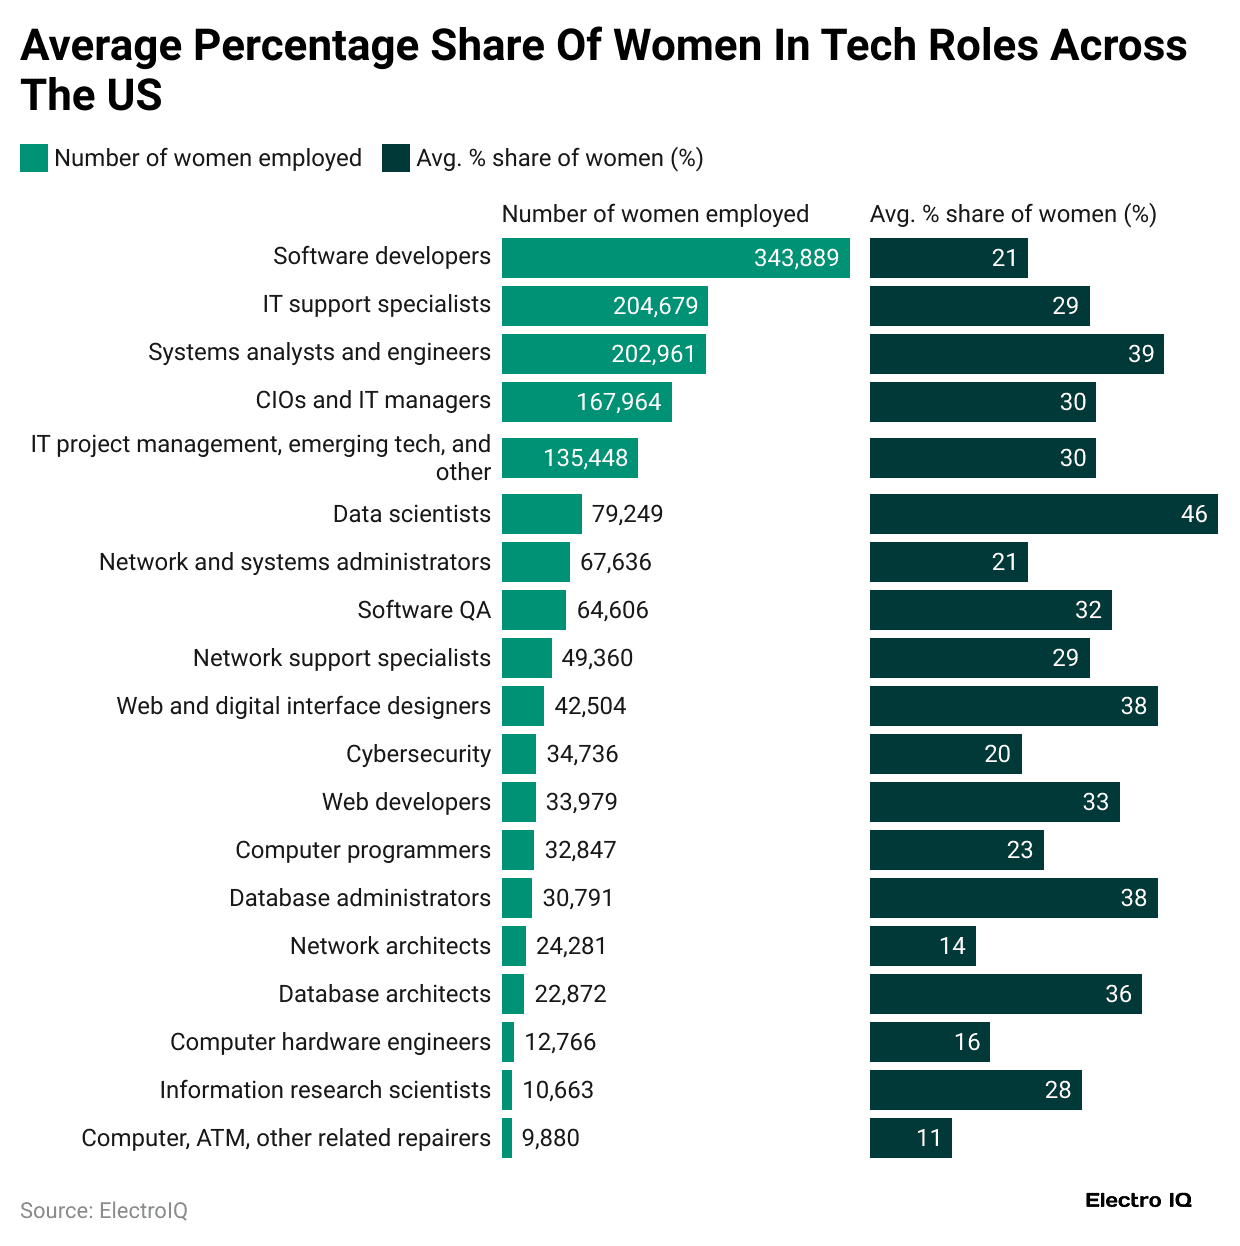
- As of 2023–24, approximately 343,889 women in the U.S. worked as software developers, according to the latest State of Tech Workforce Report from CompTIA. This was the largest number of women in any tech job that year.
- Women made up roughly 21%—or 1 out of every 5—software developers in the country.
- In comparison, around 202,961 women were employed as systems analysts and engineers. They made up just under 39% of the total U.S. workforce in those roles.
 (Source: aiprm.com)
| Tech role | Number of women employed | Avg. % share of women (%) |
|
Computer, ATM, and other related repairers |
9,880 | 11% |
| Information research scientists | 10,663 |
28% |
|
Computer hardware engineers |
12,766 | 16% |
| Database architects | 22,872 |
36% |
|
Network architects |
24,281 | 14% |
| Database administrators | 30,791 |
38% |
|
Computer programmers |
32,847 | 23% |
| Web developers | 33,979 |
33% |
| 34,736 | 20% | |
| Web and digital interface designers | 42,504 |
38% |
|
Network support specialists |
49,360 | 29% |
| Software QA | 64,606 |
32% |
|
Network and systems administrators |
67,636 | 21% |
| Data scientists | 79,249 |
46% |
|
IT project management, emerging tech, and other |
135,448 | 30% |
| CIOs and IT managers | 167,964 |
30% |
|
Systems analysts and engineers |
202,961 | 39% |
| IT support specialists | 204,679 |
29% |
|
Software developers |
343,889 |
21% |
- In the U.S., women make up the largest share of tech workers in data science roles. Approximately 46% of all data scientists in the country are female.
- In contrast, the tech jobs with the smallest number of women in 2023–24 were in computer, ATM, and similar repair positions, with a combined total of 9,880 women. That’s about 35 times fewer than the number of female software developers. Women made up just 11% of workers in that field.
 (Reference: ecwt.eu)
- In Europe, women held approximately 22% of all tech jobs in 2023, according to research by McKinsey & Company.
- Product design and management roles had the highest share of women among all tech positions in Europe, with females comprising nearly 46% of the workforce in these roles.
Tech Industry Demographics Statistics
- In 2024–25, women comprised approximately 22% of all tech jobs in Europe. In the U.S., women held about 21% of software developer positions.
- The highest share of women in any U.S. tech role was in data science, where they comprised nearly 46% of the workforce.
 (Reference: zippia.com)
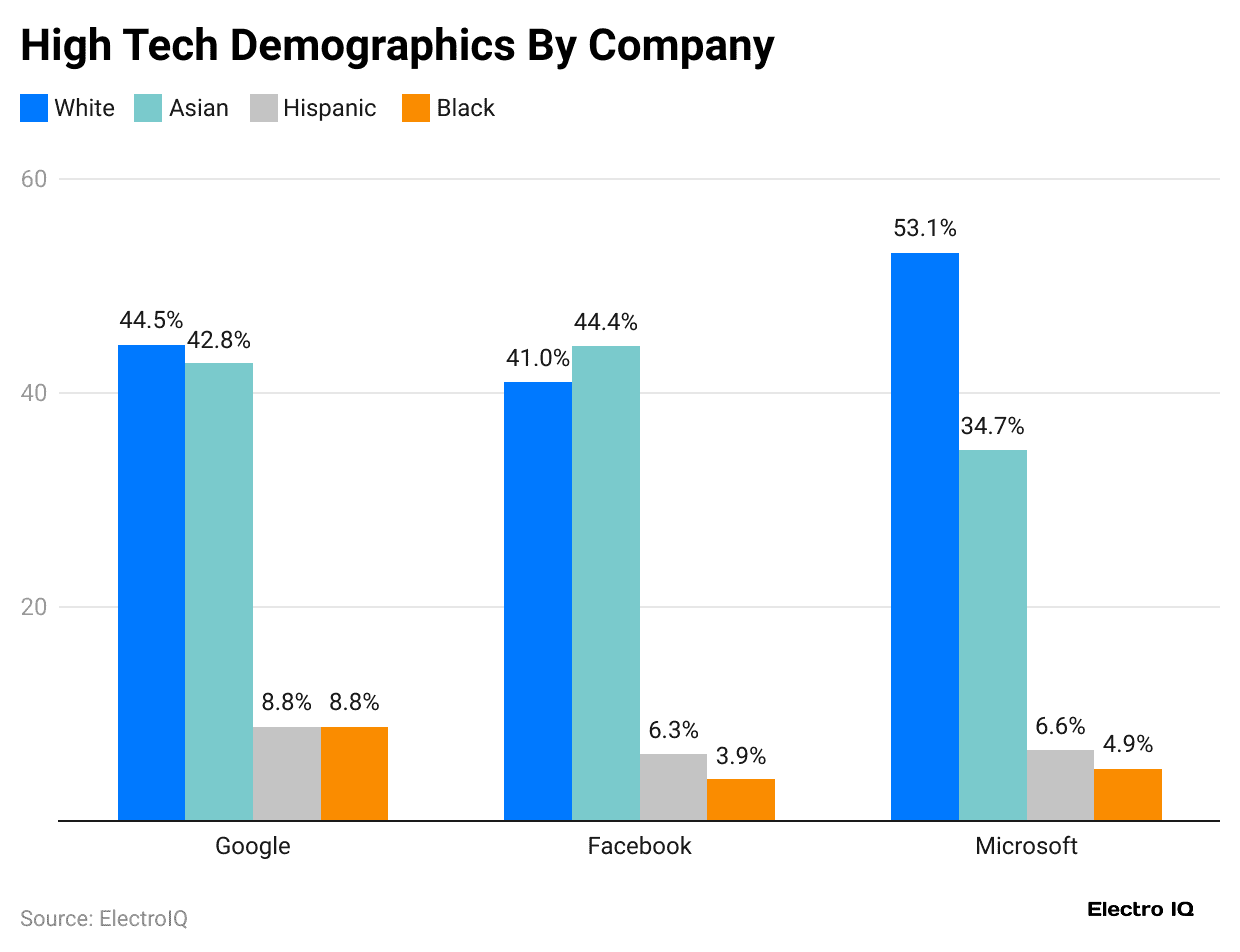
- In the above chart, we can see the high-tech demographics by company statistics.
- On the other hand, very few women worked in computer, ATM, and equipment repair jobs—only 9,880 in total, which is just 11% of that field. That’s about 35 times fewer than the number of female software developers.
- Black workers made up 13% of tech support roles and 6% of web developer jobs.
- Asian employees held around 34% of all tech roles in the U.S.
- Hispanic or Latino workers represented about 5.9% of the tech workforce.
- In 2024, Google boosted the number of Black, Latino/Hispanic, and Native American leaders in its company by 30%.
- In the UK, about 25% of tech employees come from ethnic minority backgrounds, but only 5% are Black.
- When it comes to leadership roles, ethnic diversity drops to 14%.
- Companies in the top 25% for racial and ethnic inclusion are 35% more likely to earn better-than-average profits.
- Diversity In Tech Statistics stated that only 6% of tech workers in the UK say they have a disability, compared to 23% of the general working-age population.
- Sixty per cent of large tech companies now run programs focused on improving accessibility for people with disabilities.
 (Source: aiprm.com)
- During the pandemic, 23% more women in tech said they felt burned out compared to men, showing the need for stronger mental health support—especially for disabled workers.
- Even though 15–20% of people in the UK are believed to be neurodivergent, only 3% of tech employees have shared this with their employers.
- Nearly 90,000 people with both visible and hidden disabilities are estimated to be “missing” from the UK tech workforce.
- Just 9% of tech workers in the UK come from low-income families, although this group makes up 39% of the overall population in the UK.
- Approximately 45% of people working in tech have parents who hold professional or management roles.
 (Reference: zippia.com)
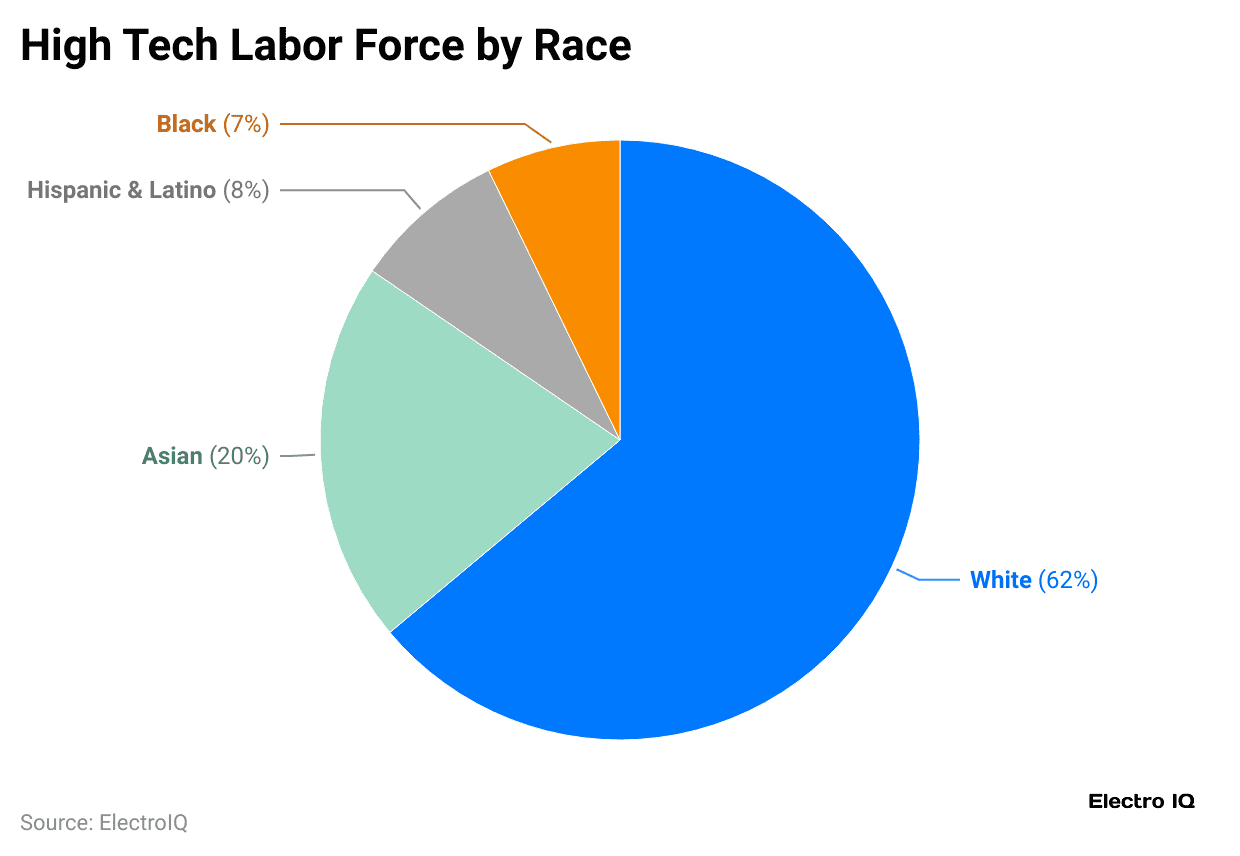
- In the above chart, we can see the high-tech labour force by race statistics.
- Still, another 45% come from families where neither parent went to college, showing signs of progress in social mobility.
- Today, approximately 30% of entry-level tech jobs are held by individuals from underrepresented or lower-income backgrounds.
- Seventy per cent of tech internships now include pay or financial assistance, making it easier for students from less affluent families to participate.
- Only 0.09% of tech employees identify as non-binary, possibly because many company systems don’t yet allow for proper reporting.
- Trans workers make up 17% of the tech workforce, which is much higher than the 0.5% seen in the general U.K. working population.
- Around 26% of tech companies have policies that allow trans employees to share their identity safely without fear of bias.
- Over 40% of large tech companies have employee resource groups for LGBTQIA+ staff.
- LGBTQIA+ employees in tech are 20% less likely to be promoted than their straight or cisgender coworkers.
Tech Industry Demographics by Location
- According to the 2024 ‘State of the Tech Workforce’ report by CompTIA, women constituted just 27% of all tech occupations in the United States, compared to 49% of all jobs in the United States.
- According to BLS data, the average weekly salary for a female in the tech industry in 2003 was USD 1,005, which is almost 16% less than the typical male tech worker.
- A woman in the United States working in the tech industry earns a salary that is 83.6% higher than that of her male counterparts in 2024.
 (Source: aiprm.com)
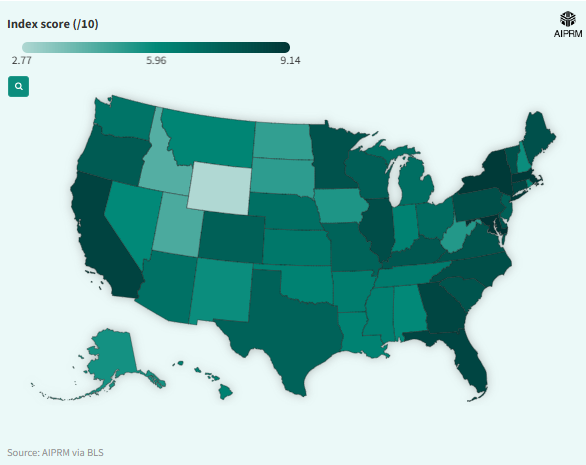
| State | Number of female tech workers (000s) | Median weekly earnings ($) | Women’s earnings as a percentage of men’s | Percentage change in employment (male vs. female) | Index score (/10) |
|
North Carolina |
1,853 | 904 | 85.8 | -12% | 8.17 |
| Illinois | 2,080 | 1,055 | 83.6 | -17% |
8.18 |
|
Illinois |
2,080 | 1,055 | 83.6 | -17% | 8.18 |
| Georgia | 1,810 | 976 | 88.5 | -16% |
8.46 |
|
Florida |
3,822 | 926 | 87.9 | -14% | 8.49 |
| Connecticut | 600 | 1,194 | 88.2 | -15% |
8.49 |
|
California |
5,839 | 1,118 | 89.9 | -24% | 8.58 |
| New York | 3,200 | 1,090 | 84.2 | -13% |
8.93 |
|
Massachusetts |
1,211 | 1,331 | 87.2 | -15% | 8.96 |
| Maryland | 1,142 | 1,296 | 88.5 | -12% |
9.14 |
#1. United States
- Women hold approximately 26% of computing jobs in the U.S., according to information from the National Centre for Women & Information Technology.
- When it comes to race and ethnicity, the Equal Employment Opportunity Commission reports that Hispanics make up around 8% of tech roles, and Black Americans represent about 7%.
#2. United Kingdom
- About 19% of tech jobs in the UK are held by women, according to Tech Nation.
- People from Black, Asian, and other minority ethnic groups make up roughly 15% of the tech workforce.
#3. Canada
- Around 25% of tech workers in Canada are women.
- The largest visible minority groups in Canada’s tech sector include South Asian, Chinese, and Black communities, who together make up about 22% of the industry.
#4. Australia
- According to government statistics, women comprise approximately 29% of the country’s IT workforce.
- Roughly 11% of tech workers have non-European backgrounds, based on data from the Workplace Gender Equality Agency.
#5. Germany
- In Germany, women comprise approximately 16% of the tech workforce, according to Bitkom.
- About 14% of tech workers are either immigrants or come from migrant families.
#6. India
- Women comprise approximately 34% of India’s IT workforce, according to the National Association of Software and Service Companies (NASSCOM).
Gender Pay Gap In Tech Statistics
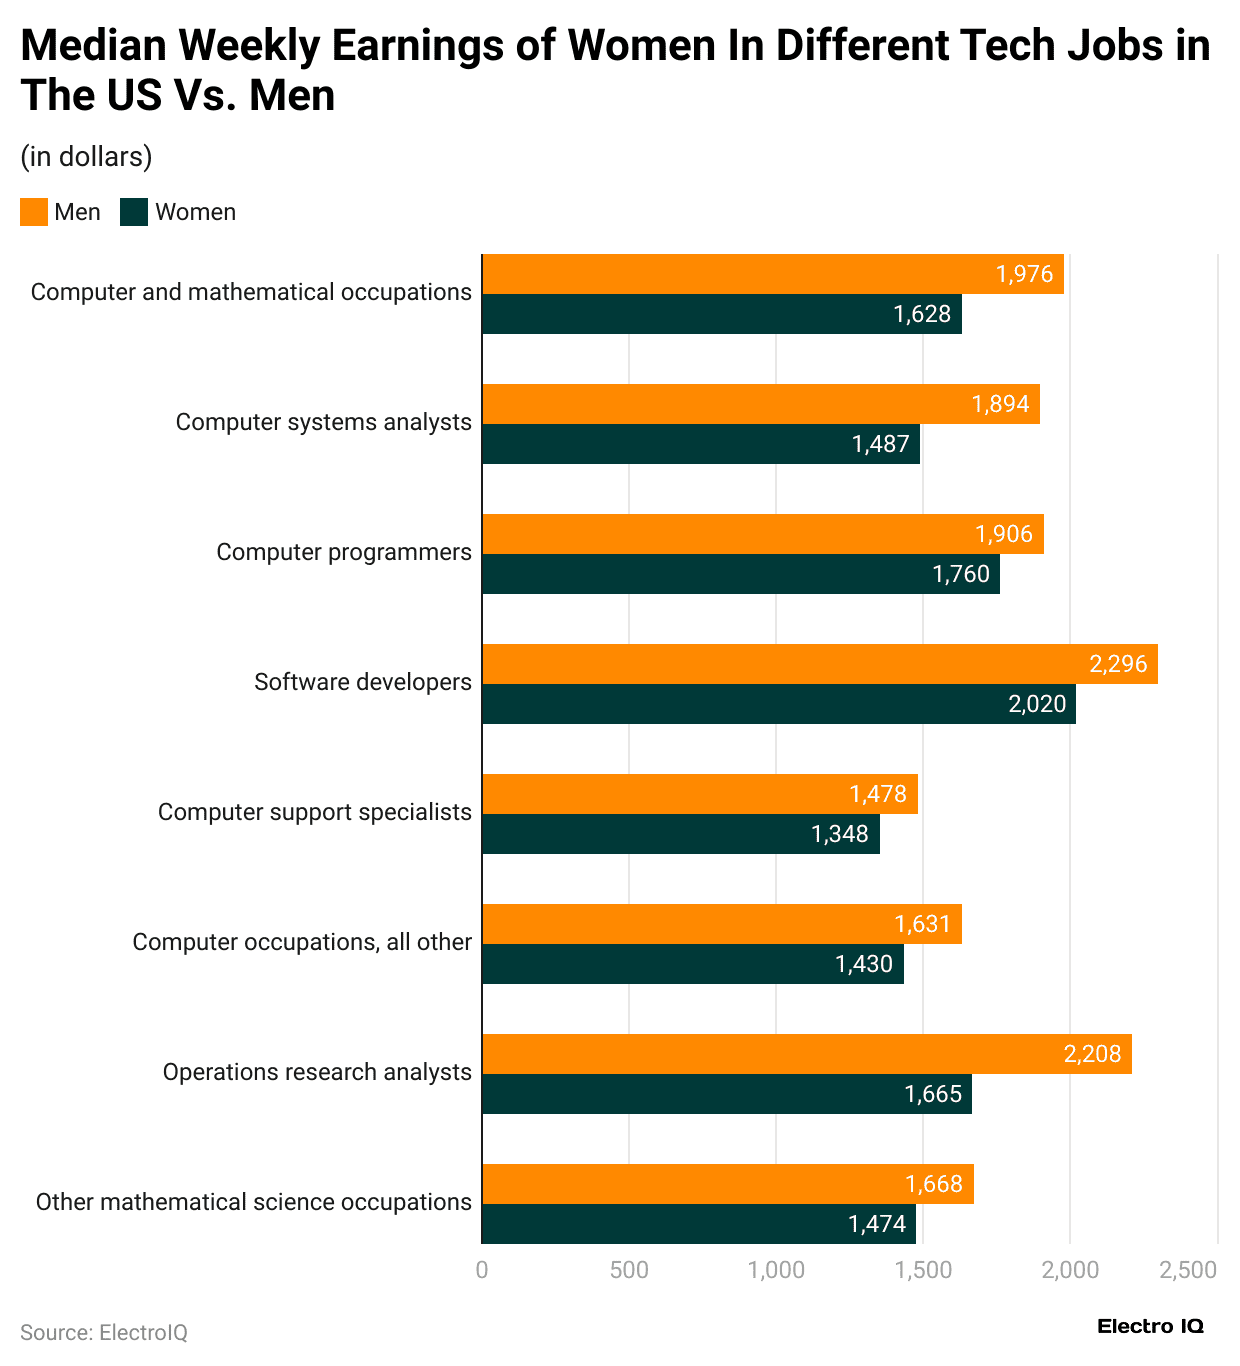
- A recent review of eight tech jobs in the U.S. by AIPRM found that men are typically paid more than women, even when they hold the same role.
- The biggest pay gap was found in operations research analyst positions. On average, women in this role earn 25% less than men each week.
- Men earn approximately $2,208 weekly, while women take home around $1,665 for performing the same job.
 (Reference: aiprm.com)
| Tech occupation | Median weekly earnings (overall) ($) | Median weekly earnings (men) ($) | Median weekly earnings (women) ($) | Percentage change (women vs. men) |
|
Other mathematical science occupations |
1,595 | 1,668 | 1,474 | -12% |
| Operations research analysts | 1,917 | 2,208 | 1,665 |
-25% |
|
Computer occupations, all other |
1,597 | 1,631 | 1,430 | -12% |
| Computer support specialists | 1,424 | 1,478 | 1,348 |
-9% |
|
Software developers |
2,283 | 2,296 | 2,020 | -12% |
| Computer programmers | 1,889 | 1,906 | 1,760 |
-8% |
|
Computer systems analysts |
1,701 | 1,894 | 1,487 | -21% |
| Computer and mathematical occupations | 1,890 | 1,976 | 1,628 |
-18% |
- According to 2023 data, the smallest gender pay gap in the tech industry is observed for computer programmers, where men earn 8% more per week than women.
- Female computer programmers in the United States are predicted to get USD1760 every week to USD1906 for males.
Conclusion
The tech industry is making progress in terms of diversity, but there’s still a lot of work to be done. Women, people of colour, LGBTQIA+ individuals, people with disabilities, and those from lower-income families are still not fully represented—especially in leadership roles. Fixing this gap isn’t just the right thing to do; it also helps businesses grow stronger, become more creative, and better serve different types of customers.
By hiring fairly, providing everyone with equal opportunities, and fostering workplaces where all employees feel safe and respected, the tech industry can become a place where everyone has a fair chance at success. We have shed enough light on Diversity in Tech Statistics through this article.