Home Decor Statistics By Revenue, Market Size and Technology Trend (2025)
Updated · Dec 09, 2025


Table of Contents
- Introduction
- Editor’s Choice
- General Home Decor Statistics
- Home Decor Market Size
- By Product Types
- By Country
- By Distribution Channel
- By Segmental Analysis
- By Sales Channel
- US Home Decor Market Size
- Home Decor Owner Demographic Statistics
- Decorative Pillow Market Statistics
- Wall Art Market Statistics
- Mugs And Kitchenware Statistics
- Carpets And Rugs Market Statistics
- Blanket Market Statistics
- Furniture Market Size
- Textiles Market Statistics
- Floor Covering Market Statistics
- Smart Lighting Market Statistics
- Top 10 Home Decor Companies Analysis
- Key Factors Driving Online Home Decor Purchases
- Popular Smart Home Technology Trends
- Conclusion
Introduction
Home Decor Statistics: Home decor refers to the arrangement and design of a home’s interior and exterior to make it visually appealing and functional for its occupants. It includes many products, such as furniture, textiles, kitchen and dining items, bathroom and living room accessories, and floor materials like tiles, carpets, rugs, wood, and vinyl. What started as a simple interest has now grown into a major global industry.
Changes in lifestyle, online shopping, and a desire for comfortable spaces have led people to spend more on home decor. To understand this fast-growing market, it is important to look at the latest statistics. These numbers indicate how people’s tastes are changing and which opportunities are emerging in the décor industry.
Editor’s Choice
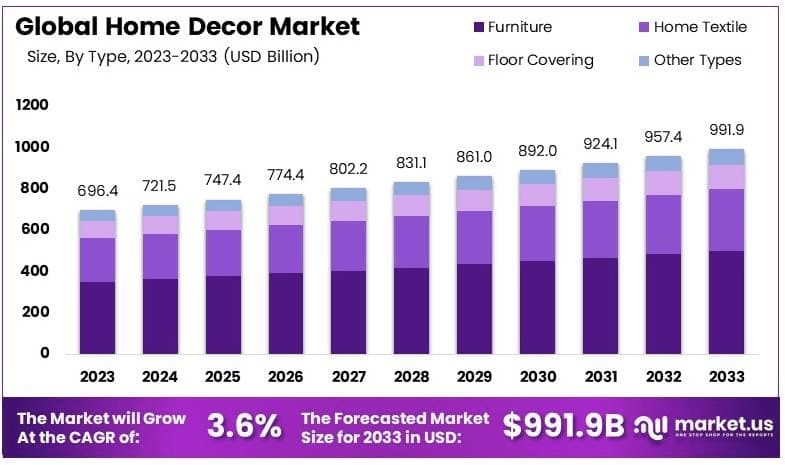
- The global home decor market is projected to reach USD 991.9 billion by 2033, up from USD 696.4 billion in 2023, reflecting a stable 3.6% CAGR from 2024 to 2033.
- In 2025, revenue expansion is expected to remain strong, with candles generating USD 11.51 billion, while carpets and rugs continue to lead the category with USD 51.87 billion in sales.
- As of 2024, the United States holds a leading position in the global home decor market, with USD 35,440 million in revenue, followed by China with USD 21,160 million and Germany with USD 7,278 million, indicating the influence of major consumer economies on market performance.
- Specialty stores account for the largest share of distribution channels worldwide at 46%, demonstrating the continued preference for dedicated retail formats within the home decor sector.
- The market is segmented across several subcategories, where bedroom furniture accounts for 25%, home textiles for 19%, sitting furniture for 15%, dining furniture for 8%, home office units for 6%, living room furniture for 5%, window coverings for 2%, and other categories collectively for 10%.
- In the United States, the home decor market is projected to expand further, reaching USD 39.58 billion in 2025, reflecting continued demand for home improvement and lifestyle enhancement products.
- Sustainability influences purchasing choices: 44% of the Silent Generation and 39% of Baby Boomers prefer home decor brands that follow environmentally responsible practices.
- Price remains the strongest driver of online home decor purchases, influencing 55% of consumers in their digital purchasing decisions.
- Online sales in this sector are projected to rise from 32.8% in 2025 to 37.7% in 2029, indicating the continued shift toward e commerce channels.
- The Home Depot, recognized as the largest home decor retailer in the world, reported around USD 157 billion in revenue in 2024, supported by a steady 6.10% CAGR over the previous five years.
General Home Decor Statistics
- According to Persistence Market Research, the global home decor market is projected to reach approximately USD 770 million in 2025 and increase to nearly USD 1,047.9 million by 2032, with a 4.5% CAGR.
- The furniture category is expected to retain its dominant position in 2025, with a 40% share, reflecting its continued importance in household spending.
- The indoor segment is expected to lead the market, accounting for 70% of the market, driven by rising demand for interior upgrades and lifestyle enhancements.
- North America is projected to account for 38% of global revenue in 2025, reflecting robust consumer spending and increased adoption of premium home decor products.
- The Printful Blog estimates that the U.S. home decor market will reach approximately USD 203.1 billion by 2033, indicating sustained long-term growth supported by rising home improvement activities.
- Europe’s home decor market is expected to achieve USD 38.7 billion in 2025 and climb to nearly USD 42.1 billion by 2029, reflecting steady demand across major economies.
- Mordor Intelligence reported that floor coverings accounted for 36.21% of the global home decor market in 2024, indicating that flooring remains a major expenditure category in residential upgrades.
- Textiles are projected to expand at the fastest pace, with a 7.64% yearly growth rate between 2025 and 2030, supported by rising interest in soft furnishings and seasonal décor updates.
- Specialty outlets accounted for 46.98% of home decor sales in 2024, while DIY and mass-market retailers are forecasted to grow at 8.28% annually due to increasing cost-conscious consumer behavior.
- Mass and value products accounted for 61.23% of the market in 2024. However, premium goods are expected to grow at a 7.23% rate as consumers show greater interest in high-quality, durable decorative items.
- North America captured 42.56% of the global market share in 2024, while the Asia Pacific region is expanding rapidly at an 8.49% CAGR, driven by urbanization and rising household incomes.
- Major industry participants include Inter IKEA Systems B.V., Home Depot Product Authority LLC, Wayfair Inc., Ashley Global Retail LLC, and MillerKnoll Inc., reflecting a mix of global retailers and large-scale manufacturers.
- The rising trend of home personalization, growth in e-commerce, and increased consumer spending on renovation projects continue to influence market expansion across countries such as the U.S., Germany, the U.K., India, and Japan.
- Notably, online décor purchases in the U.S. have exceeded USD billions in annual revenue. At the same time, Europe shows strong demand for sustainable and minimalist interior styles, and Asia-Pacific countries demonstrate higher adoption of affordable mass-market décor products.
Home Decor Market Size
(Source: market.us)
- The Global Home Decor Market is projected to reach USD 991.9 billion by 2033, rising from USD 696.4 billion recorded in 2023, and this long-term expansion reflects a stable 3.6% CAGR during the period from 2024 to 2033.
- Steady household investment trends have supported market growth, as many homeowners continue improving their living spaces with practical and affordable upgrades. A survey by Opendoor indicated that 66% of homeowners preferred low-cost enhancements such as new paint, while 49% refreshed their interiors by rearranging furniture.
- The same survey found that 41% of homeowners favoured open layouts connecting the kitchen, dining, and living areas, indicating a strong preference for designs that enhance spatial utility and overall functionality.
- Rising personal income levels have strengthened consumer spending capacity across key economies. In the United States, personal income increased by USD 50.5 billion in August, while disposable personal income rose by USD 34.2 billion, providing households with greater financial flexibility to allocate funds to home decor purchases.
- Interest in interior design has increased significantly due to television programs, online home improvement platforms, and design-focused social media content. According to the U.S. Bureau of Labour Statistics, employment of interior designers is expected to grow by 4% between 2022 and 2032, reflecting rising demand for decorative products and design services across the United States.
- New homeowners continue to play an important role in market expansion. A 2022 report from the National Association of Home Builders found that buyers of new homes spend an average of USD 12,000 on renovations, USD 5,000 on furnishings, and USD 4,000 on appliances in the first year, indicating strong spending across multiple home decor categories.
- In 2023, the furniture segment accounted for 50.4% of the global market, driven by increasing consumer preference for comfort-oriented, durable, and multifunctional designs that support modern living needs across regions such as the United States, Canada, Germany, and Japan.
- Speciality stores held a leading 45% share of the distribution channel in 2023, reflecting strong demand for curated, high-quality products that match specific style preferences in key markets, including the United States and the United Kingdom.
- North America accounted for 39.7% of the global market in 2023, supported by high household spending, rising renovation activity, and a strong do-it-yourself culture in the United States and Canada.
- Additional consumer insights indicate that more than 60% of young homeowners prefer multifunctional furniture, and nearly 55% of shoppers consider sustainability a key purchasing factor, with strong adoption across markets such as the United States, Germany, and Australia
By Product Types
(Reference: market.us)
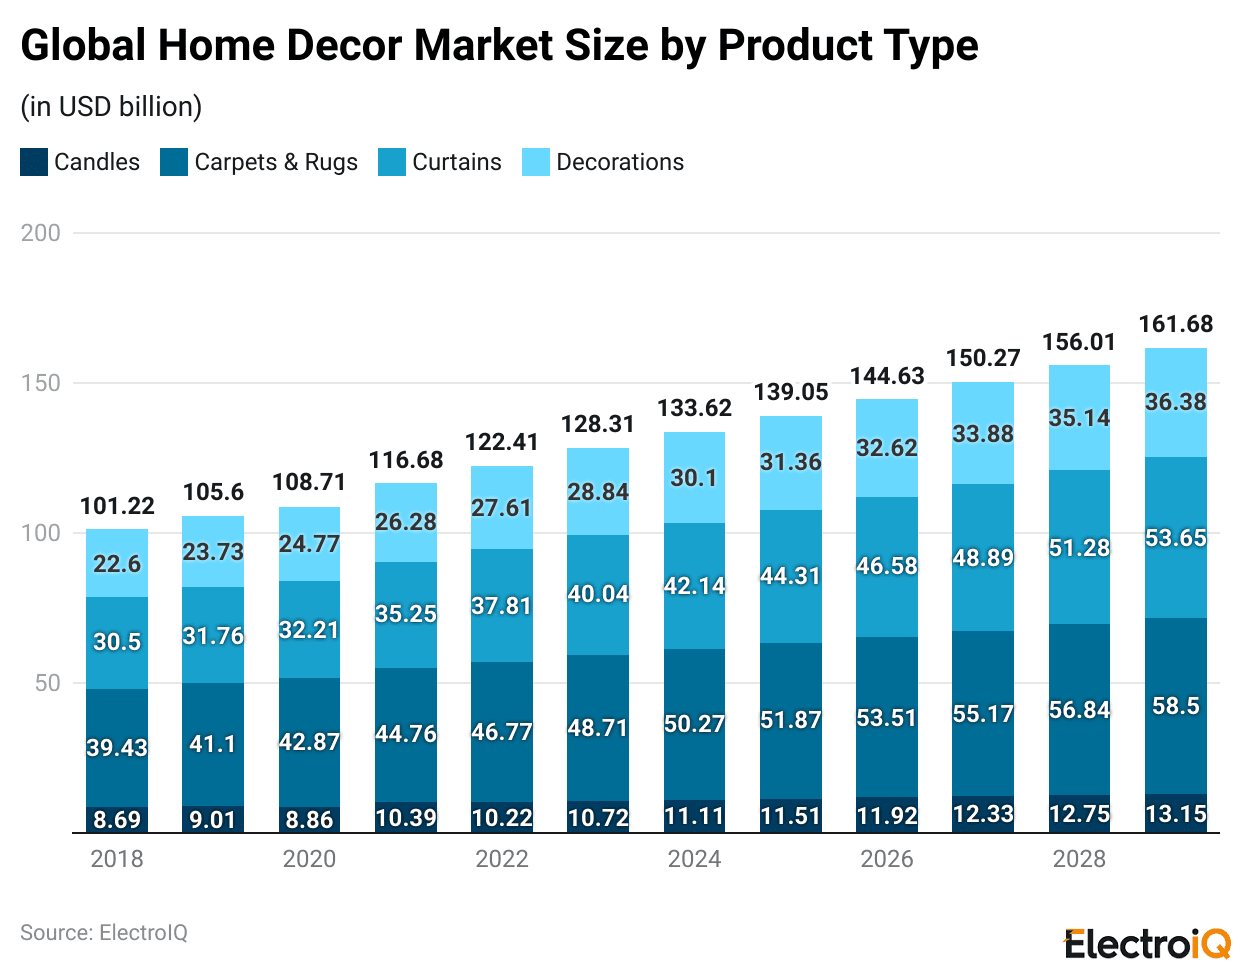
- In the home decor market, the candles segment will generate the highest revenue of USD 11.51 billion by 2025, followed by the carpets and rugs segment (USD 51.87 billion).
- Curtains are estimated to generate approximately USD 44.31 billion, followed by decorations, which are estimated to generate USD 31.36 billion.
The other categories’ revenue analysis is stated in the table below:
|
Year
|
Candles | Carpets & Rugs | Curtains | Decorations |
| Market Size (USD billion) | ||||
| 2026 | 11.92 | 53.51 | 46.58 | 32.62 |
| 2027 | 12.33 | 55.17 | 48.89 | 33.88 |
| 2028 | 12.75 | 56.84 | 51.28 | 35.14 |
| 2029 | 13.15 | 58.5 | 53.65 | 36.38 |
- In 2025, the candles category is projected to generate USD 11.51 billion, making it one of the fastest-growing segments in the selected countries. This growth reflects rising consumer interest in scented and decorative candles, supported by premiumization trends and a growing gifting culture.
- The carpets and rugs segment is projected to generate USD 51.87 billion in 2025, representing a substantial share of overall home decor spending. Demand is sustained by renovation activity and a greater preference for textured floor coverings across urban households.
- Curtain sales are projected to reach USD 44.31 billion in 2025. This performance is linked to increased home-improvement investments and the rising adoption of energy-efficient window treatments in both developed and emerging markets.
- Decorative items will account for USD 31.36 billion in 2025. This category continues to benefit from lifestyle shifts, with consumers placing higher value on aesthetic enhancements in living spaces.
- By 2026, candles are expected to reach USD 11.92 billion, reflecting steady year-on-year growth of 3.5%, driven by greater retail penetration and higher spending on ambience-focused home accessories.
- Carpets and rugs are projected to reach USD 53.51 billion in 2026, reflecting a 3.2% increase, supported by upgrades in residential flooring and the wider availability of customizable designs across the selected regions.
- Curtain revenues may rise to USD 46.58 billion in 2026, representing a 5.1% uplift as consumers continue to value privacy-enhancing and climate-friendly fabrics.
- The decorations segment is projected to reach USD 32.62 billion in 2026, up 4.0%, driven by seasonal product demand and broader adoption of digital commerce.
- In the final forecast year, 2029, candles could reach USD 13.15 billion, showing sustained interest in aromatherapy and handcrafted variants across major markets.
- Carpets and rugs may generate USD 58.50 billion in 2029, indicating continued structural demand created by home renovation cycles and growth in the premium flooring segment.
- Curtain sales are projected to reach USD 53.65 billion in 2029, driven by higher household formation rates and increased preference for personalised interior styling.
- Decorations could reach USD 36.38 billion in 2029, reflecting a rising adoption of themed collections and digitally influenced home styling trends.
- On a per capita basis, candles are projected to reach USD 1.47 million in 2025 across selected countries, increasing to USD 1.51 million in 2026 and USD 1.63 million by 2029 as premium candle formats gain traction.
- Carpets and rugs are projected to generate USD 6.64 million per capita in 2025, increasing to USD 6.80 million in 2026 and USD 7.26 million in 2029, driven by increased investment in home comfort products.
- Curtains may generate USD 5.67 million per capita in 2025, rising to USD 5.91 million in 2026 and USD 6.66 million by 2029, supported by growth in both functional and decorative fabric solutions.
- Decorations are expected to deliver USD 4.01 million per capita in 2025, reaching USD 4.14 million in 2026 and USD 4.51 million in 2029 as consumers increasingly prioritise interior personalisation.
The table below elaborates on the average revenue per capita of different home decor products:
|
Year
|
Candles | Carpets & Rugs | Curtains | Decorations |
| Market Size (USD billion) | ||||
| 2025 | 1.47 | 6.64 | 5.67 | 4.01 |
| 2026 | 1.51 | 6.8 | 5.91 | 4.14 |
| 2027 | 1.55 | 6.95 | 6.16 | 4.27 |
| 2028 | 1.59 | 7.11 | 6.41 | 4.39 |
| 2029 | 1.63 | 7.26 | 6.66 | 4.51 |
By Country
(Source: cretekala.com)
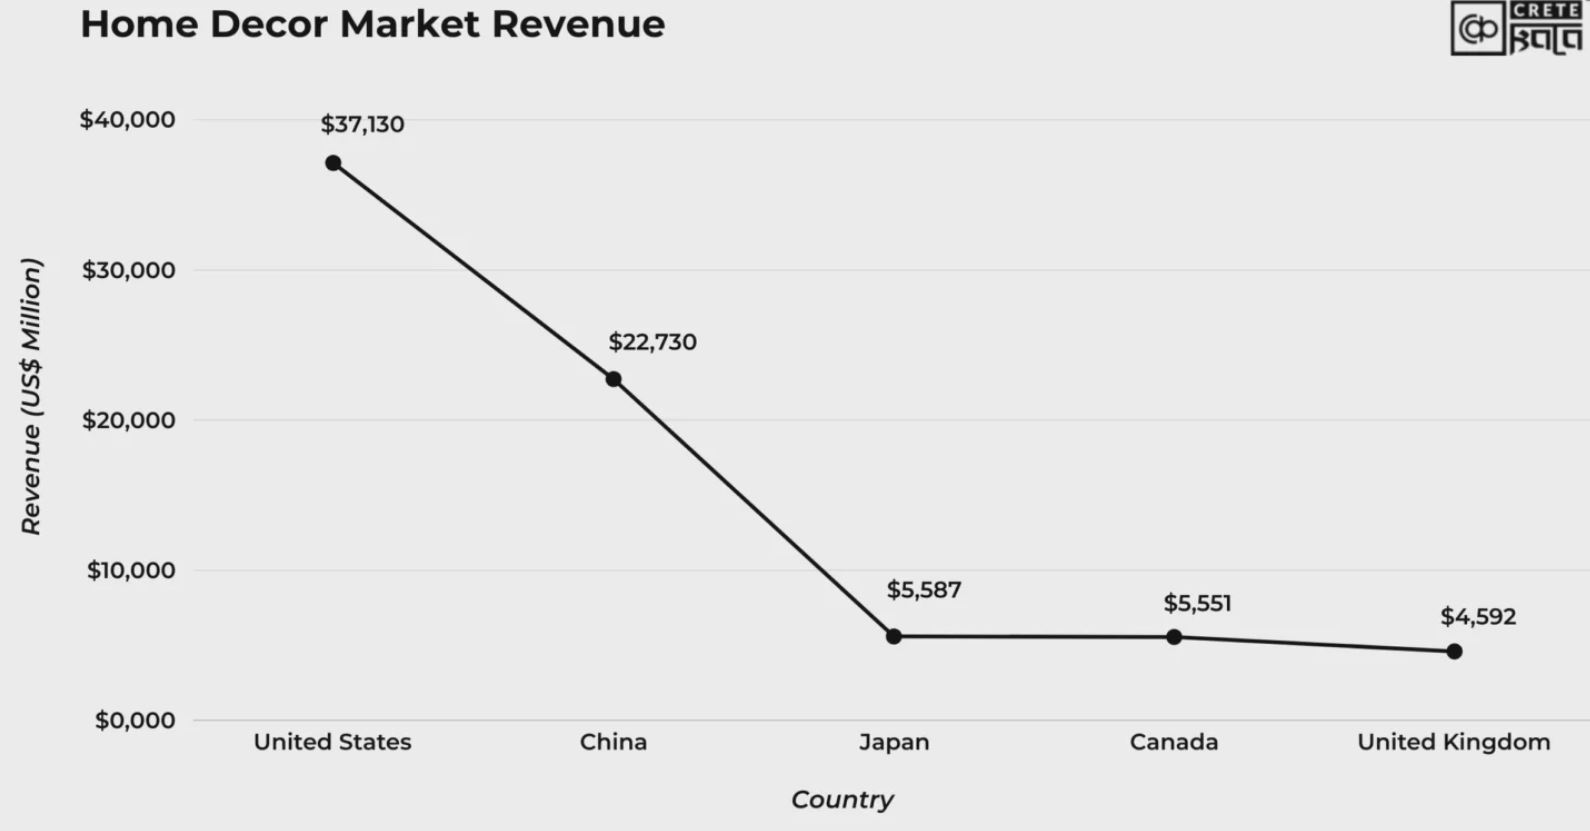
- In the United States, the home decor market generated approximately USD 37,130 million, accounting for roughly 49.1% of the combined revenue of the selected countries, making it the largest single market in this comparison.
- China recorded home decor revenue of around USD 22,730 million, representing close to 30.1% of the total, indicating that nearly one third of spending among these markets comes from Chinese consumers.
- Japan’s home decor market reached approximately USD 5,587 million, representing roughly 7.4% of total revenue, indicating a solid but smaller scale than in the United States and China.
- Canada reported home decor revenue of approximately USD 5,551 million, accounting for nearly 7.3% of total, placing its market size very close to that of Japan in absolute USD terms.
- In the United Kingdom, home decor revenue amounted to approximately USD 4,592 million, representing nearly 6.1% of the combined market, making it the smallest of the five segments but still a multi-billion-dollar segment.
- Taken together, these five countries generated approximately USD 75.59 billion in home decor revenue, with the United States and China alone accounting for nearly 79% of this amount, highlighting a pronounced concentration of spending in the two largest economies.
(Reference: market.us)
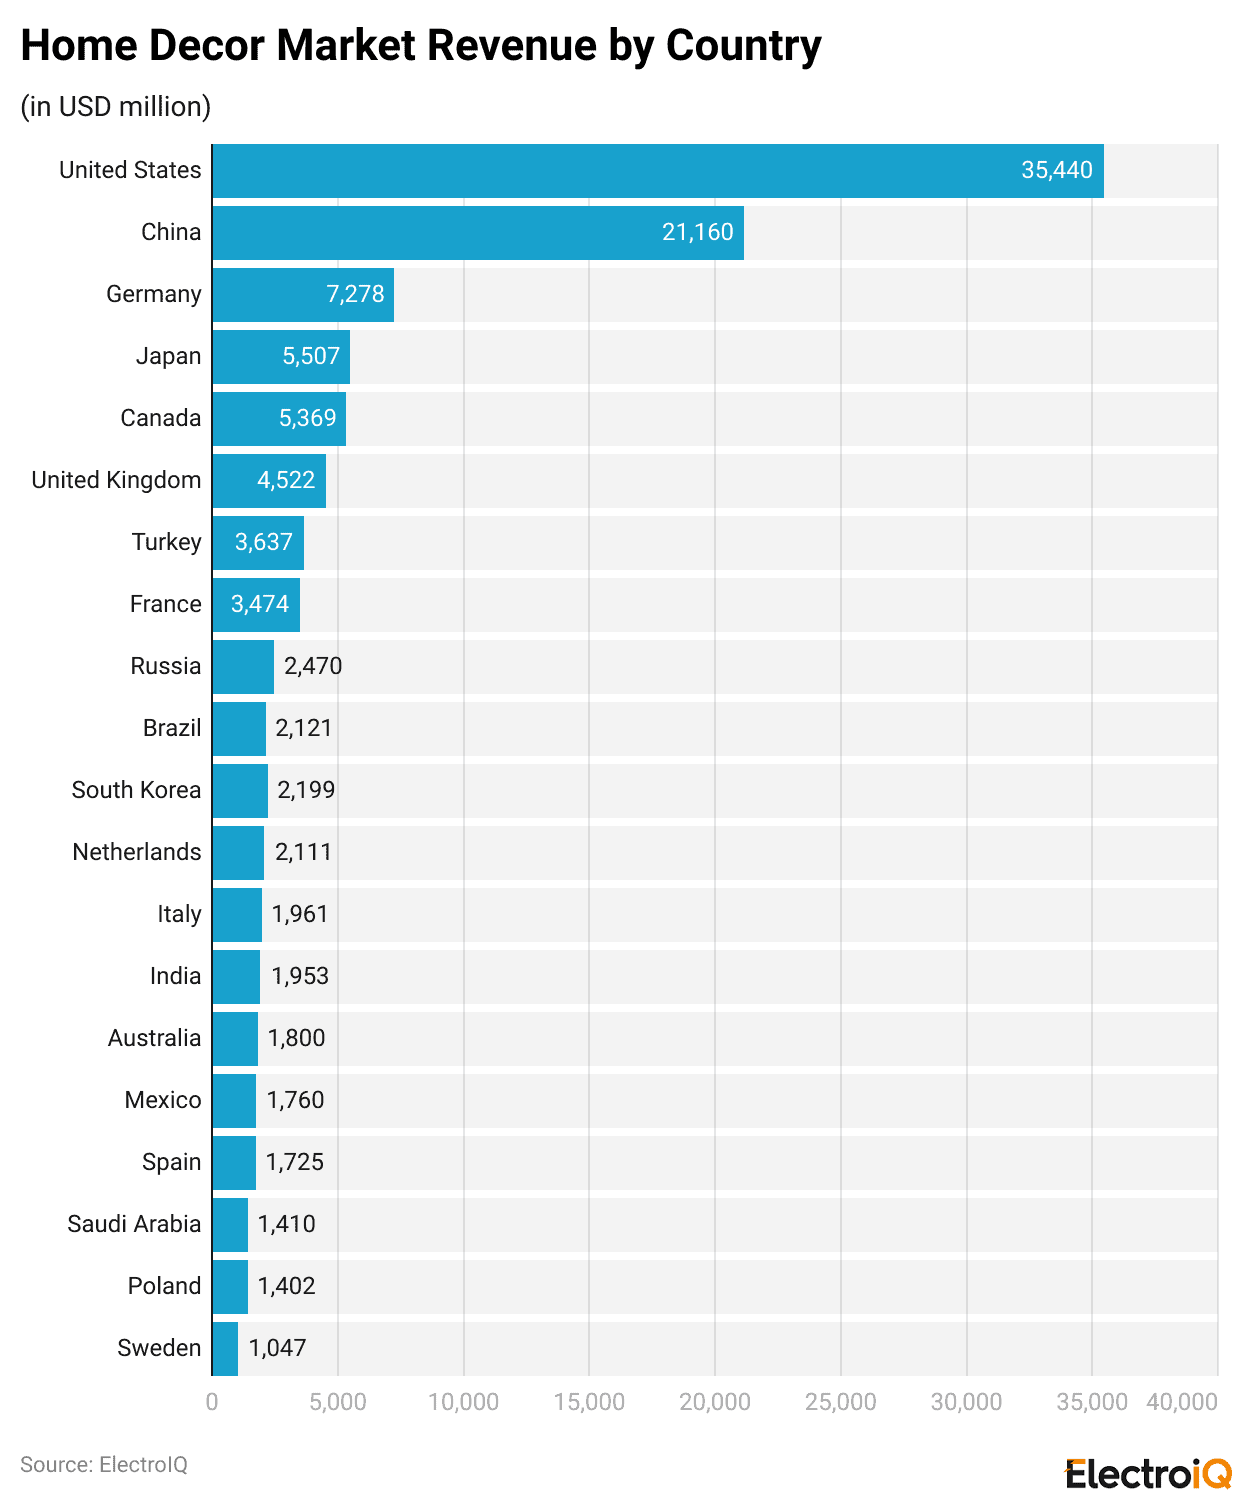
- As of 2024, the United States accounted for the highest revenue with USD 35,440 million, followed by China (USD 21,160 million), Germany (USD 7,278 million), Japan (USD 5,507 million), Canada (USD 5,369 million), and the United Kingdom (USD 4,522 million).
- Furthermore, other countries’ revenues are followed by Turkey (USD 3,637 million), France (USD 3,474 million), Russia (USD 2,470 million), Brazil (USD 2,121 million), South Korea (USD 2,199 million), Netherlands (USD 2,111 million), Italy (USD 1,961 million), India (USD 1,953 million), Australia (USD 1,800 million), Mexico (USD 1,760 million), Spain (USD 1,725 million), Saudi Arabia (USD 1,410 million), Poland (USD 1,402 million) and Sweden (USD 1,047 million).
By Distribution Channel
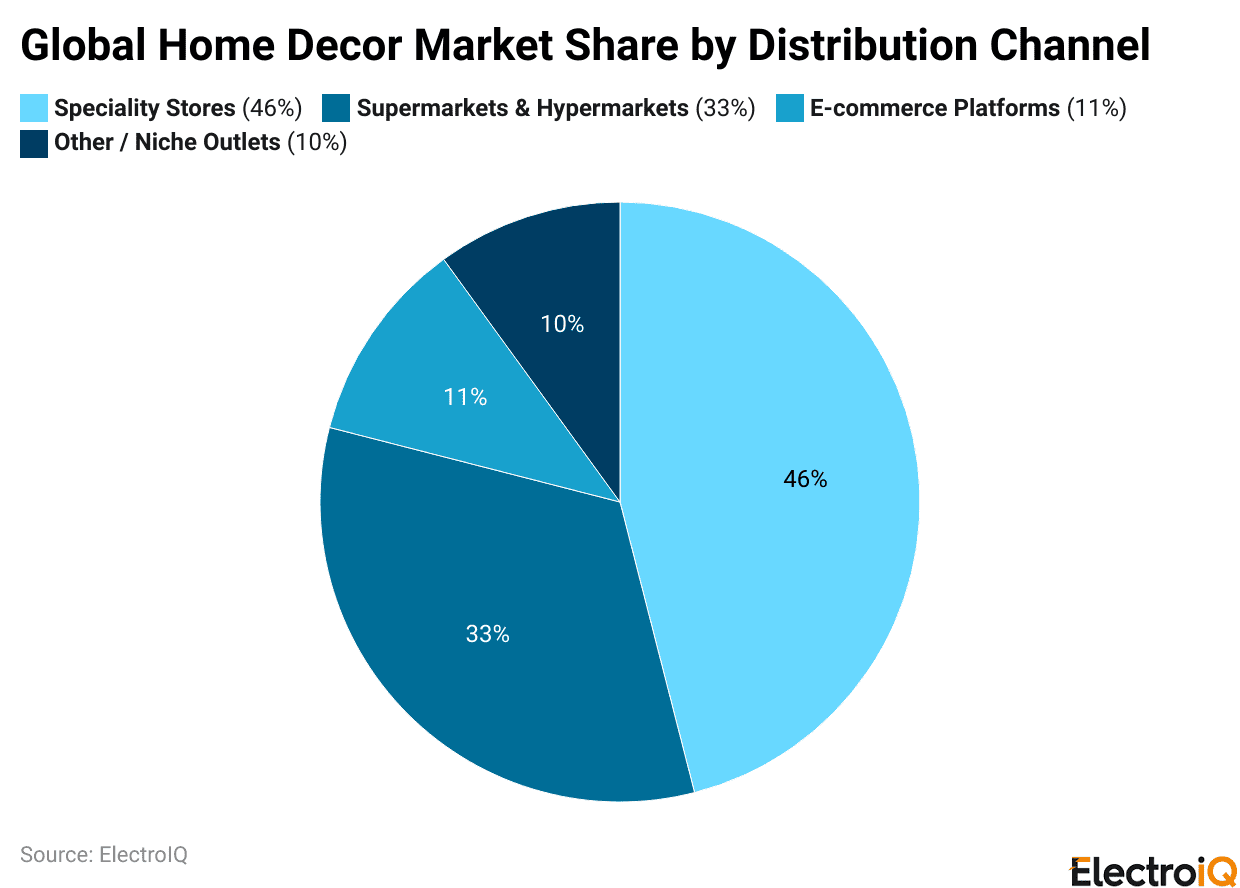
(Reference: market.us)
- As of 2024, the specialty stores accounted for the largest share at 46%, followed by supermarkets and hypermarkets (33%).
- E-commerce platforms make up 11% of the market, while other smaller or niche outlets account for the remaining 10%.
By Segmental Analysis
- According to cretekala.com, the home decor market is spread across several subcategories, with bedroom furniture (25%), home textiles (19%), sitting furniture (15%), dining furniture (8%), home office furniture (6%), living room furniture (5%), window covering (2%) and others (10%).
- In lighting, LED lamps account for 79%, followed by fixtures (10%), CFLs (8%), and other lamps (4%).
- Paint products are led by decorative paint at 96%, followed by lacquer and varnish (1%), and hardware (3%).
- Flooring includes floor covering at 81% and wall tiles at 19%, while sanitary items feature sanitary and faucet ware (93%) and kitchen sinks (7%).
- Tools are divided between power tools (49%) and hand tools (51%). Outdoor products include outdoor furniture (98%) and barbecues (2%).
By Sales Channel
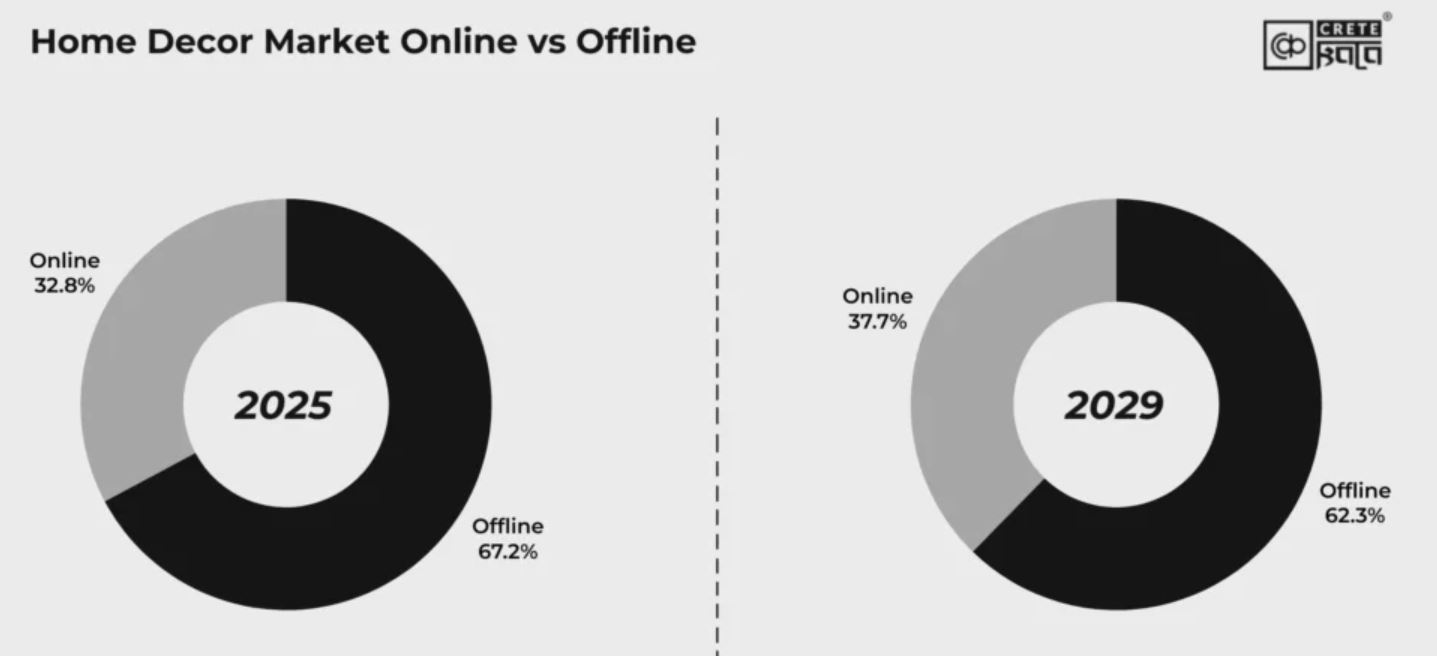
(Source: cretekala.com)
- The chart above indicates that online home decor sales are projected to increase from 32.8% in 2025 to 37.7% in 2029.
- Meanwhile, offline sales decrease from 67.2% to 62.3% (from 2025 to 2029).
US Home Decor Market Size
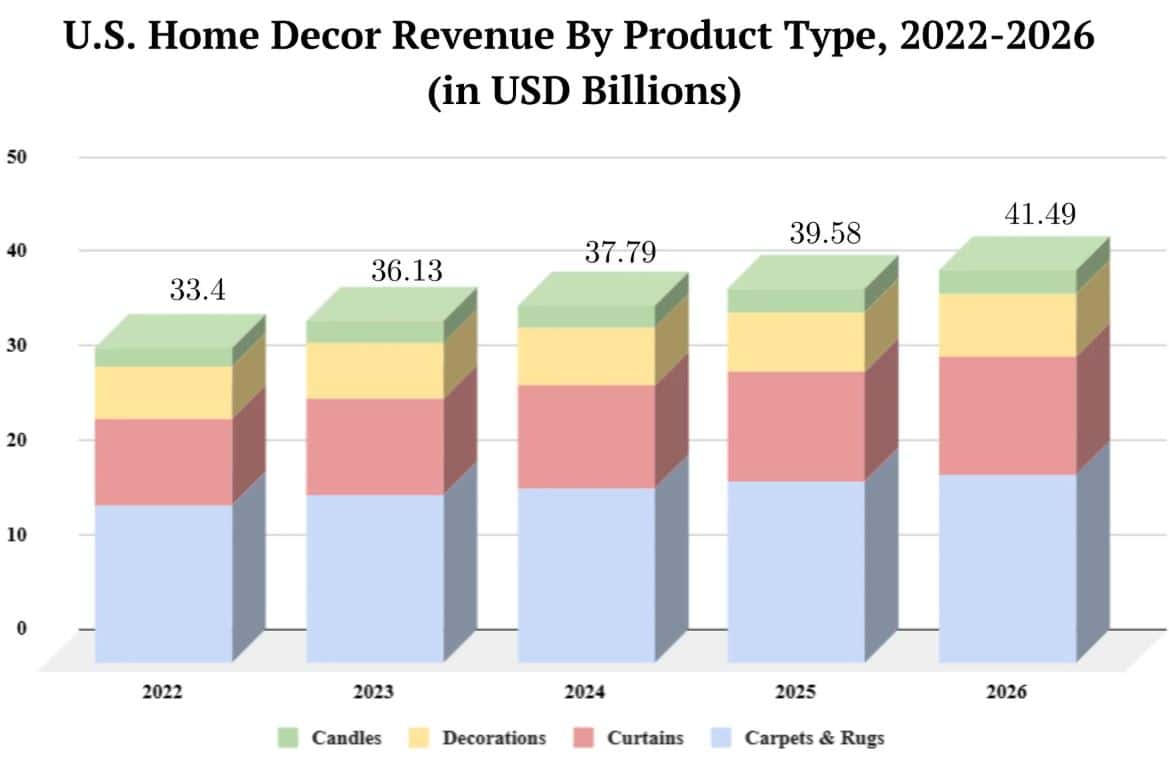
(Source: shopify.com)
- As of 2025, the home decor market in the United States is expected to reach USD 39.58 billion, up from USD 37.79 billion in 2024.
- By the end of 2026, the market size is projected to reach USD 41.49 billion.
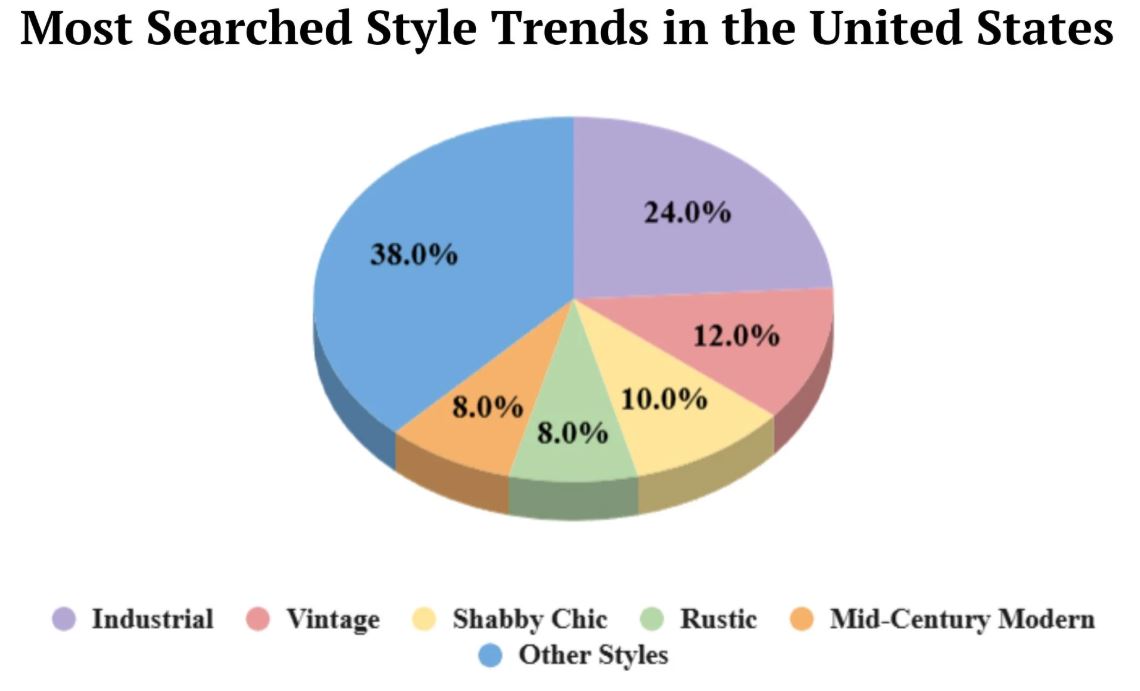
(Source: shopify.com)
- The chart indicates that Industrial style represents 24.0% of searches, Vintage 12.0%, Shabby Chic 10.0%, and both Rustic and Mid-Century Modern 8.0% each.
- It also shows that other Styles dominate the results, accounting for 38.0% of all searches.
Home Decor Owner Demographic Statistics
(Source: shopify.com)
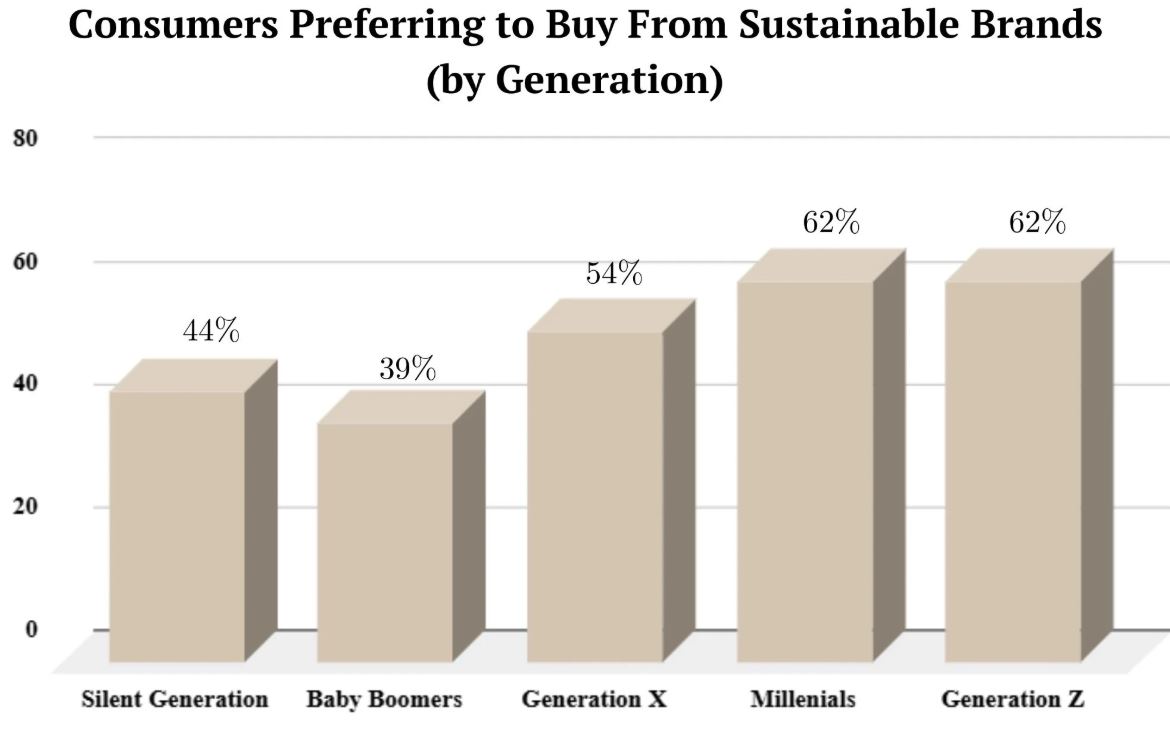
- The chart shows that 44% of the Silent Generation and 39% of Baby Boomers prefer to purchase home decor items from sustainable brands, whereas 54% of Generation X express the same preference.
- Meanwhile, around 62% of Millennials and 62% of Generation Z are choosing sustainable brands.
Decorative Pillow Market Statistics
- According to Business Research Insights, the decorative pillow market is projected to reach approximately USD 4.06 billion by 2025 and USD 7.28 billion by 2035, with a 6% CAGR.
- Approximately 38% of shoppers purchase these pillows to enhance home comfort and style, while rising raw material costs have increased production expenses by 17%.
- Eco-friendly and recycled options are becoming more popular, with new launches rising 29%.
- In 2023, North America held 35% of the market, Europe 31%, and Asia-Pacific 27%.
- The top five companies controlled 54% of global sales.
- Polyester pillows accounted for 46% of the market, cotton for 37%, and other materials for 17%.
- Smart ergonomic pillows also increased by 18% in new releases.
Wall Art Market Statistics
- MRFR reports that the global wall art market revenue totalled USD 64.06 billion in 2024 and is expected to reach USD 67.84 billion in 2025.
- By the end of 2035, the market may reach USD 120.37 billion, with a 5.9% CAGR.
- The North American region will account for the largest market value, reaching USD 25.6 billion by 2025.
- As of 2025, both dealers and auction houses are expected to separately capture the global wall art market, valued at USD 32 billion.
- Based on the material, the market size for canvas is estimated at USD 25 billion, followed by paper (USD 20 billion).
- In the same period, the modern art market will reach around USD 20 million, while fine art will account for USD 15 billion.
Mugs And Kitchenware Statistics
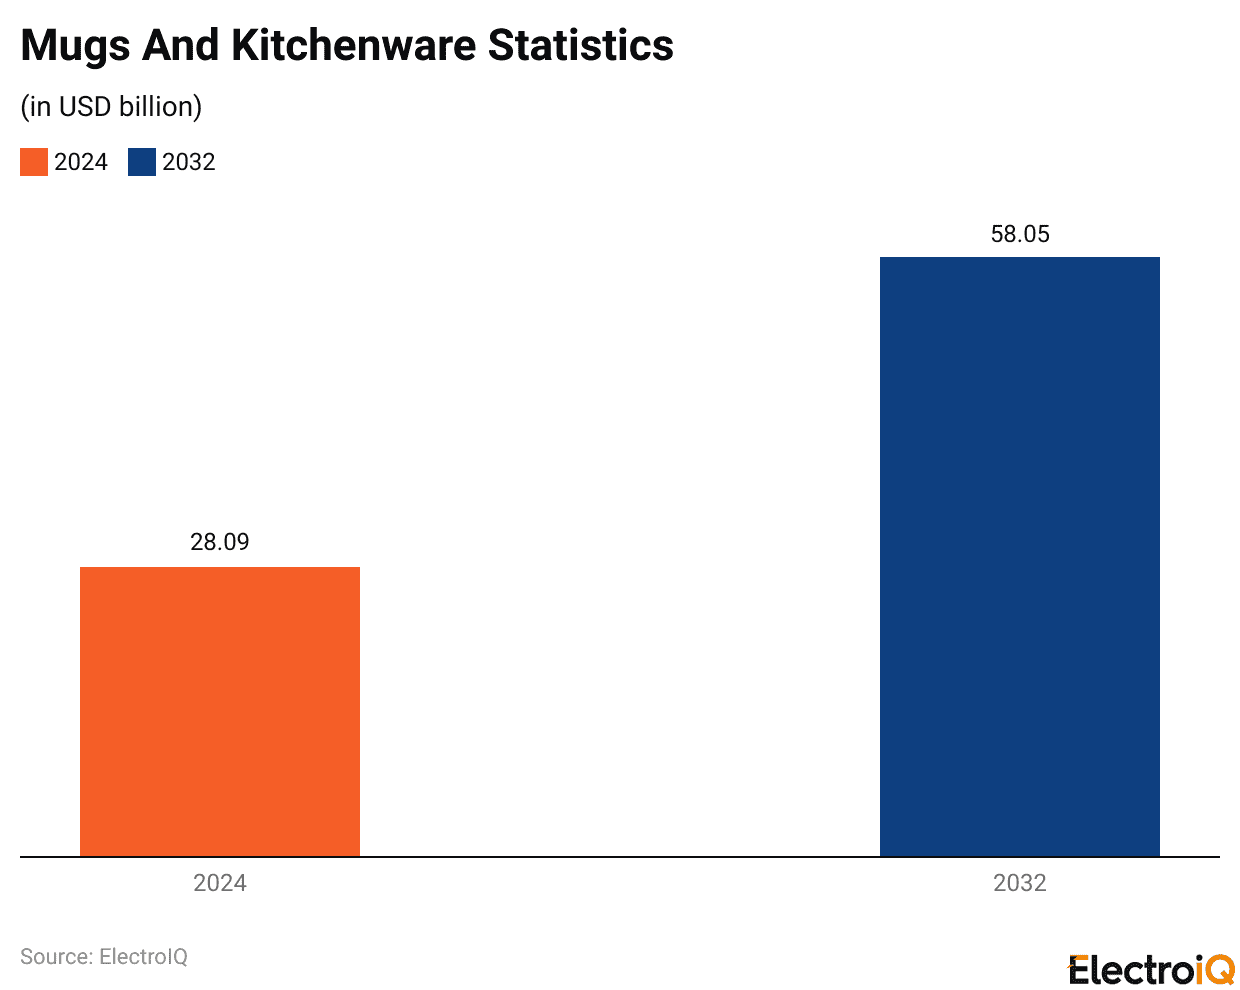
(Source: databridgemarketsearch.com)
- The mug market was accounted for USD 28.09 billion in 2024 and could reach USD 58.05 billion by 2032.
- From 2025 to 2032 growth rate is 9.50% CAGR.
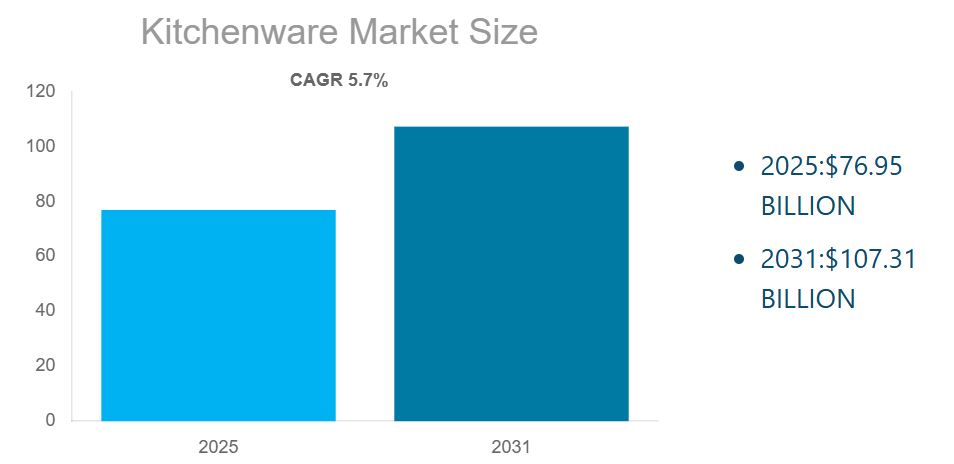
(Source: diligenceins.com)
- The global kitchenware market is estimated to reach around USD 76.95 billion by 2025 and USD 107.31 billion by 2031.
- The market is growing at a 5.7% CAGR from 2025 to 2031.
Carpets And Rugs Market Statistics
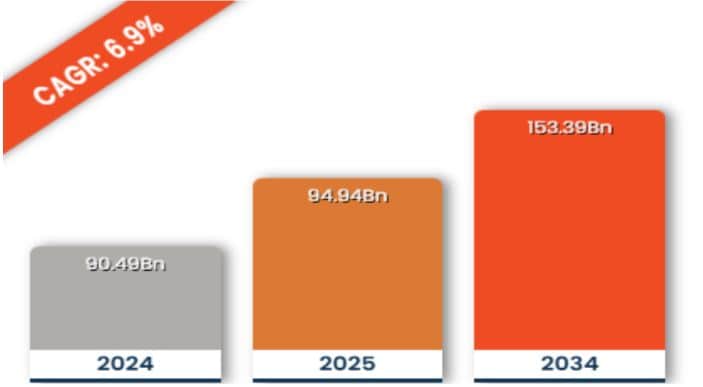
(Source: custommarketinsights.com)
- The graph above shows that in 2024, the global Carpets and Rugs market reached around USD 90.49 billion.
- By the end of 2025, the market is estimated to reach approximately USD 94.94 billion, and is projected to reach USD 153.39 billion by 2034.
- The market will grow at a CAGR of 6.9% from 2025 to 2034.
- As of 2024, the North American region accounted for the largest market valuations of USD 21.76 billion.
- According to futuremarketinsights.com, the carpet and rug market is led by tufted products at 63.7%, followed by woven at 11.2%, knotted (10.1%), needle-punched (9.5%), and other types (5.5%).
- Based on the material, the nylon material accounted for the highest share of 41.7%, followed by polyester (10.3%), Polypropylene (9.7%), Cotton (9.7%), Wool (8.7%), Silk (8.1%), Jute (7.6%) and others (4.3%).
- The carpet and rug market shows residential use at 60.4%, while commercial use accounts for the remaining 39.6% globally.
Blanket Market Statistics
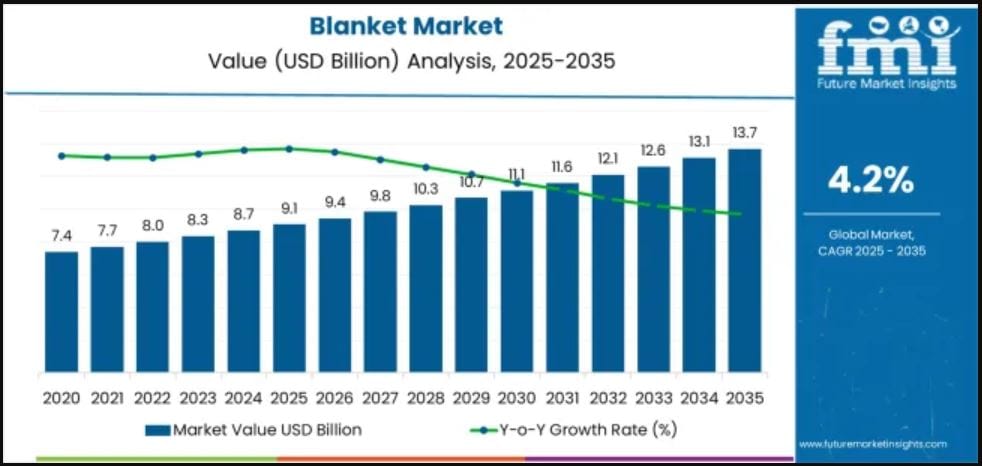
(Source: futuremarketinsights.com)
- The blanket market is projected to reach USD 9.1 billion by the end of 2025 and USD 13.7 billion by 2035, with a 4.2% CAGR.
- Among all product types, electric blankets accounted for the largest share in 2025, at 52.4%.
- Wool accounts for about 33.8% of the material used, while residential end users account for roughly 62.5%.
- From 2025 to 2035, the United States market is projected to grow at a CAGR of 5.4%.
- Following are Germany (5.1%), Japan (4.3%), China (6.9%), and Australia (4%).
Furniture Market Size
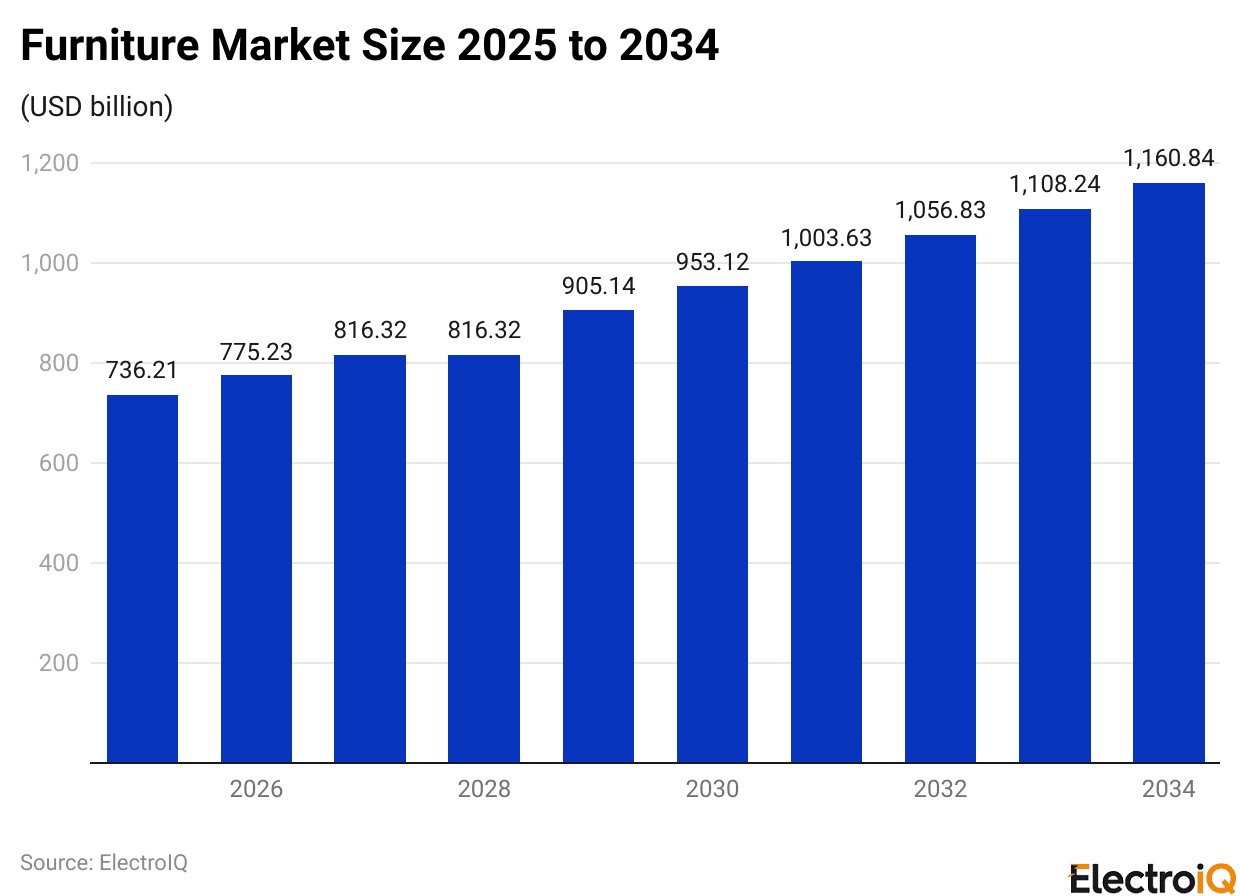
(Reference: precedenceresearch.com)
- By 2025, the global furniture market valuation is projected to reach approximately USD 736.21 billion and is expected to grow at a CAGR of 5.2% from 2025 to 2034.
- In the coming years, the market size is expected to be USD 775,23 billion (2026), followed by USD 816.32 billion (2027), USD 816.32 billion (2028), USD 905.14 billion (2029), USD 953.12 billion (2030), USD 1,003.63 billion (2031), USD 1,056.83 billion (2032), USD 1,108.24 billion (2033) and USD 1,160.84 billion (2034).
- In 2024, the Asia-Pacific area led the market with over 36% share.
- The bed category accounted for more than 26% of revenue, while wood materials accounted for more than 41%.
- In terms of usage, the residential sector accounts for over 61% of total earnings.
Textiles Market Statistics
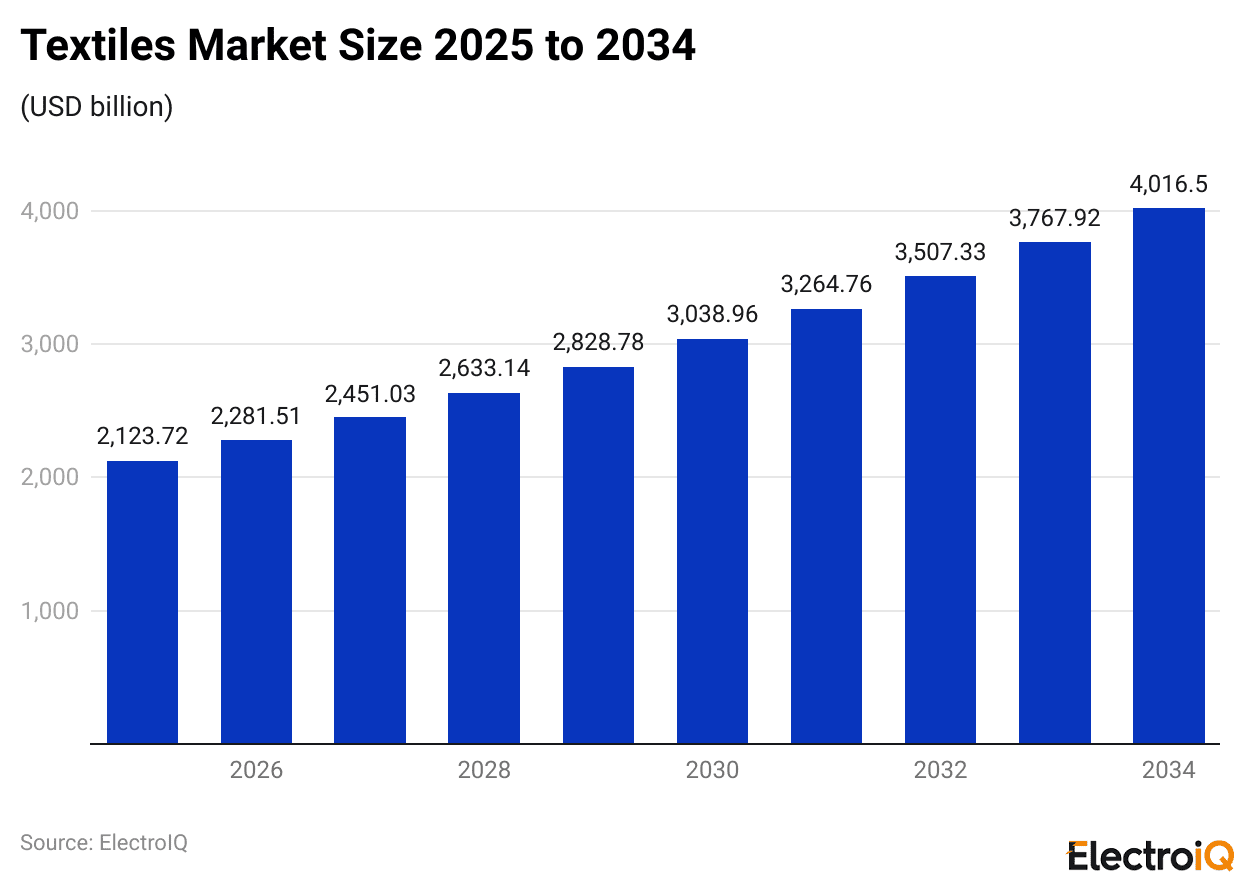
(Reference: precedenceresearch.com)
- The global market size of the textile industry is projected to reach approximately USD 2,123.72 billion by the end of 2025.
- Followed by USD 2,281.51 billion (2026), USD 2,451.03 billion (2027), USD 2,633.14 billion (2028), USD 2,828.78 billion (2029), USD 3,038.96 billion (2030), USD 3,364.76 billion (2031), USD 3,507.33 billion (2032), USD 3,767.92 billion (2033), and USD 4,016.50 billion (2034).
- As of 2024, the Asia-Pacific region accounted for the largest market share (54%), followed by North America (22%), Europe (19%), and LAMEA (5%).
- Grand View Research report states that Silk will grow fastest among raw materials, with a 4.5% CAGR from 2025 to 2033, followed by nylon at 4.9% and household use at 4.8%.
Floor Covering Market Statistics
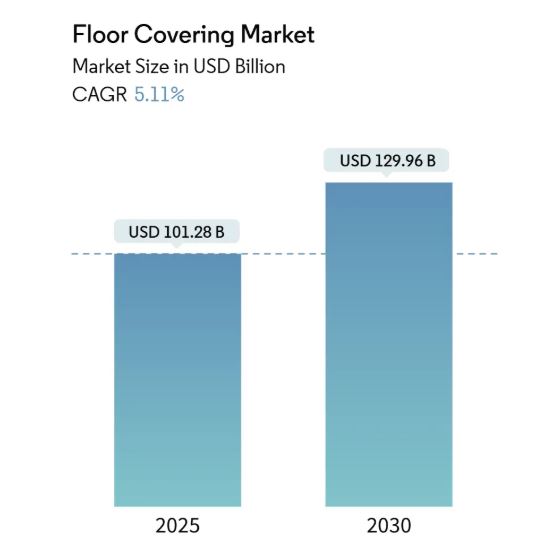
(Source: mordorintelligence.com)
- The global floor covering market is expected to reach USD 101.28 billion in 2025, reflecting consistent demand across residential and commercial construction. By 2030, the industry is projected to reach nearly USD 129.96 billion, supported by a steady 5.11% CAGR over the forecast period.
- In 2024, resilient flooring accounted for the largest product share at 32.26%, indicating strong adoption of materials such as vinyl and luxury vinyl tile due to their durability and ease of installation. Stone plastic composite products are projected to grow at 11.62%, driven by rising demand for rigid-core solutions in both new installations and renovations.
- Residential applications accounted for 56.38% of overall demand in 2024, indicating that household renovation and new housing developments continued to influence consumption patterns. Commercial usage is expected to exhibit a 7.98% CAGR, supported by retail expansion, hospitality refurbishments, and increased investments in workplace modernization.
- Home centres dominated distribution in 2024, accounting for 42.24% of total sales, reflecting consumer preference for in-store product comparison and professional installation support. Online stores are projected to grow by 15.88%, driven by rising digital commerce penetration and greater availability of flooring samples through e-retail platforms.
- The Asia-Pacific region accounted for 37.39% of the global market in 2024, driven by rapid urbanisation, substantial residential construction pipelines, and robust manufacturing capacity in countries such as China and India. The Middle East and Africa market is expected to record 8.20% CAGR, supported by infrastructure diversification in the UAE and Saudi Arabia, along with rising housing investments across emerging African economies.
- China remains the largest contributor in Asia as large-scale construction and renovation activities continue to elevate demand for cost-efficient resilient flooring. India shows a rising preference for vinyl and laminate flooring as urban households favour affordable, low-maintenance materials. The United States continues to drive the adoption of premium products, particularly engineered wood and luxury vinyl, supported by renovation spending exceeding USD 400 billion annually, according to national housing improvement estimates.
- Market observations indicate that global exports of vinyl flooring products have increased by more than 20% over the past three years, reflecting manufacturing strength in East Asia. Installation costs in major countries such as the United States and Germany have risen by nearly 10%, encouraging end users to choose DIY-friendly options. These trends suggest that resilient flooring categories will retain strong momentum across both mature and emerging markets.
The market segmental analysis is mentioned in the table below:
| Segments | Market Share (2024) |
CAGR (2025 to 2030) |
| Product Type | Resilient flooring (32.26%) | Stone plastic composite (11.62%) |
| End User | Residential use (56.38%) | Commercial use (7.98%) |
| Distribution Channel | Home centres (42.24%) | Online stores (15.88%) |
| Geography | Asia-Pacific (37.39%) | Middle East & Africa (8.20%) |
Smart Lighting Market Statistics
(Source: mordorintelligence.com)
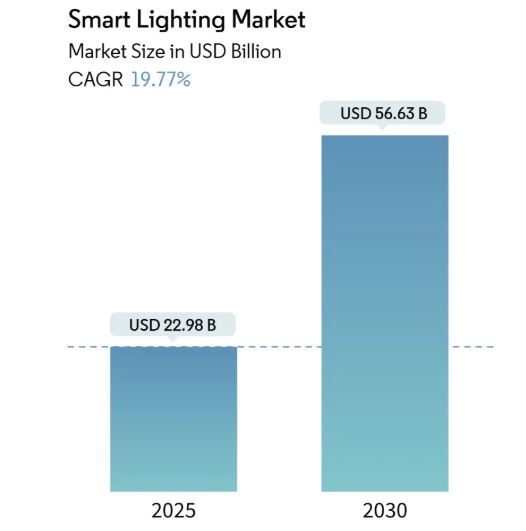
- The smart lighting market is valued at USD 22.98 billion in 2025 and is expected to reach USD 56.63 billion by 2030, growing at a strong 19.77% CAGR.
- In 2024, Smart Lamps and Fixtures accounted for 64.9% of the market, while Control Systems are set to grow at a 22.1% CAGR through 2030.
- Retrofit installations accounted for 52.1% of the 2024 market, and new construction should grow at a 21.3% CAGR from 2025 to 2030.
- For connectivity, Wi-Fi products accounted for 37.8% of revenue in 2024, and Zigbee options are projected to grow at a 19.3% CAGR.
- Commercial buildings accounted for 42.5% of 2024 demand, with industrial sites growing fastest at a 20.7% CAGR.
- Regionally, Europe accounted for 26.4%, while Asia-Pacific is expected to grow at a 19.8% CAGR.
Top 10 Home Decor Companies Analysis
(Source: amazonaws.com)
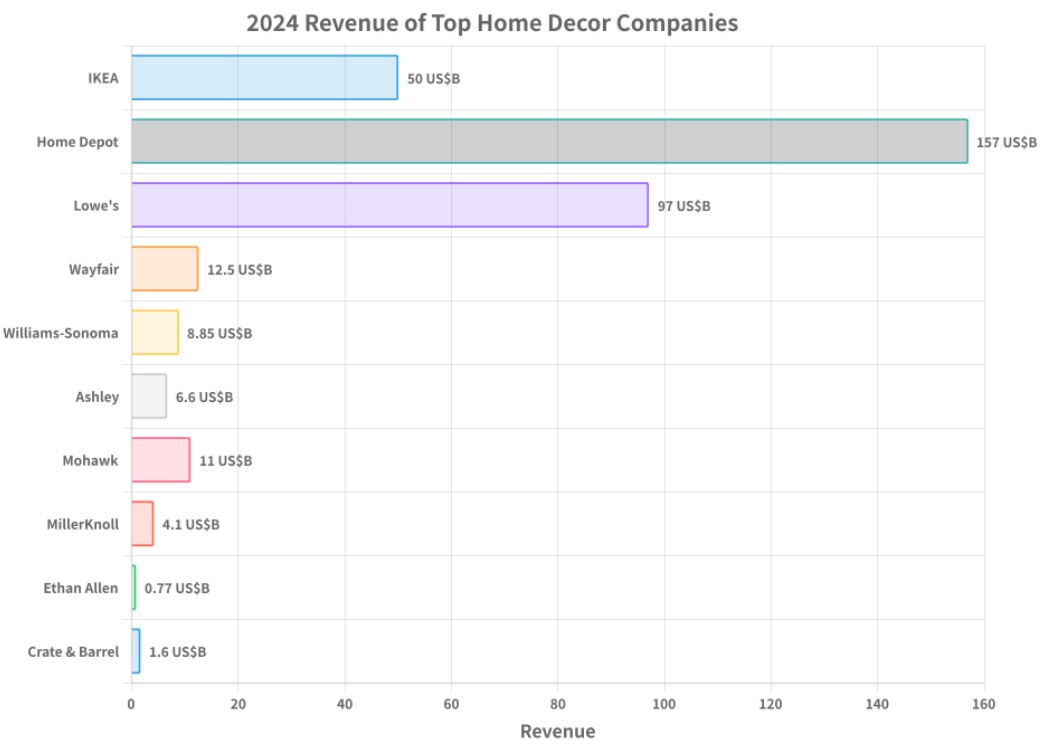
- The Home Depot, the world’s largest home decor retailer, generated approximately USD 157 billion in revenue in 2024, with a 6.10% CAGR over the last five years.
- The company is best known for HDX storage, Hampton Bay lighting, and Lifeproof flooring.
- It is expanding same-day delivery to 90% of U.S. households from 2024 to 2025.
- Furthermore, other companies revenue are followed by Lowe’s (USD 97 billion), IKEA (USD 50 billion), Wayfair Inc. (USD 12.50 billion), Mohawk (USD 11 billion), Williams-Sonoma Inc. (USD 8.85 billion), Ashley Furniture (USD 6.60 billion), MillerKnoll (USD 4.10 billion), Crate & Barrel Holdings (USD 1.60 billion) and Ethan Allen Interiors (USD 0.77 billion).
Key Factors Driving Online Home Decor Purchases
(Reference: shopify.com)
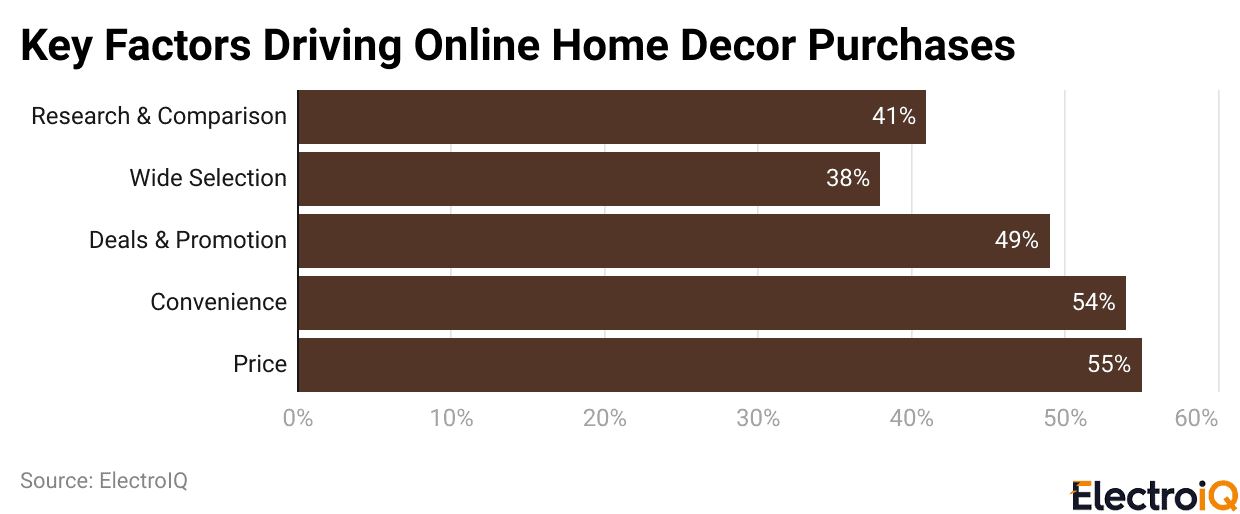
- The above graphical analysis shows that Price is the top motivator at 55%, followed by Convenience at 54% and Deals & Promotion at 49%.
- Additionally, 41% of consumers value Research & Comparison, while 38% are influenced by a Wide Selection when shopping for home decor online.
Popular Smart Home Technology Trends
(Source: fixr.com)
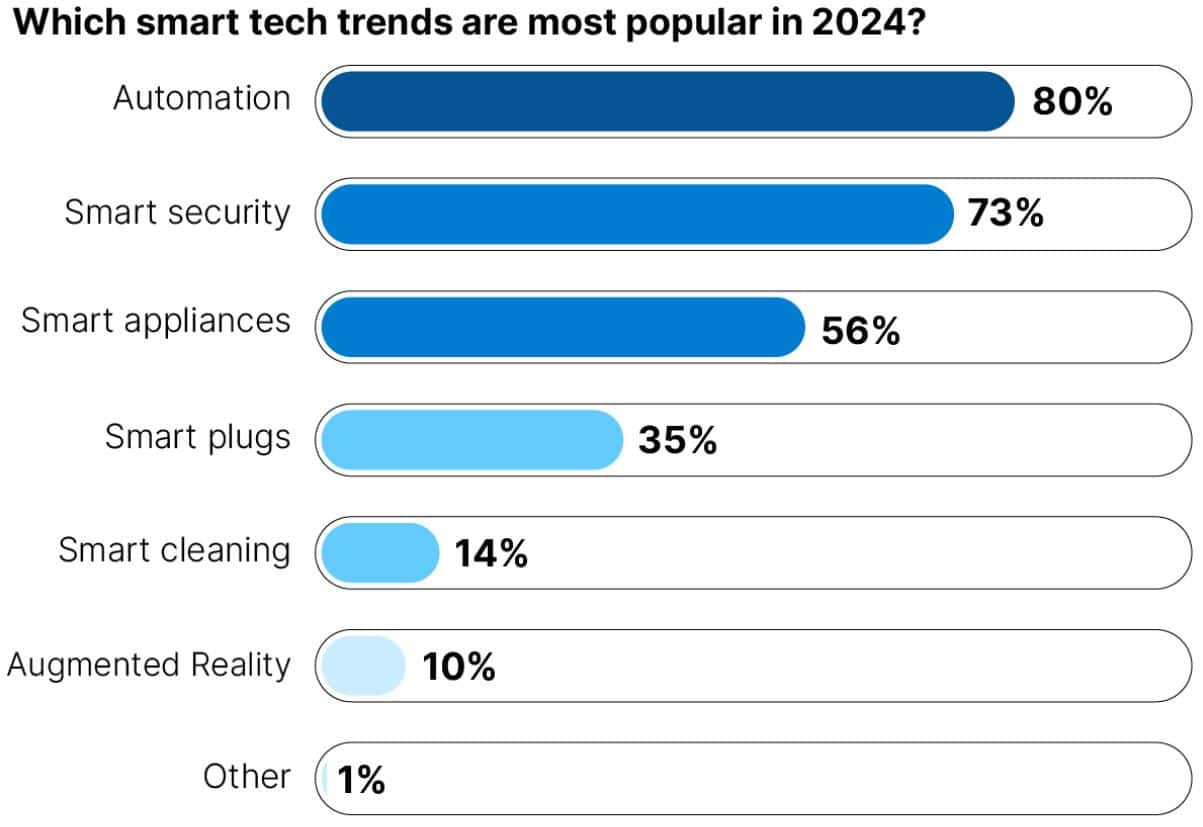
- In 2024, 80% of experts say automation is the top smart-home trend, and 73% point to security as another major focus.
- Meanwhile, 56% of designers cite smart appliances as the leading home design trend.
- Lastly, the most popular tech home trends are smart plugs (35%), smart cleaning (14%), augmented reality (10%), and other (1%).
Conclusion
To sum up, home décor is always evolving as people strive to make their spaces cosy, useful, and uniquely theirs. From new trends to classic styles or simple makeovers, the aim is to create a home that fits daily life and personal taste. When style and practicality come together, rooms can feel relaxing, inspiring, and enjoyable. As ideas continue to evolve and shift, decorating becomes a long-term process, giving everyone plenty of opportunities to update their spaces and see them in a new light.
Sources
FAQ.
They should look at many styles and pick the one that fits their life, comfort, and taste.
Use thrift finds, DIY projects, plants, simple rearranging, and affordable accents to refresh your space.
Soft neutrals with warm or bold accents work best, creating balance, comfort, and a stylish atmosphere.
Plants, throw pillows, rugs, wall art, and new lighting can instantly refresh rooms.
People should update their decor whenever their style changes or the space feels outdated.

Maitrayee Dey has a background in Electrical Engineering and has worked in various technical roles before transitioning to writing. Specializing in technology and Artificial Intelligence, she has served as an Academic Research Analyst and Freelance Writer, particularly focusing on education and healthcare in Australia. Maitrayee's lifelong passions for writing and painting led her to pursue a full-time writing career. She is also the creator of a cooking YouTube channel, where she shares her culinary adventures. At Smartphone Thoughts, Maitrayee brings her expertise in technology to provide in-depth smartphone reviews and app-related statistics, making complex topics easy to understand for all readers.