Online Payment Statistics By Segment, Users, Country, Revenue and Demographic
Updated · Jan 06, 2025
Table of Contents
- Introduction
- Editor’s Choice
- General Online Payment Statistics
- Online Transaction Value Statistics By Segment
- Average Online Transaction Value Per User Statistics
- Global Online Payment Statistics By Users
- Global Revenue Comparison By Country
- Online Payment Options Statistics for Online Shoppers
- Global Online Payment Revenue Statistics
- Online Payment Usage Share By Demographics
- Adoption of Artificial Intelligence (AI)-Driven Online Payments Statistics
- Leading Online Payment Gateway Statistics
- Cashless Transaction Statistics By Region
- Global QR Payment Market Statistics By Region
- Future Product Releases on Online Payment Statistics
- Conclusion
Introduction
Online Payment Statistics: Online payments have become an essential part of our daily lives, making it easier to shop, pay bills, and send money instantly. With the rapid growth of e-commerce and digital services, more people now prefer using online payment methods instead of cash or checks. In 2024, mobile wallets, contactless payments, and digital banking are more popular than ever.
This shift is driven by convenience, speed, and enhanced security features like encryption and biometric authentication. In recent years, businesses and consumers have adopted these methods globally, with many countries seeing a significant increase in cashless transactions.
Understanding the latest trends and statistics in online payments helps businesses adapt to customer needs and stay competitive in a fast-changing digital economy.
Editor’s Choice
- The online or digital payments market will reach a transaction value of USD 11.55 trillion in 2024.
- The worldwide digital payments market is projected to grow by 15.71% annually from 2024 to 2029, reaching a transaction value of approximately USD 36.75 trillion by 2029.
- Online payment statistics also show that digital commerce accounts for the highest transactional value, at USD 8.67 trillion.
- As of 2024, China leads globally with the highest transaction value, totaling USD 8,576 billion.
- In January 2024, UPI transactions in India reached a record ₹18.41 trillion.
- Buy Now, Pay Later (BNPL) services facilitated USD 75 billion in online spending in the U.S. in 2023, and the number is expected to reach USD 18.5 billion in the last quarter of 2024.
- Despite a decline in cash usage, 51% of purchases in Germany were still made with cash in 2023.
- During the 2024 holiday season, online sales transactions in the U.S. increased by 7.1% compared to the previous year.
- According to projections, online payment fraud caused global losses of USD 38 billion in 2023, which could rise to USD 91 billion by 2028.
- In contrast, around 89% of adults in the U.S. reported using digital payments in 2024.
General Online Payment Statistics
- In 2023, real-time payments accounted for 266.2 billion transactions globally, marking a 42.2% increase from the previous year.
- Digital wallets were used for 50% of global online purchases in 2023, with projections suggesting this will rise to 61% by 2027.
(Source: cdn.prod.website-files.com)
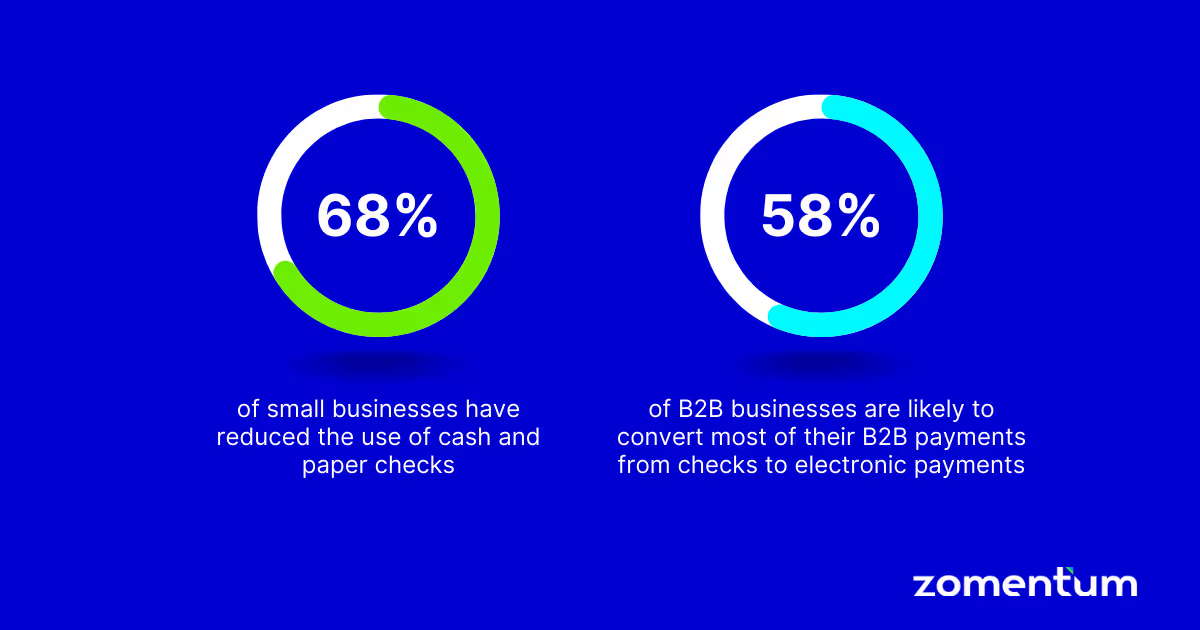
- Around 68% of small businesses now use less cash and checks, while 58% of B2B companies prefer switching to electronic payments.
- In North America, ACH credits were the most used payment method by B2B customers in 2024, with a share of 37%.
- Furthermore, others are followed by checks (25%), domestic wire transfers (13%), and other methods making up the remaining 25%.
- In contrast, 81% of businesses are currently investing or planning to invest in B2B payment technology to improve Accounts Payable.
- As of 2022, only 29% of Americans chose in-person banking, while 78% preferred using mobile apps or websites.
- The retail sector is expected to grow at a yearly rate of 12.2% and dominate the market from 2024 to 2032.
Online Transaction Value Statistics By Segment
(Source: statista.com)
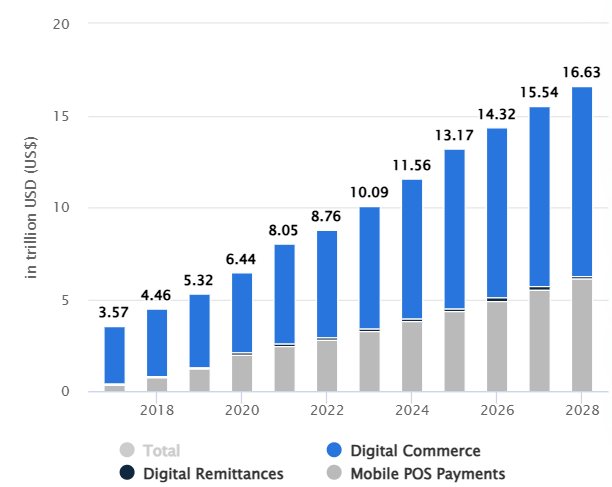
- As of March 2024, Statista report analyses show that Digital Commerce will account for the highest transactional value of USD 8.67 trillion, with a value change of 13.97% from 2023.
- The transaction value and change rate for the other segments will be around Mobile POS Payment (USD 3.78 trillion): 15.90% and Digital Remittances (USD 0.15 trillion): 9.71%.
In the coming years, the transactional values and value change by other segments are followed in the table below:
| Year | Transaction Value (USD trillion) and Value Change | ||
| Digital Commerce | Mobile POS Payment | Digital Remittances | |
| 2025 | 8.67 (13.61%) | 4.34 (14.91%) | 0.16 (7.02%) |
| 2026 | 9.22 (6.45%) | 4.93 (13.69%) | 0.17 (4.66%) |
| 2027 | 9.84 (6.67%) | 5.52 (11.85%) | 0.18 (4.53%) |
| 2028 | 10.34 (5.03%) | 6.11 (10.67%) | 0.18 (2.88%) |
Average Online Transaction Value Per User Statistics
(Source: statista.com)
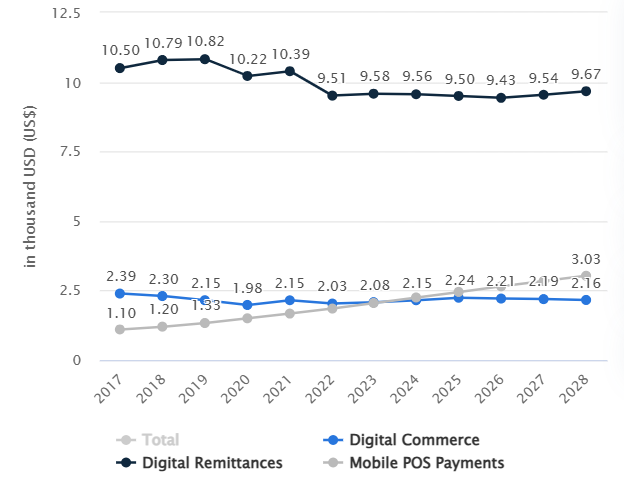
- Based on Online Payment Statistics in 2024, the highest average transaction value per user will made up by Digital Remittances, resulting in USD 9.56 thousand.
- Other are followed by Mobile POS Payments (USD 2.25 thousand) and Digital Commerce (USD 2.15 thousand).
The table below depicts the online payment systems average transaction value per users are:
| Year (USD thousand) | Digital Remittances | Mobile POS Payment | Digital Commerce |
| 2025 | 9.50 | 2.45 | 2.24 |
| 2026 | 9.43 | 2.65 | 2.21 |
| 2027 | 9.54 | 2.84 | 2.19 |
| 2028 | 9.67 | 3.03 | 2.16 |
Global Online Payment Statistics By Users
| Year | Digital Commerce
(millions) |
Mobile POS Payment
(millions) |
Digital Remittances
(millions) |
| 2024 | 3,551 | 1,682 | 15.82 |
| 2025 | 3,875 | 1,772 | 17.04 |
| 2026 | 4,181 | 1,858 | 17.98 |
| 2027 | 4,493 | 1,940 | 18.56 |
| 2028 | 4,786 | 2,012 | 18.85 |
Global Revenue Comparison By Country
- In 2024, the total value of transactions in the online payments market will reach USD 3,744 billion.
- This value is predicted to grow annually by 8.77% (CAGR) from 2024 to 2028, reaching USD 5,240 billion by 2028.
- Digital Commerce is projected to be the largest segment of this market in 2024, with a total transaction value of USD 2,013 billion.
As per Online Payment Statistics, the other top four countries’ market analyses in 2024 are stated in the table below:
| Country | Market Size
(USD) |
CAGR (from 2024 to 2028) | Transactional Value: Digital Commerce |
| United States | 3,073 billion | 10.73% | USD 2,255 billion |
| United Kingdom | 513.10 billion | 9.00% | USD 335.10 billion |
| Japan | 397.60 billion | 8.44% | USD 328 billion |
| Germany | 302.80 billion | 6.95% | USD 250 billion |
By Region, 2024
| Region | Revenue
(USD) |
CAGR
(2024 to 2028) |
Largest Transactional Value (USD) |
| Africa | 195.50 billion | 12.65% | Mobile POS Payments: 97.18 billion |
| Americas | 3,731 billion | 10.59% | Digital Commerce: 2,717 billion |
| Asia | 5.26 trillion | 8.87% | Digital Commerce: 3.21 trillion |
| Australia & Oceania | 176.40 billion | 10.63% | Digital Commerce: 119 billion |
| Caribbean | 22.90 billion | 10.92% | Digital Commerce: 11.01 billion |
| Europe | 2,194 billion | 8.81% | Digital Commerce: 1,489 billion |
Online Payment Options Statistics for Online Shoppers

(Source: googleusercontent.com)
| Payment Options | Transaction Value
(USD) |
Share of E-commerce Transactions | ||
| 2023 | 2027 | 2023 | 2027 | |
| Digital Wallets | 3.1 trillion | 5.4 trillion | 50% | 61% |
| Credit Cards | 1.364 trillion | 1.328 trillion | 22% | 15% |
| Debit Cards | 744 billion | 756 billion | 12%
|
8% |
| A2A (Account-to-Account) | 449 billion | 756 billion | 7% | 8% |
| BNPL (Buy Now, Pay Later) | 316 billion | 443 billion | 5.1% | 5% |
| Cash on Delivery | 124 billion | 89 billion | 2% | 1% |
| Pre-paid Cards | 64 billion | 73 billion | 1% | 0.8% |
| Pre-pay | 20 billion | – | – | – |
| Cryptocurrency | 17.5 billion | – | – | – |
| Post-pay | 11 billion | – | 0.3% | – |
Global Online Payment Revenue Statistics
(Reference: scoop.market.us)
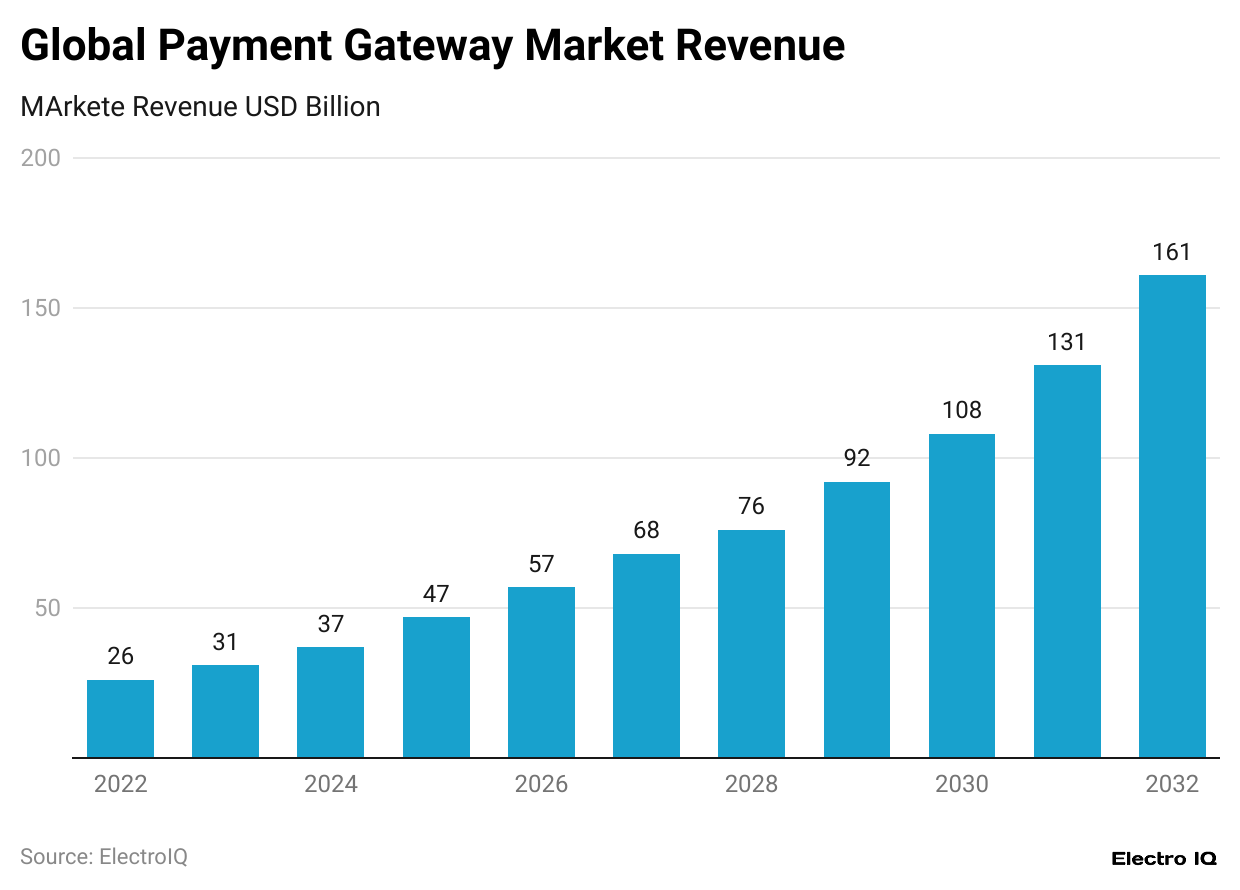
- This trend continued in subsequent years, with the total market size expanding to USD 31.0 billion in 2023, USD 37.0 billion in 2024, and USD 47.0 billion in 2025.
- According to Online Payment Statistics, the global payment gateway market is projected to reach USD 161.0 billion by 2032.
By Type
| Year | Hosted
(USD billion) |
Non-Hosted
(USD billion) |
| 2024 | 21.83 | 15.17 |
| 2025 | 27.73 | 19.27 |
| 2026 | 33.63 | 23.37 |
| 2027 | 40.12 | 27.88 |
| 2028 | 44.84 | 31.16 |
| 2029 | 54.28 | 37.72 |
| 2030 | 63.72 | 44.28 |
| 2031 | 77.29 | 53.71 |
| 2032 | 94.99 | 66.01 |
- Online Payment Statistics in 2024 elaborates that online users aged 16 to 24 years captured the highest number of female users, with a share of 63%, and males, with 55.8%.
At the same duration, other male and female usage shares by other age groups:
| Age Group
(Years) |
Male | Female |
| 25 to 34 | 58.1% | 60.5% |
| 35 to 44 | 52.3% | 54.7% |
| 45 to 54 | 48.6% | 50.2% |
| 55 to 64 | 42.1% | 44.8% |
| 65+ | 35.4% | 37.9% |
Adoption of Artificial Intelligence (AI)-Driven Online Payments Statistics
- As of 2024, the percentage of people worldwide who feel comfortable with companies using AI to improve digital payments.
| Demographics | I am fully comfortable with this | I have some reservations | I could be comfortable with this if I knew more about it | I am not comfortable with this at all |
| 18 to 27 years | 37% | 30% | 25% | 8% |
| 28 to 43 years | 35% | 30% | 24% | 10% |
| 44 to 59 years | 25% | 32% | 26% | 17% |
| 60 to 78 years | 13% | 31% | 24% | 32% |
| 70 to 96 years | 7% | 26% | 19% | 48% |
| Male | 31% | 33% | 22% | 14% |
| Female | 25% | 29% | 28% | 18% |
| Total Respondents | 28% | 30% | 25% | 17% |
(Source: statista.com)
Leading Online Payment Gateway Statistics
- In 2024, PayPal Holdings, Inc. continues to lead the global online payment market with a strong market share of approximately 20%.
| Platforms | Market Share |
| Stripe, Inc. | 15% |
| Amazon Pay | 12% |
| Square, Inc. (now Block, Inc.) | 10% |
| Adyen N.V. | 8% |
Cashless Transaction Statistics By Region
(Reference: statista.com)
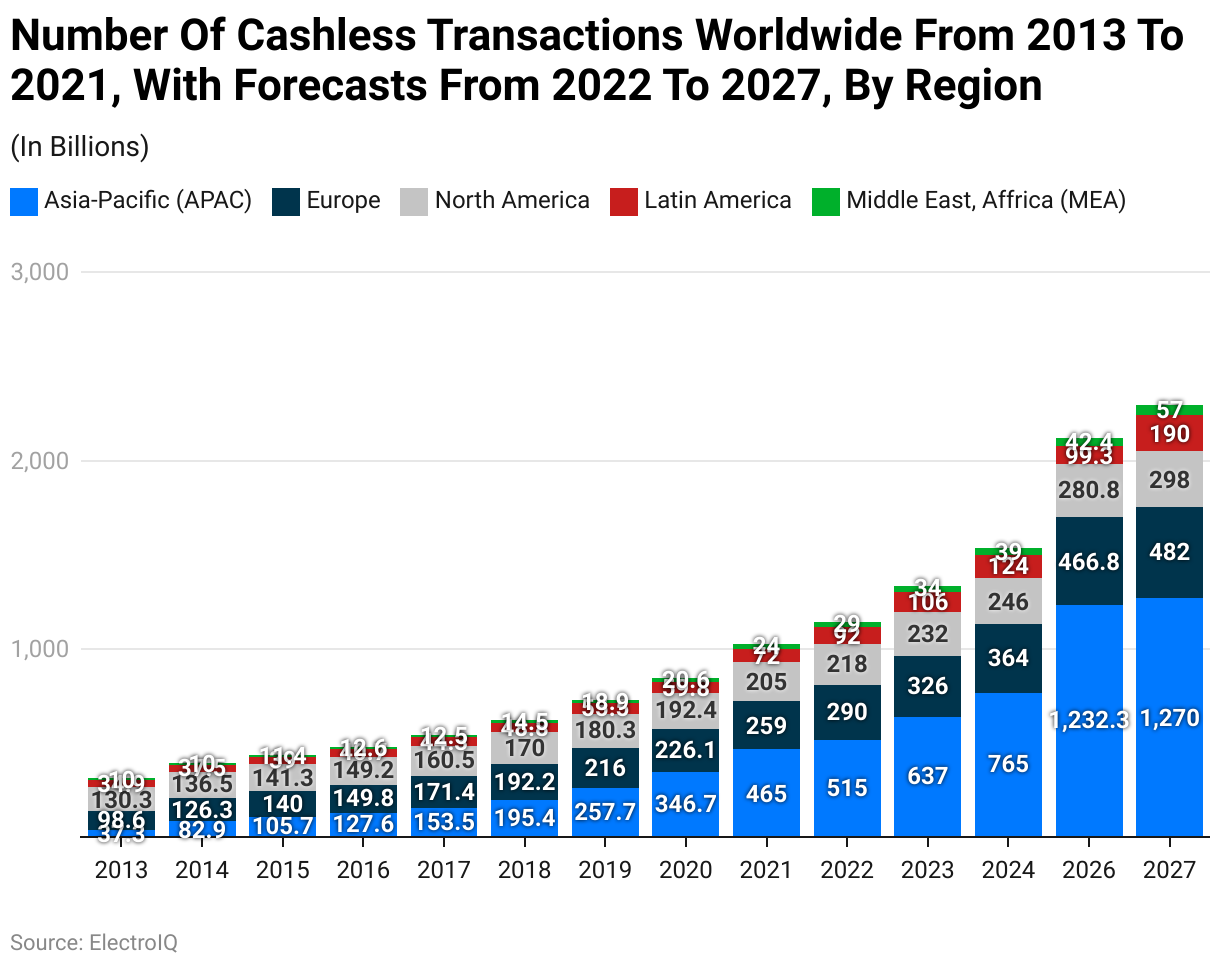
- The above graph, based on Online Payment Statistics, shows that in 2024, the Asia-Pacific region had the highest number of cashless transactions, totaling 765 billion.
- This year, Europe (364 billion), North America (246 billion), Latin America (124 billion), and the Middle East and Africa (39 billion) are the other regions with the highest number of cashless transactions.
| Year (in billions) | Asia-Pacific | Europe | North America | Latin America | Middle East, Africa |
| 2026 | 1,232.3 | 466.8 | 280.8 | 99.3 |
42.4 |
|
2027 |
1,270 | 482 | 298 | 190 |
57 |
Global QR Payment Market Statistics By Region
(Reference: statista.com)
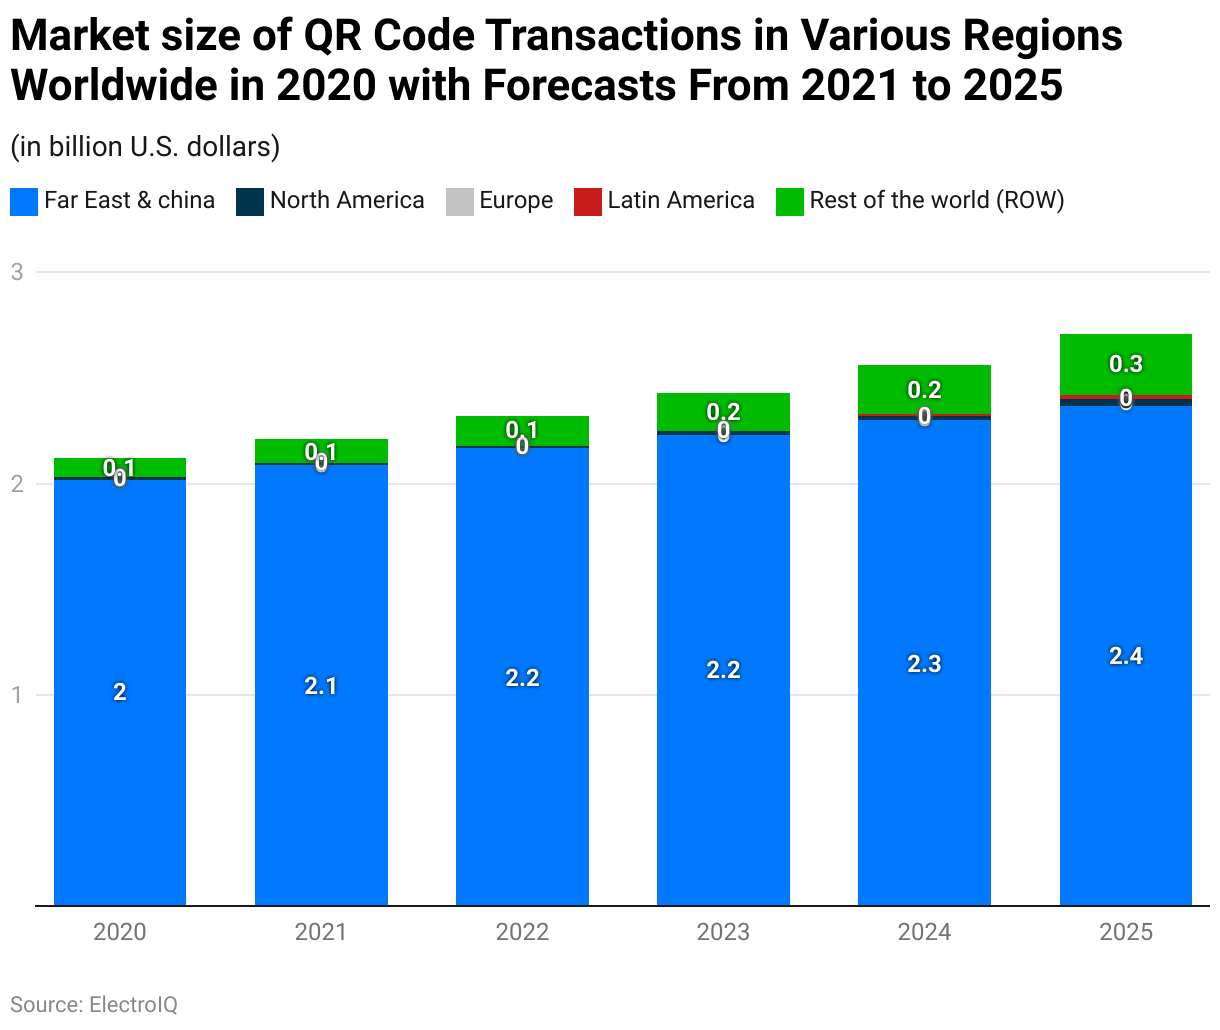
- Online Payment Statistics further state that in 2024, the Far East and China had the largest market for QR codes, with a total value of USD 2.3 billion.
- Followed by North America (USD 0.02 billion), Latin America (USD 0.01 billion), and the rest of the world (USD 0.23 billion).
- Similarly, by the end of 2025, the estimated market size of QR codes by region is followed by the Far East & China (USD 2.37 billion), North America (USD 0.03 billion), Latin America (USD 0.02 billion) and Rest of the World (USD 0.29 billion).
Future Product Releases on Online Payment Statistics
- Apple Pay Expansion: BNPL transactions are expected to grow by 30% globally in 2024, further increasing Apple Pay’s adoption.
- Mastercard’s Tokenization Initiative: Tokenization could reduce payment fraud by up to 25%, influencing more secure online transactions.
- PayPal’s AI-Driven Fraud Detection: With enhanced security, fraud-related losses, projected at USD 38 billion globally in 2023, could drop significantly.
- Revolut’s Business-Focused Payment Terminal: This release is expected to increase Revolut’s market share by 15% in the B2B payment segment.
- Stripe’s Global Expansion: Digital transactions in emerging markets could see a 20% increase, driven by Stripe’s integration of local solutions.
Conclusion
Online payment systems have revolutionized the way of shopping and doing business, along with making transactions faster, easier, and even more secure. These digital payments allow users to save time and reduce cash transactions by offering both buyers and sellers effective convenience. However, ensuring safety and protecting personal data remain crucial for users and businesses.
Due to technological advancements, online payment systems have continued to improve by providing even more reliable and innovative solutions. Embracing online payments is key to staying connected in today’s fast-paced, digital world.
FAQ.
Online payments transfer money digitally using cards, wallets, or bank accounts through secure systems.
Online payments are safe if you use secure platforms, strong passwords, and trusted websites.
Common online payment methods include credit/debit cards, digital wallets, bank transfers, and mobile payments.
A digital wallet is an app or device storing payment information for online or contactless transactions.
Yes, online payments may have fees, like transaction or processing charges, depending on providers.
Use secure websites, strong passwords, and two-factor authentication, and avoid sharing payment details publicly.

Maitrayee Dey has a background in Electrical Engineering and has worked in various technical roles before transitioning to writing. Specializing in technology and Artificial Intelligence, she has served as an Academic Research Analyst and Freelance Writer, particularly focusing on education and healthcare in Australia. Maitrayee's lifelong passions for writing and painting led her to pursue a full-time writing career. She is also the creator of a cooking YouTube channel, where she shares her culinary adventures. At Smartphone Thoughts, Maitrayee brings her expertise in technology to provide in-depth smartphone reviews and app-related statistics, making complex topics easy to understand for all readers.


