Smart Home Statistics By Device Category, Most Owned Brands by Country and Facts
Updated · Oct 23, 2025

Table of Contents
- Introduction
- Editor’s Choice
- General Smart Home Statistics
- By Device Category
- By Region
- By Demographics
- By Most Owned Brand by Country
- By Attitude
- By Device Owned
- By Number of Smart Households by Device
- By Leading Smart Home Innovation Trends
- By the Estimated Possibility of Household Tasks
- By Reasons to Own Smart Home Devices
- By Smart Appliances Ownership Rate
- Conclusion
Introduction
Smart Home Statistics: It’s amazing how technology has made our homes smarter. Every day, we wake up to automated machines greeting us in the morning. As we start our day, we can let the smart coffee machine make coffee for us while we listen to the news on voice-controlled devices.
At the same time, a smart floor cleaner can be seen roaming around the house. Smart home statistics show how quickly our lives have advanced in just a few years.
Editor’s Choice
- 44% of smart home device owners own at least one connected entertainment system.
- In the United States of America, 23% of broadband consumers own 3 or more smart home devices.
- In the United States of America, ⅔ of the homeowners think smart home devices are necessary for their daily lives.
- According to 77% of smart home device owners, this technology is improving their quality of life.
- In 2024, the global smart home market is valued at $154.4 billion and is projected to grow at a CAGR of 10.67% reaching $231.6 billion by 2028.
- In terms of global comparison, the United States of America is projected to generate the majority of revenue, resulting in $38,800 million in 2024.
- As of September 2023, in selected countries, Samsung is the major player in the smart home device segment.
- According to Smart Home Statistics, compared to the global status of smart appliances ownership rate, the highest number of owners reside in India, resulting in Small smart appliances (25%) and large smart appliances (36%).
- By 2025, 20% of the house owners in the world will own at least one smart home device.
- Smart Home Statistics state that, in the United States of America, 40.8% of households are at high risk just because of one connected device.
General Smart Home Statistics
- In the United States of America, ⅔ of the homeowners think smart home devices are necessary for their daily lives.
- As of 2023, there are still 30% of households without any smart home devices at home.
- According to 77% of smart home device owners, this technology is improving their quality of life.
- 45% of smart home device owners control these devices through applications on smartphones.
- In the United States of America, 23% of broadband consumers own 3 or more smart home devices.
- Furthermore, 50% of households own at least one smart home device.
- Consumers in the United States of America use at least 2 devices twice a day.
- Smart Home Statistics state that, in the United States of America, 40.8% of households are at high risk just because of one connected device.
- As of 2023, the demand for smart home devices was expected to reach 53.9%.
- By 2025, 20% of the house owners in the world will own at least one smart home device.
- 44% of smart home device owners own at least one connected entertainment system.
- The average cost of making a home smart by owning at least one device is between $970 – $3,310.
- Smart Home Statistics by consumer spending on smart homes and products and services around the globe state that in 2023 it was $147 billion, which is estimated to be $159 billion in 2024, and it will reach $173 billion by 2025.
- As of 2023, there were more than 300 million smart homes around the world, out of which 60.4 million were in the USA.
- 97% of smart device owners are extremely satisfied with the devices.
- 79% of Americans who own smart home devices have at least one concern about the devices.
- Furthermore, 65% of Americans are not ready to install smart home devices if they collect any personal information.
- On average, a household owns at least 8 types of smart devices.
- By 2028, the total number of smart home device consumers is estimated to reach 425.5 million, with an increase in users by +117.69%.
- In the United States of America, fitness scales were the leading smart devices in the smart fitness and health devices category, owned by 5.2% of Americans.
- 57% of Americans who use smart devices said they these devices 30 minutes of their time every day.
By Device Category
- The Smart fridge is the most popular device in the smart home appliance for the kitchen category, as 7% of Americans own it.
- Furthermore, as of 2023, 4.1% own microwaves, 3.4% smart coffee machines, 3.3 smart kitchen scales, 2.5% smart faucets, 2.3% smart pet feeders, 2.2% smart cooking thermometers, and 2.1% smart ice machines, air fryers, and herb gardens.
- 6% of Americans own video doorbells, while 12.3% have outdoor security cameras.
By Region
Worldwide
- In 2024, the global smart home market is valued at $154.4 billion and is projected to grow at a CAGR of 10.67% reaching $231.6 billion by 2028.
- As of today, the average revenue per smart home is valued at $365.60.
- In terms of global comparison, the United States of America is projected to generate the majority of revenue, resulting in $38,800 million in 2024.
- The household penetration in terms of the Smart home category is expected to be at a rate of 18.9% which will increase to 33.2% by 2028.
Asia
- According to Smart Home Statistics 2024, the Asian market is expected to grow at a CAGR of 12.12% reaching $60.6 billion in 2024, and by 2028, it is projected to reach $95.8 billion.
- South Korea is a majorly growing in the integration of AI with voice control systems.
- In 2024, 17.4% is the household penetration rate in terms of the smart home market, which is expected to grow to 31.4% by 2028.
- In Asia, the average revenue for every installed smart home is projected to be $284.10.
Africa
- The African smart home market is valued at $2,397 million in 2024 and is expected to grow at a CAGR of 11.96% reaching $3,767 million by 2028.
- The household penetration rate in Africa is 5.2% in 2024, which is expected to rise to 8.5% by 2028.
- The average revenue generated per installed smart home is $169.70.
- The South African smart home market will experience major growth because of rising living standards in the middle class and increased urbanization.
America
- As per Smart Home Statistics 2024, the American market is valued at $47.4 billion, which is expected to grow at a CAGR of 9.37% reaching $67.8 billion by 2028.
- The driving factor for growth in the American market is the increased demand for voice-controlled virtual assistants.
- Furthermore, in 2024, the household penetration rate is projected to be at 28.5% which will increase to 43.3% by 2028.
- The average revenue for every installed smart home is $479.70.
Europe
- By 2028, the European smart home market is expected to reach $58.8 billion with a CAGR of 10.03%, considering that the market in 2024 is valued at $40.1 billion.
- Between 2024 and 2028, the household penetration is expected to increase to 48.3% from 24.9%.
- The German smart home market has a driving factor of increased demand for secure home automation systems that are energy efficient.
- The average revenue per installed Smart home market is $446 in 2024.
By Demographics
- According to Smart Home Statistics by Demographics, a larger number of smart devices belong to Gen X and younger.
- Furthermore, 40% of smart home device owners are aged between 18 to 34 years.
- In addition, 77% of consumers are aged below 55 years.
By Most Owned Brand by Country
 (Reference: statista.com)
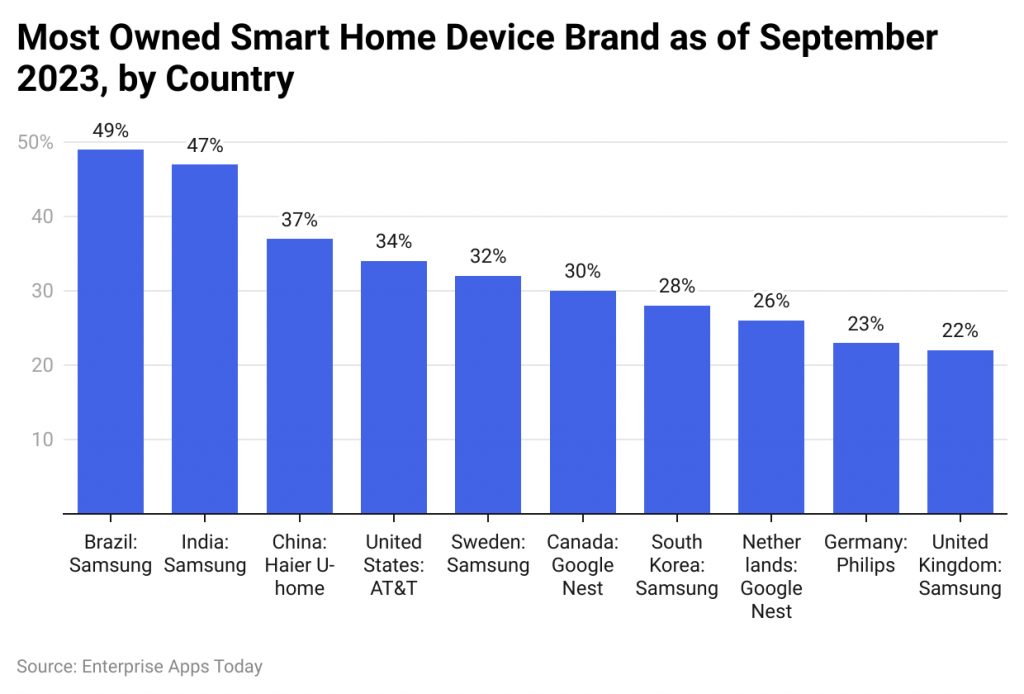
- As of September 2023, in selected countries, Samsung is the major player in the smart home device segment. Out of 10, at least 5 countries prefer Samsung over any other.
- Furthermore, other brands preferred in China are Haier U-home and Google Nest in Canada and the Netherlands. Philips and AT and T are respectively popular brands in Germany and the United States of America.
By Attitude
 (Reference: statista.com)
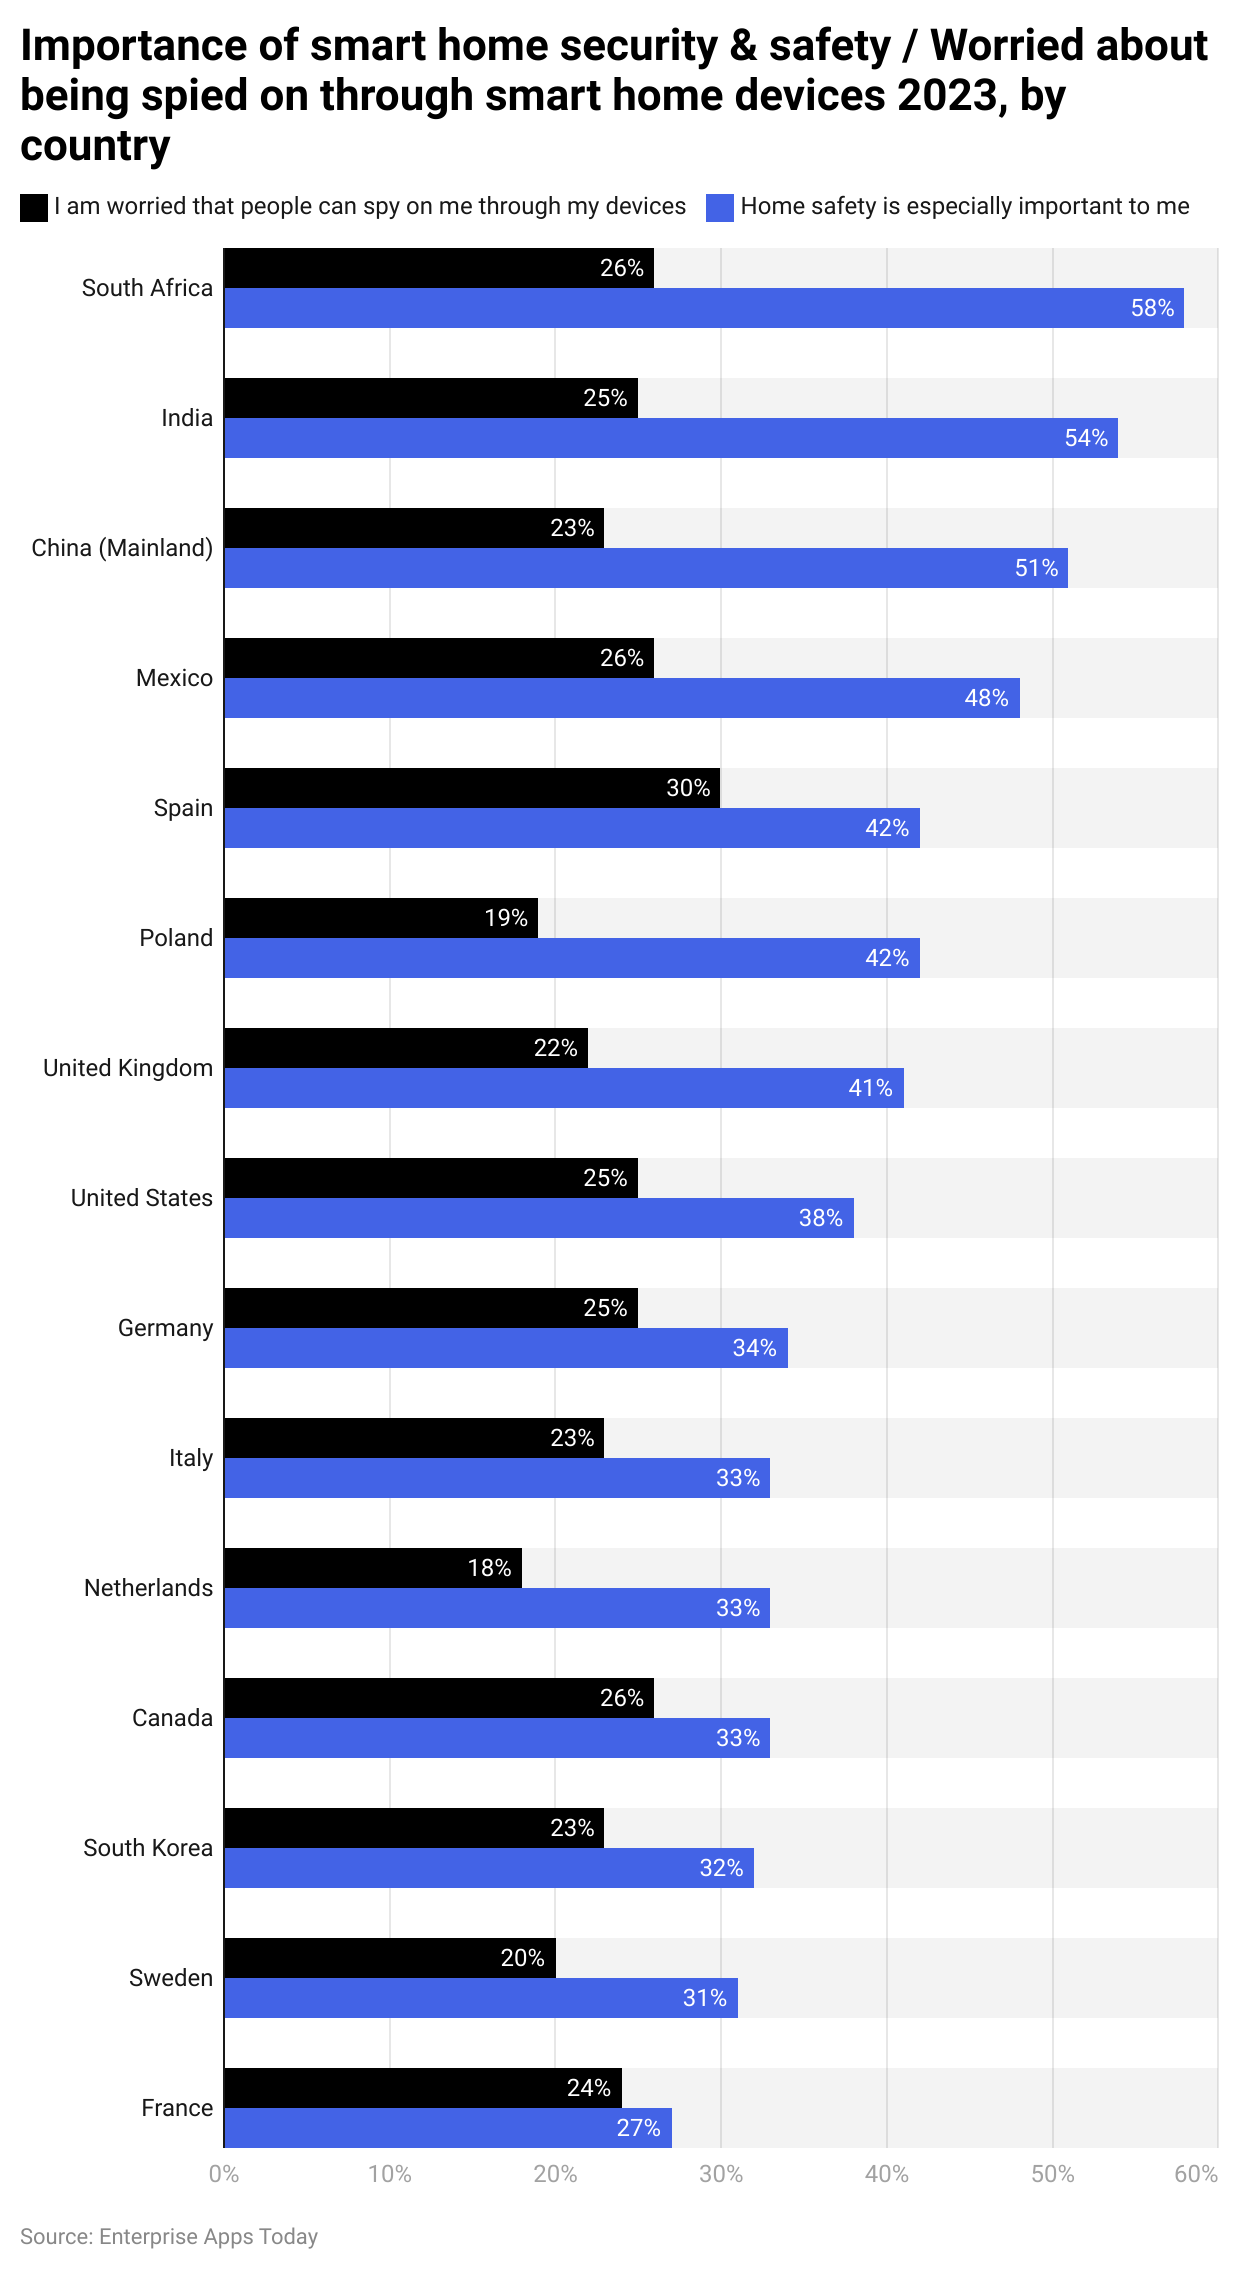
- Compared to spy issues from smart devices, consumers have given more importance to home safety. According to the above chart, more than 50% of consumers voted for their home safety.
- The highest number of consumers with home safety concerns reside in South Africa followed by India and China (Mainland). On the other hand, looking at the overall ratio, France has almost 50-50 consumers worried about safety as well as being spied on through smart devices.
By Device Owned
 (Reference: statista.com)
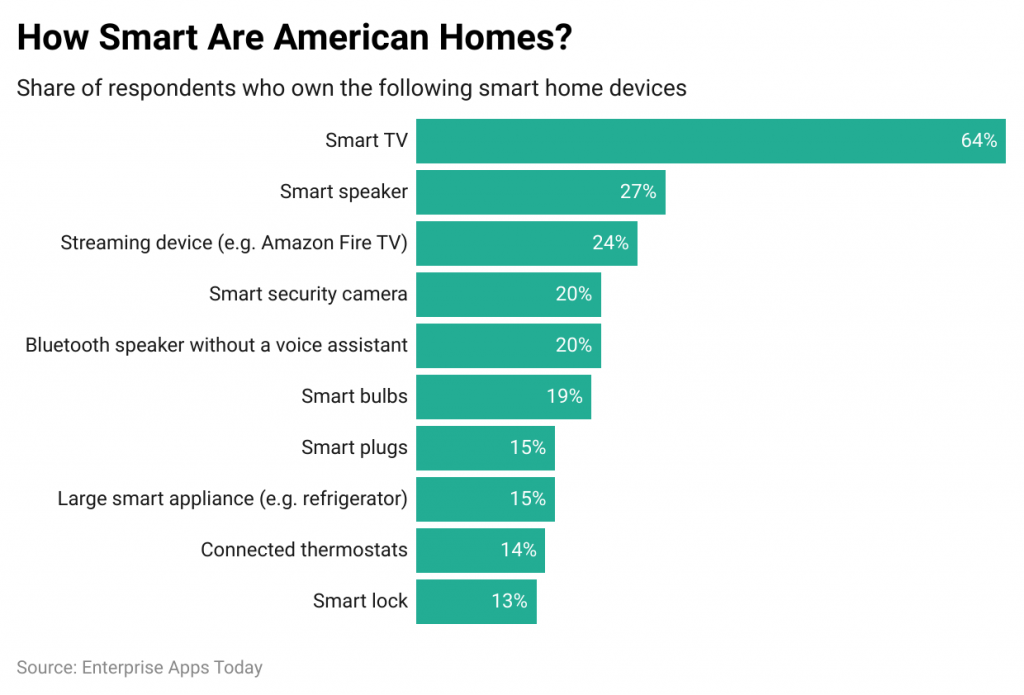
- According to Smart Home Statistics, a consumer survey by Statista showed that in September 2023, the majority of consumers in the United States of America owned Smart TVs contributing 64%.
- However, smart speakers (27%) and Streaming devices (24%) were the other preferred choices. On the other hand, a small number of American households owned Connected thermostats and smart locks resulting respectively in 14% and 13%.
By Number of Smart Households by Device
 (Reference: statista.com)
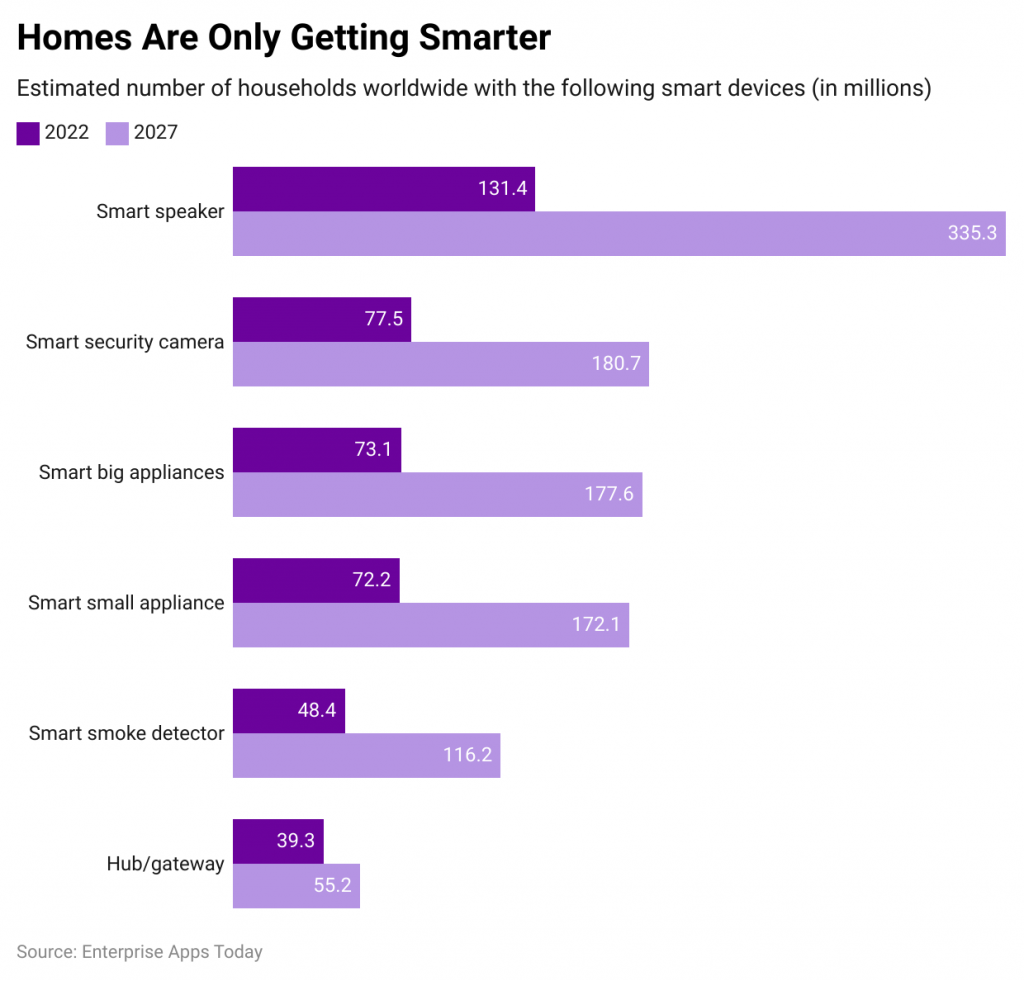
- Smart Home Statistics further show that, by 2027, the top 3 smart home devices that will grow in number of houses are smart speakers 335.3 million, smart security cameras 180.7 million and smart bug appliances 177.6 million.
By Leading Smart Home Innovation Trends
 (Reference: statista.com)
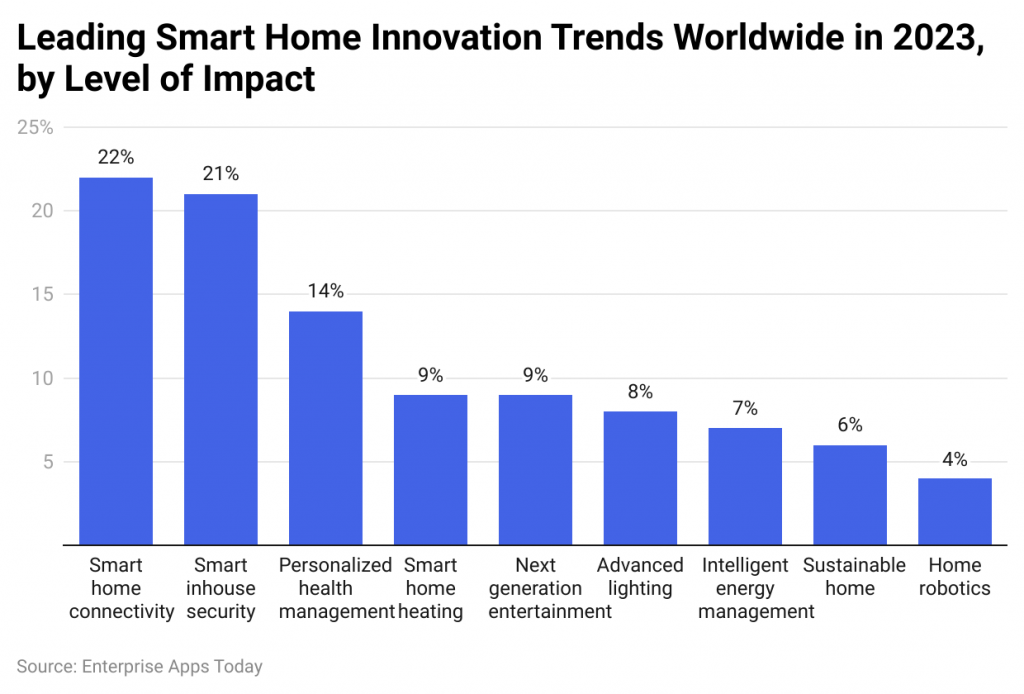
- In 2023, Smart home connectivity, smart in-house security, and personalized health management devices were the most demanding technologies. Surprisingly, home robotics were considered the lowest by the level of impact contributing just 4%.
By the Estimated Possibility of Household Tasks
 (Reference: statista.com)
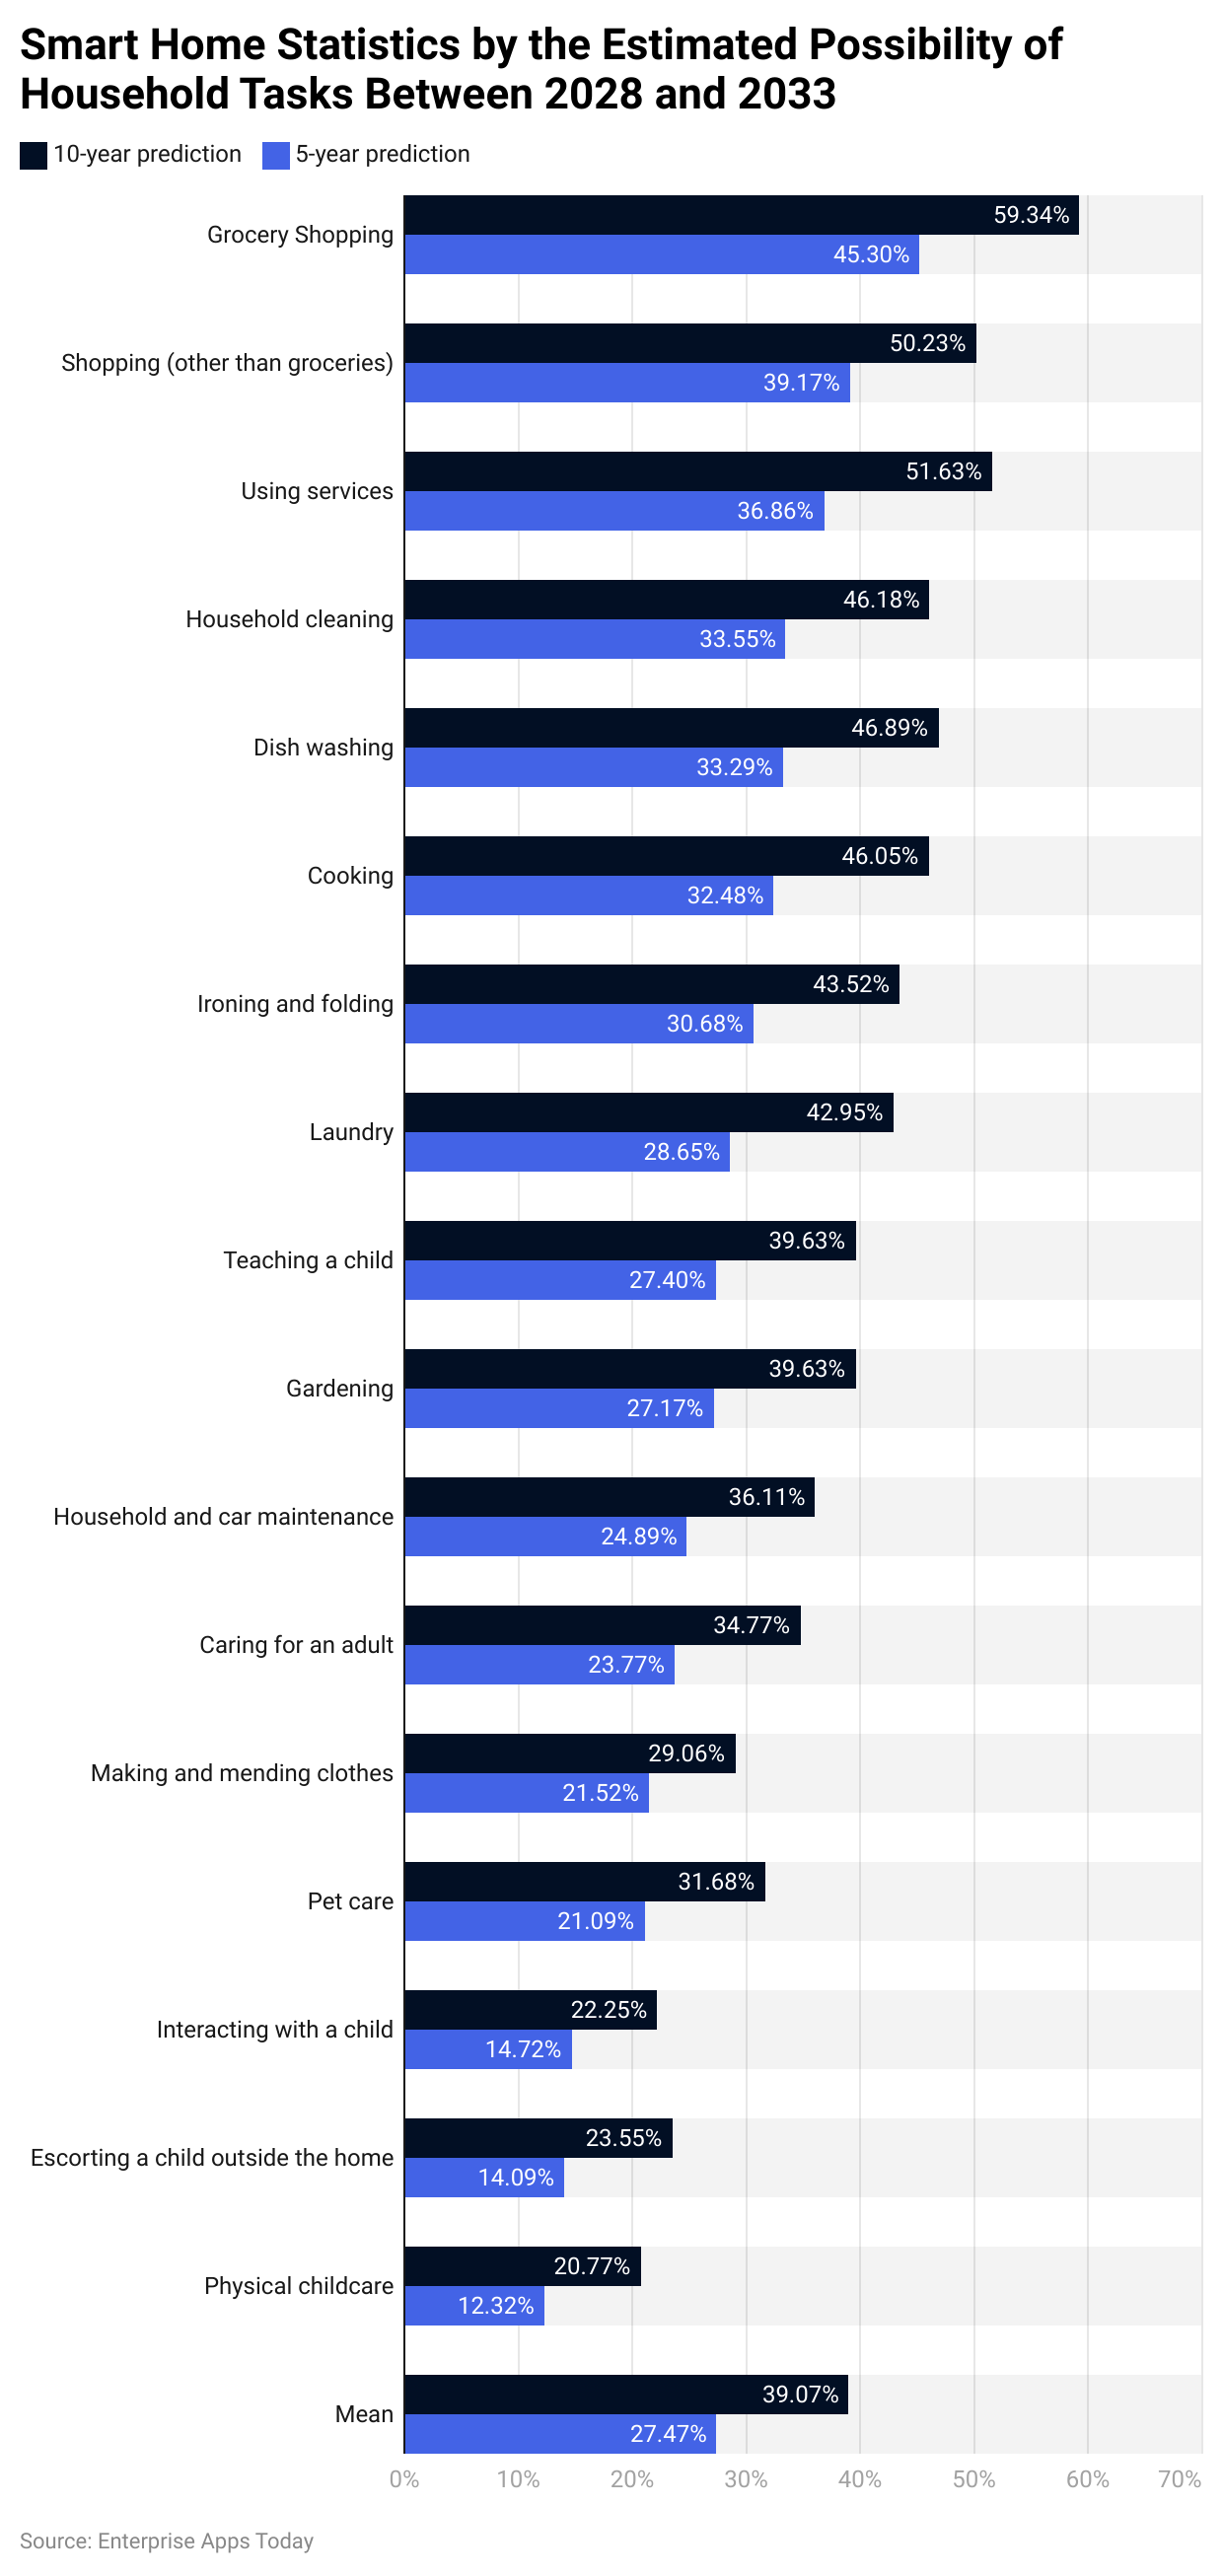
- By 2033, Grocery shopping is more likely to become an automated task considering the smart home category. More than half of the shopping will be done by technology resulting in 60%.
- According to the above automation statistics by Statista, in the coming years, almost everything will be controlled by technology.
By Reasons to Own Smart Home Devices
 (Reference: deloitte.com)
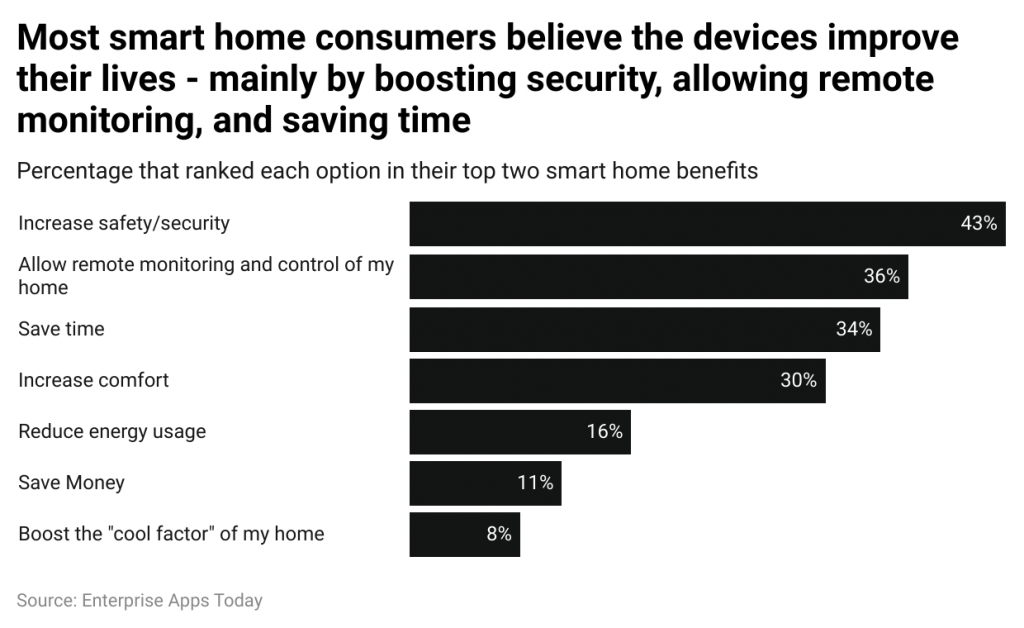
- The majority of the respondents for a survey conducted by Deloitte in 2023, majority of the Americans said smart home devices increase their safety or security resulting in 43%.
- The top reasons to use this technology are the possibility of remote monitoring and controlling (36%) and saving time (34%).
By Smart Appliances Ownership Rate
 (Reference: statista.com)
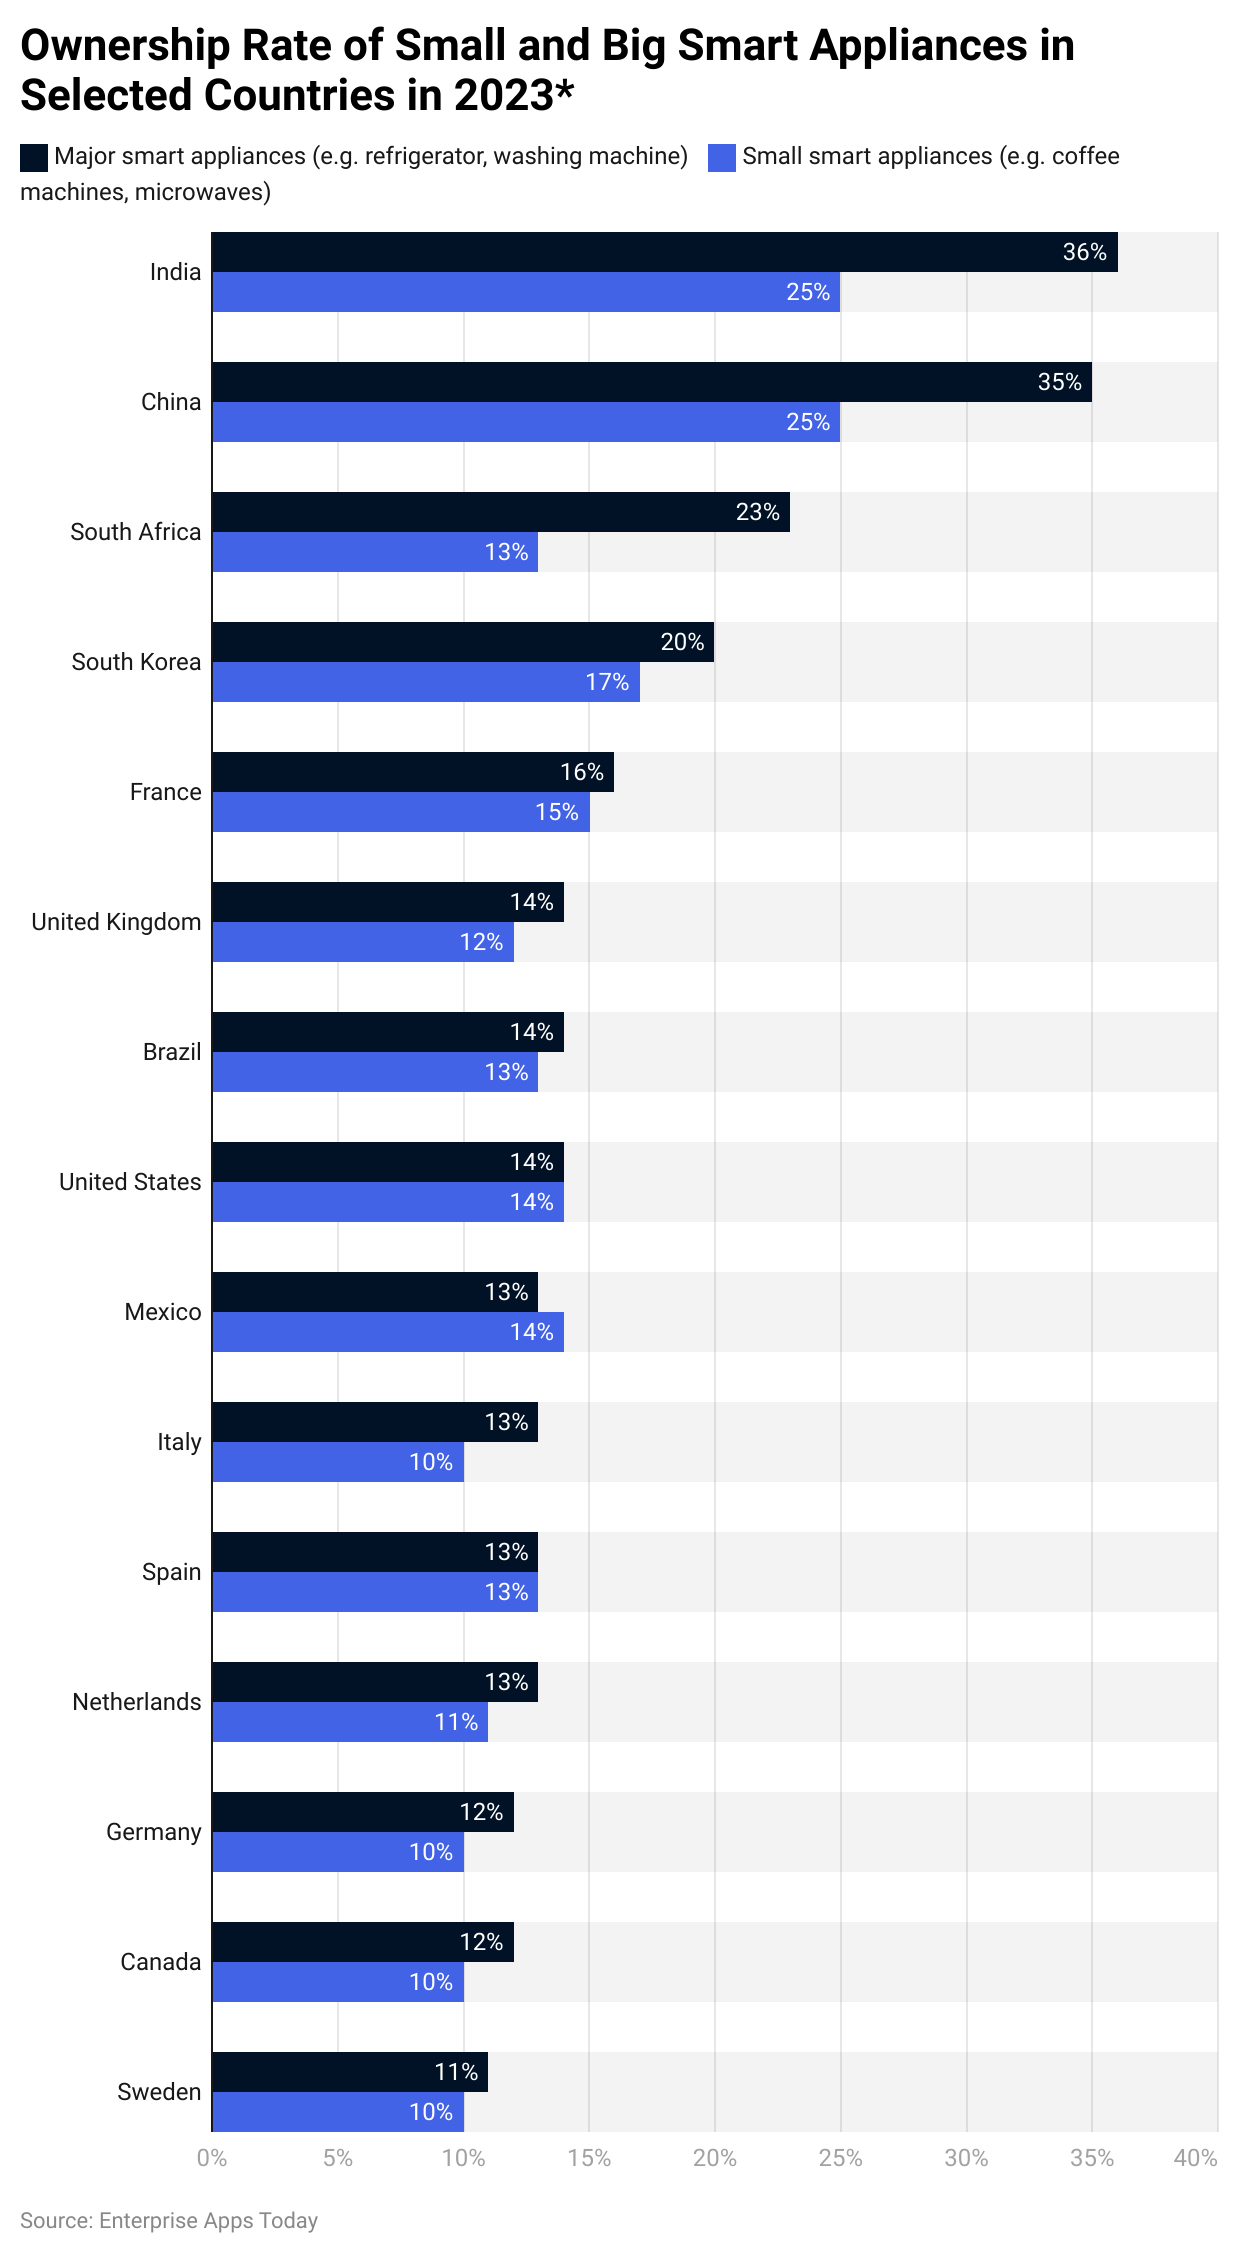
- According to Smart Home Statistics compared to the global status of smart appliances ownership rate, the highest number of owners reside in India resulting in Small smart appliances (25%) and large smart appliances (36%).
- Following India, China has a great number of large smart appliance owners resulting in 35%. On average, large and small appliance owners in other countries have a balanced ratio.
Conclusion
Smart technology is addictive, and rather you playing with buttons and controlling it, this smart technology has already started controlling our brains. However, smart appliances and devices save a lot of time, more specifically reduce human work. These devices are actually a boon to our society. Thus, concluding Smart Home Statistics, it is confirmed that the market has ever-growing demand in product and service categories for all years to come.
Smart home devices are connecting us with our homes even when we are miles away, and thus this is a promising technology to help us simplify our lives!
Sources

Barry Elad is a passionate technology and finance journalist who loves diving deep into various technology and finance topics. He gathers important statistics and facts to help others understand the tech and finance world better. With a keen interest in software, Barry writes about its benefits and how it can improve our daily lives. In his spare time, he enjoys experimenting with healthy recipes, practicing yoga, meditating, or taking nature walks with his child. Barry’s goal is to make complex tech and finance information easy and accessible for everyone.