Luxury Goods Statistics By Market(Size, Share, Sales), Revenue, Key Players, Value Chain, Trends And Facts (2025)
Updated · Oct 20, 2025

Table of Contents
- Introduction
- Editor’s Choice
- Luxury Goods Market Size Analysis
- National Share
- Revenue Statistics By Country
- United States Luxury Goods Market Statistics
- Purchase Behavior by Age Group
- Brand Popularity in the United States
- Global Average Revenue Per Capita
- By Types
- Global Competitive Analyses
- Top 10 Luxury Goods Companies
- Key Driving Factors
- Value Chain Analysis
- Conclusion
Introduction
Luxury Goods Statistics: The global luxury goods market has become one of the most active and steady parts of consumer spending. Higher incomes, modern living, and growing aspirations have increased demand for high-end products such as clothing, jewellery, watches, cars, and beauty items. Once led mainly by Europe, the industry is now expanding quickly in the Asia-Pacific, especially in China and India.
In recent years, as the demand for online shopping, influencer marketing, and sustainable production has transformed, all the luxury brands have started engaging actively with their audience. Such brands now emphasise personalised creations, limited-edition products, and environmentally friendly materials to attract younger, digitally aware consumers who value both style and sustainability.
This article on Luxury Goods Statistics includes several current statistical analyses from different insights that will guide you effectively in understanding the overall market.
Editor’s Choice
- As of 2024, the global luxury goods market has generated USD 368.94 billion and is estimated to reach USD 382.20 billion by the end of 2025.
- In the global luxury goods market, by the end of 2025, the luxury fashion market is projected to grow to USD 120.1 billion, followed by luxury leather goods (USD 82.7 billion).
- In 2024, online sales made up 15.5% of the global luxury goods market, while offline sales held 84.6%.
- Looking ahead to 2030, the global personal luxury market is projected to reach 3.3 trillion RMB (roughly USD 450 billion), with mainland China expected to dominate 40% of total global luxury sales.
- The global luxury goods market revenue is led by the United States with USD 77,820 million in revenue, followed by China at USD 56,080 million.
- In 2025, the luxury goods market in the United States will be worth USD 112.68 billion.
- As of 2024, the clothing and apparel market of the United States captured the largest share with 32.3%.
- Single-brand stores dominated with a 41.5% share in the U.S. luxury goods market.
- Gucci and Louis Vuitton share the top spot, each admired by 45% of U.S. luxury shoppers.
- The average revenue per capita within the luxury goods market accounted for USD 46.16 billion in 2023 and USD 47.61 billion in 2024.
- Chanel leads with a 6% market share, followed closely by Dior at 5% and Louis Vuitton and Gucci, each holding 4%.
- The luxury goods market is influenced by several key factors, including Brand image, which holds the strongest influence, accounting for 24%.
- Manufacturers and distribution platforms dominated the global luxury goods value chain, each holding a 30% share.
Luxury Goods Market Size Analysis
 (Source: market.us)
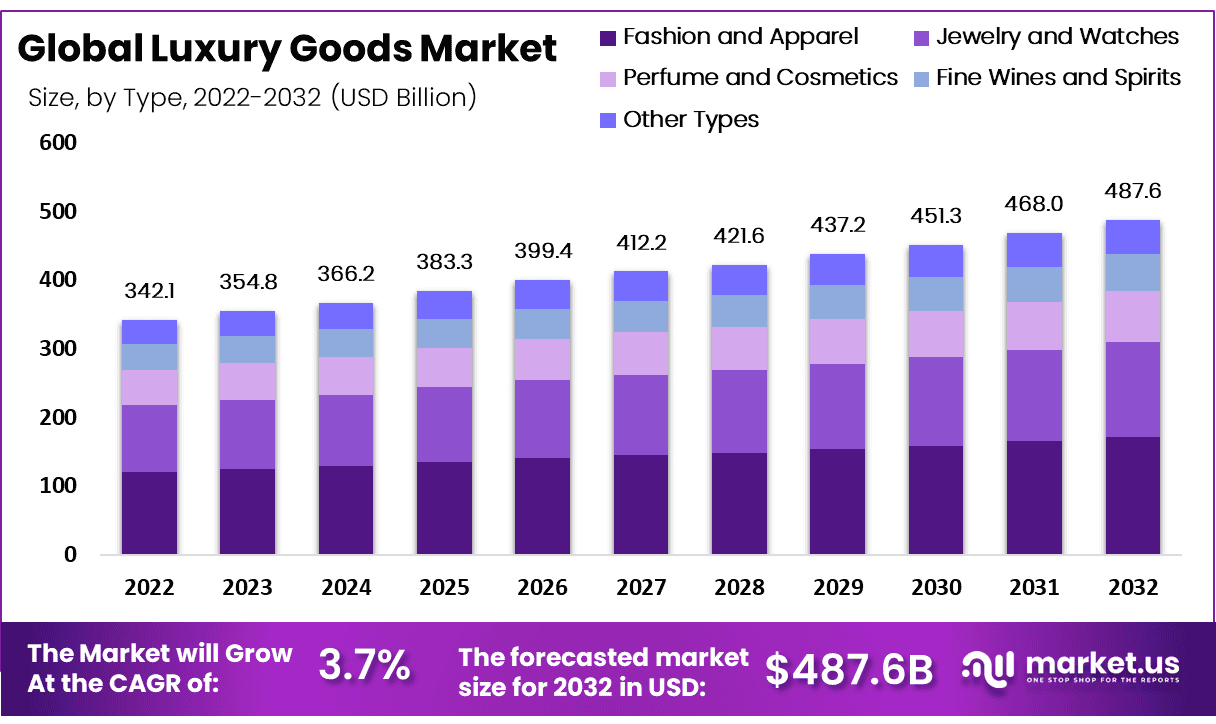
- As of 2024, the global luxury goods market has accounted for USD 368.94 billion and will reach USD 382.20 billion by the end of 2025.
- In the coming years, the market size is expected to reach USD 399.4 billion by 2026, USD 412.2 billion by 2027, USD 421.6 billion by 2028, USD 437.2 billion by 2029, USD 451.3 billion by 2030, USD 468 billion by 2031, and USD 487.6 billion by 2032.
- The market will grow at a CAGR of 3.7% from 2025 to 2032.
By Type
 (Reference: market.us)
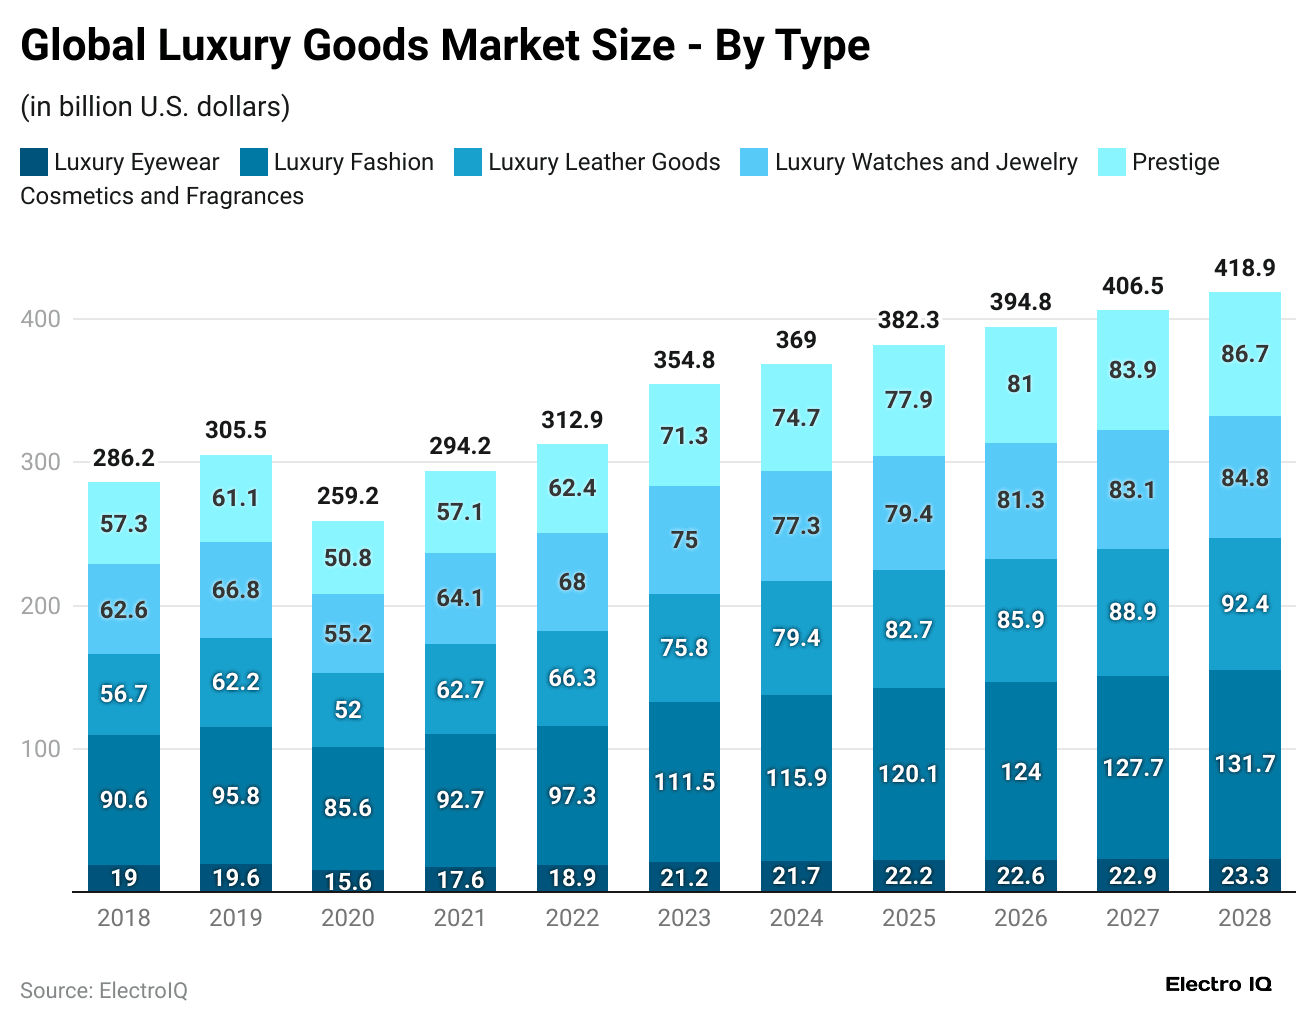
- By 2025, the global luxury fashion market is expected to be USD 120.1 billion.
- Besides, the luxury leather goods segment will reach USD 82.7 billion.
- Furthermore, other segments’ market size is estimated as luxury watches and jewellery (USD 79.4 billion), prestige cosmetics and fragrances (USD 77.9 billion), and luxury eyewear (USD 22.2 billion).
In the coming year, the Luxury Goods market size types are stated in the table below:
| Types | 2026 | 2027 | 2028 |
| (USD billion) | |||
|
Luxury Eyewear |
22.6 | 22.9 | 23.3 |
| Luxury Fashion | 124 | 127.7 |
131.7 |
|
Luxury Leather Goods |
85.9 | 88.9 | 92.4 |
| Luxury Watches & Jewellery | 81.3 | 83.1 |
84.8 |
| 81 | 83.9 |
86.7 |
|
By Sales Channel
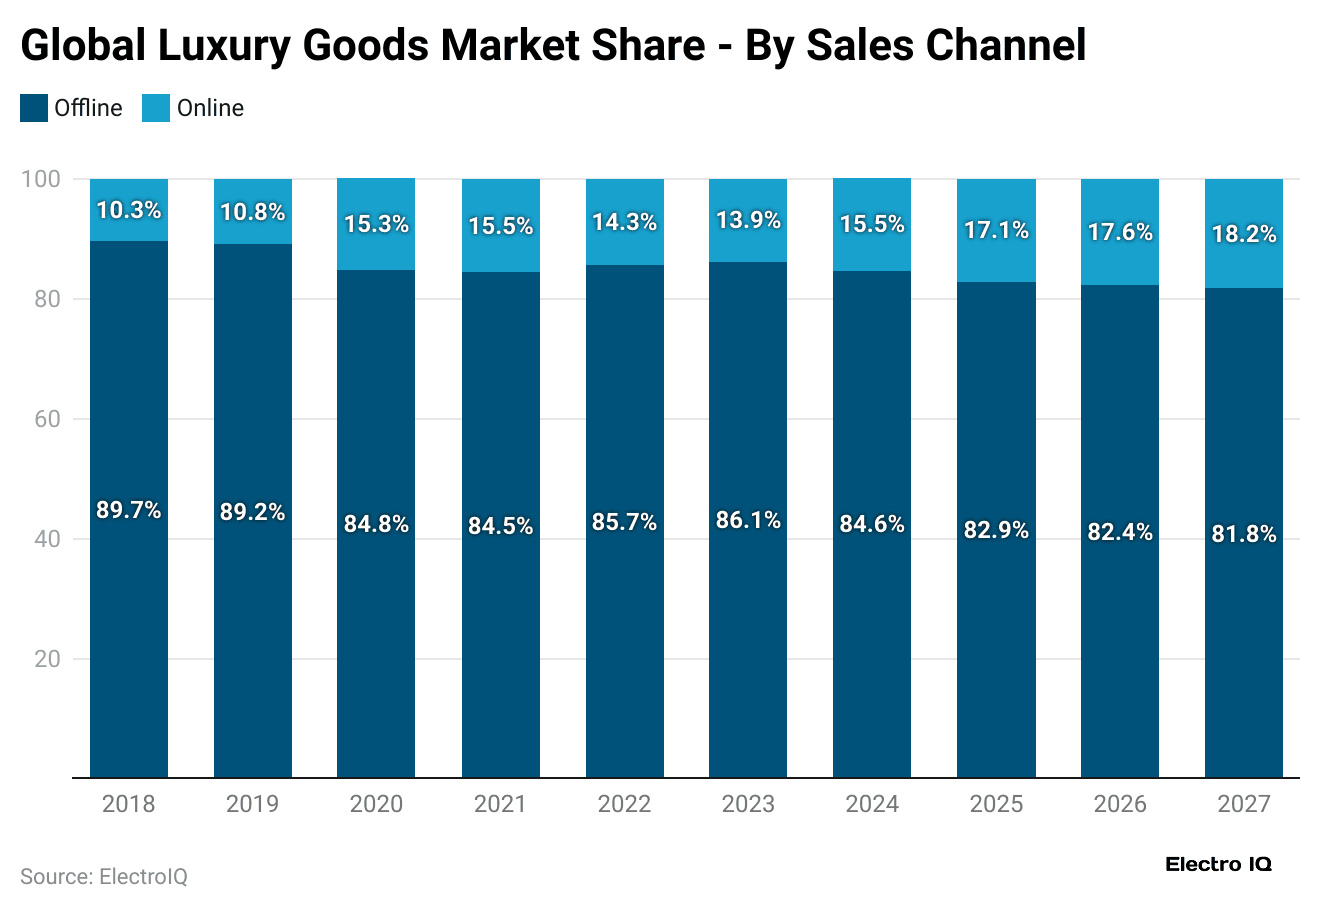
- As of 2024, online sales accounted for 15.5% of the luxury goods market, while offline sales held 84.6%.
- This upward trend for online shopping is expected to be 17.1% by 2025 as offline sales drop to 82.9%, from the previous year.
- By 2026, online sales are projected to grow slightly to 17.6%, with offline sales falling to 82.4%.
- By the end of 2027, online sales may rise further to 18.2%, while offline sales could decline to 81.8%.
 (Source: consultancy.asia)
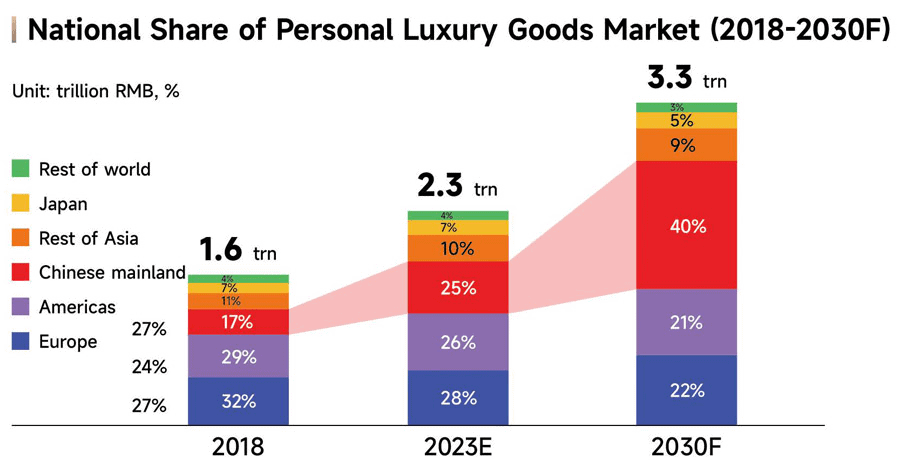
- The global personal luxury goods market in 2018 was valued at 1.6 trillion RMB (approximately USD 220 billion).
- In contrast, Europe accounted for a 32% share, followed by the Americas at 27%, and China at 17%.
- In 2023, the market expanded to 2.3 trillion RMB (around USD 315 billion), where China’s share increased to 25%, while Europe and the American region accounted for 28% and 26%, respectively.
- By the end of 2030, the market is projected to reach 3.3 trillion RMB (roughly USD 450 billion), with mainland China expected to dominate by 40% of the total luxury sales globally.
- Meanwhile, Europe’s luxury goods market share will account for 22%, followed by the Americans (21%), the rest of Asia (9%), Japan (5%), and the rest of the world (3%).
Revenue Statistics By Country
 (Reference: market.us)
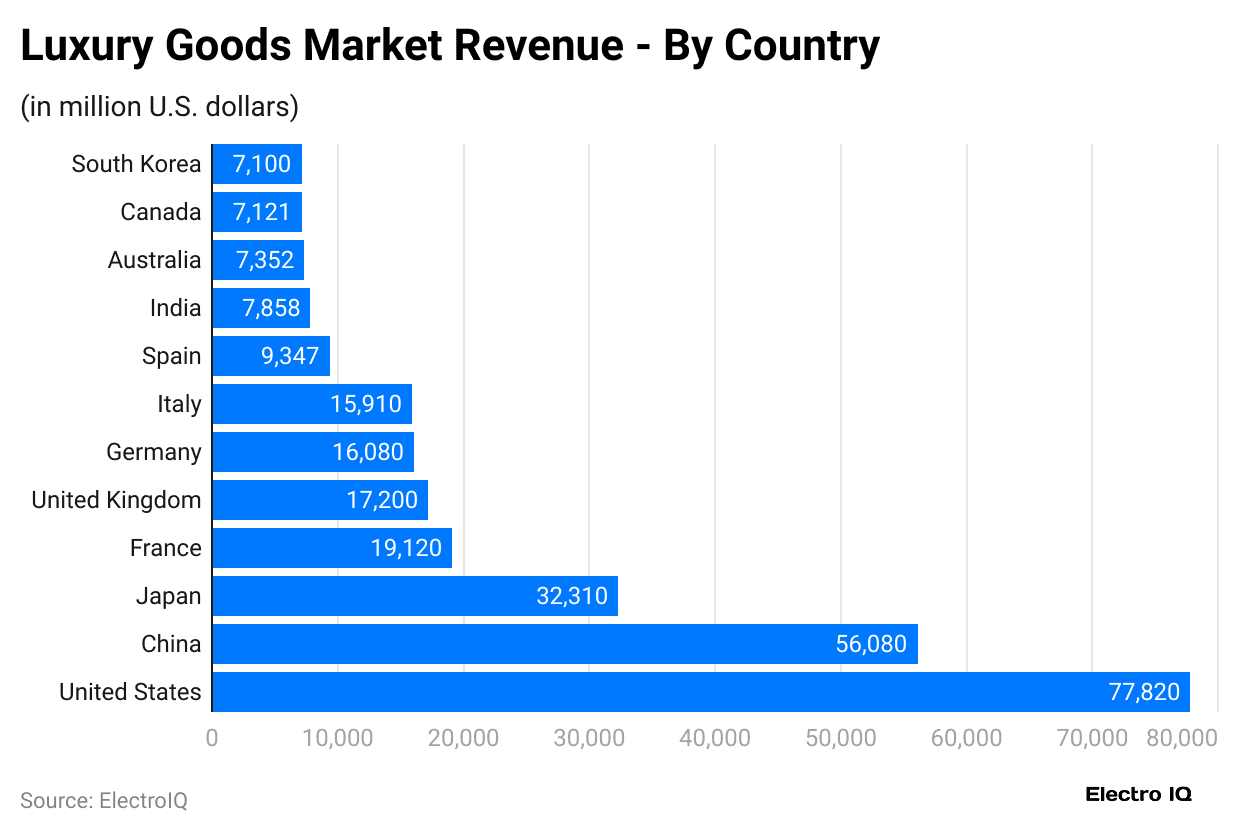
- The United States captured the highest revenue, resulting in USD 77,820 million in 2024, followed by China at USD 56,080 million.
- Moreover, the total revenue generated by other countries are estimated as Japan (USD 32,310 million), France (USD 19,120 million), The United Kingdom (USD 17,200 million) and Germany (USD 16,080 million), Italy (USD 15,910 million), Spain (USD 9,347 million), India (USD 7,858 million), Australia (USD 7,352 million), Canada (USD 7,121 million), and South Korea (USD 7,100 million).
United States Luxury Goods Market Statistics
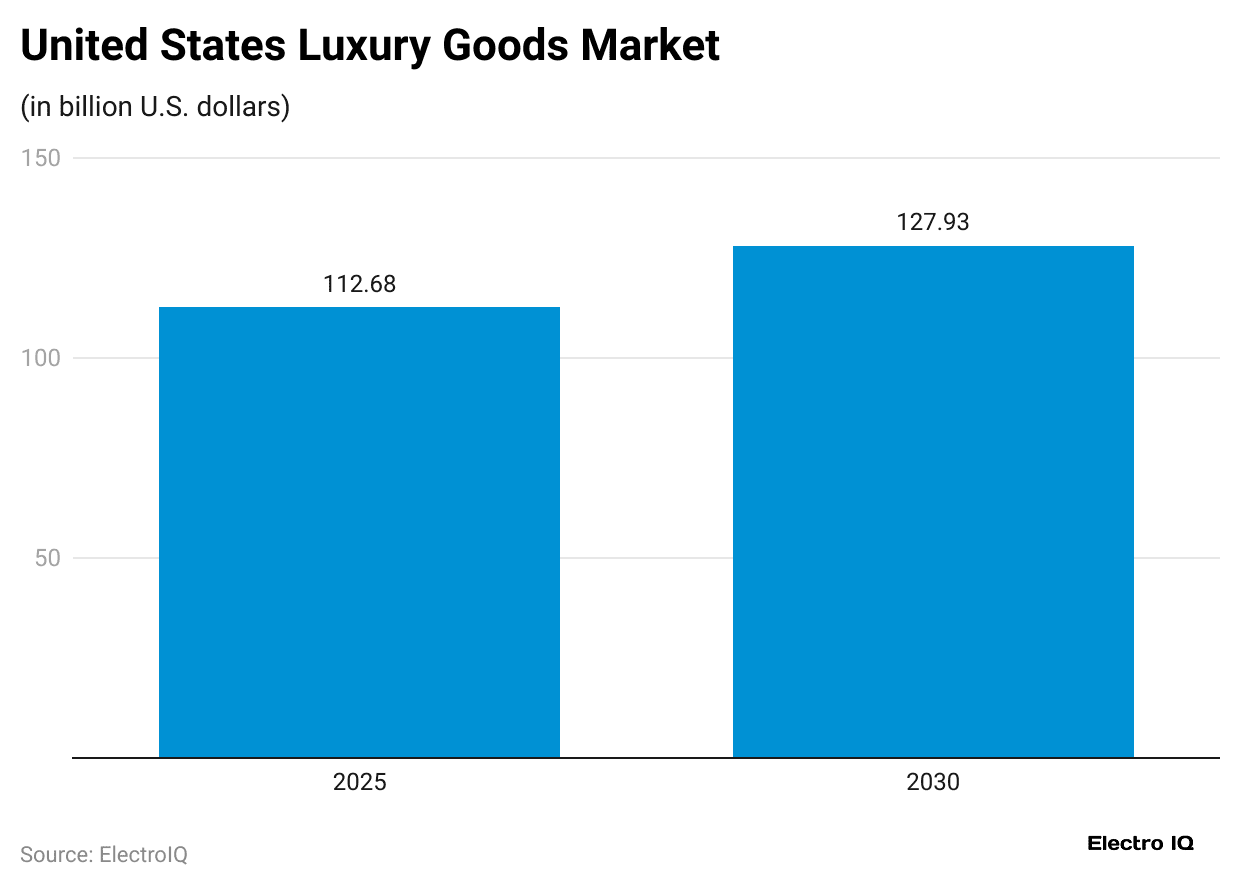
- In 2025, the luxury goods market in the United States is estimated to be worth USD 112.68 billion.
- It is expected to grow steadily at a 2.57% CAGR, reaching about USD 127.93 billion by 2030.
- The luxury goods market shows strong performance in clothing and apparel, which dominate the industry, accounting for about 32.25% of total sales. In comparison, leather products are forecast to grow at a 2.73% CAGR by 2030.
- From an end-user perspective, women remain the primary buyers, representing nearly 54.88% of the market, whereas the men’s segment will reach a 3.03% CAGR over the coming years.
- In terms of sales channels, single-brand outlets lead with a 41.47% share, and online retail platforms are expected to grow at a 3.56% CAGR from 2025 to 2030.
By Product Type
 (Reference: mordorintelligence.com)
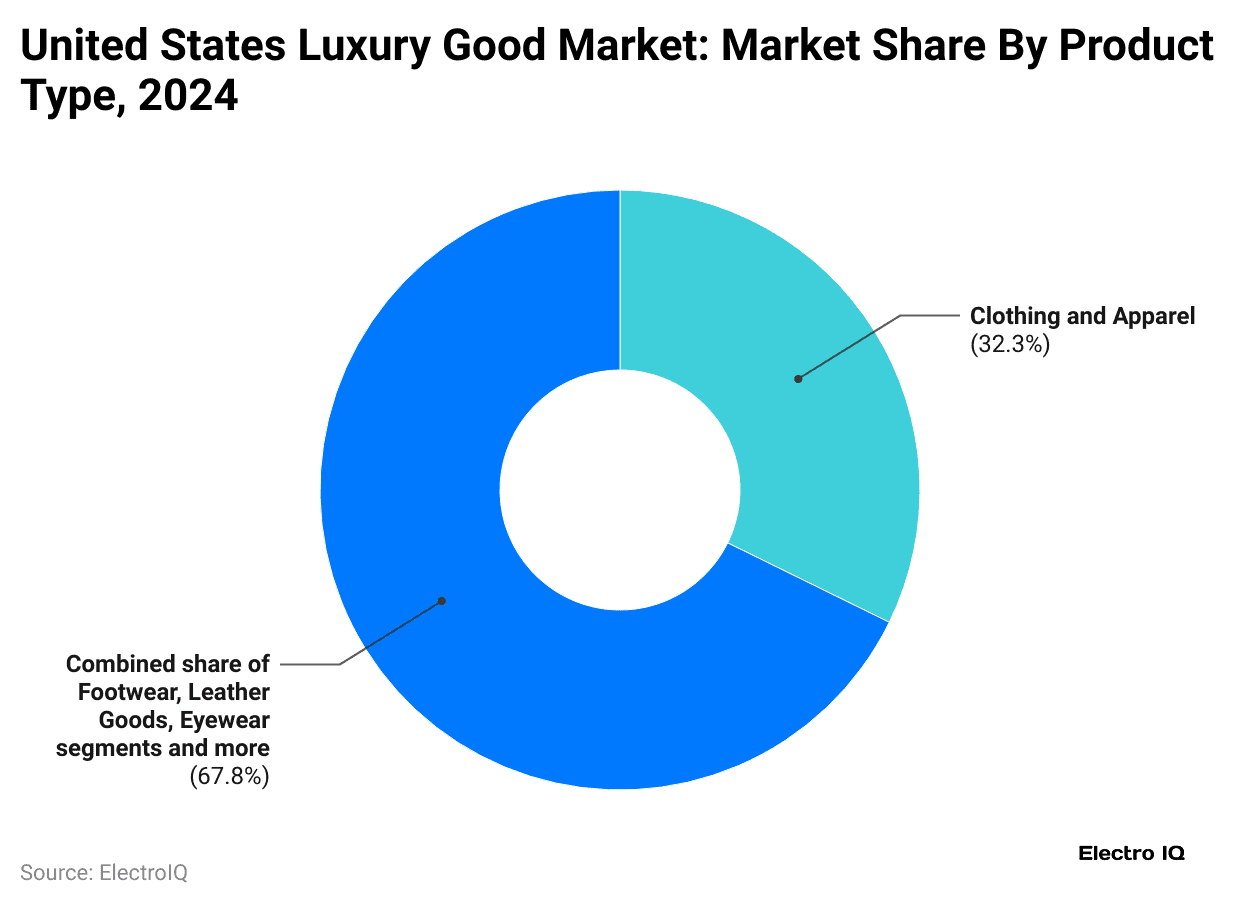
- As of 2024, in the United States, the clothing and apparel market captured the largest share of 32.3%.
- Meanwhile, segments like footwear, leather goods, eyewear, and others secured a market share of 67.8%.
By Distribution Channel
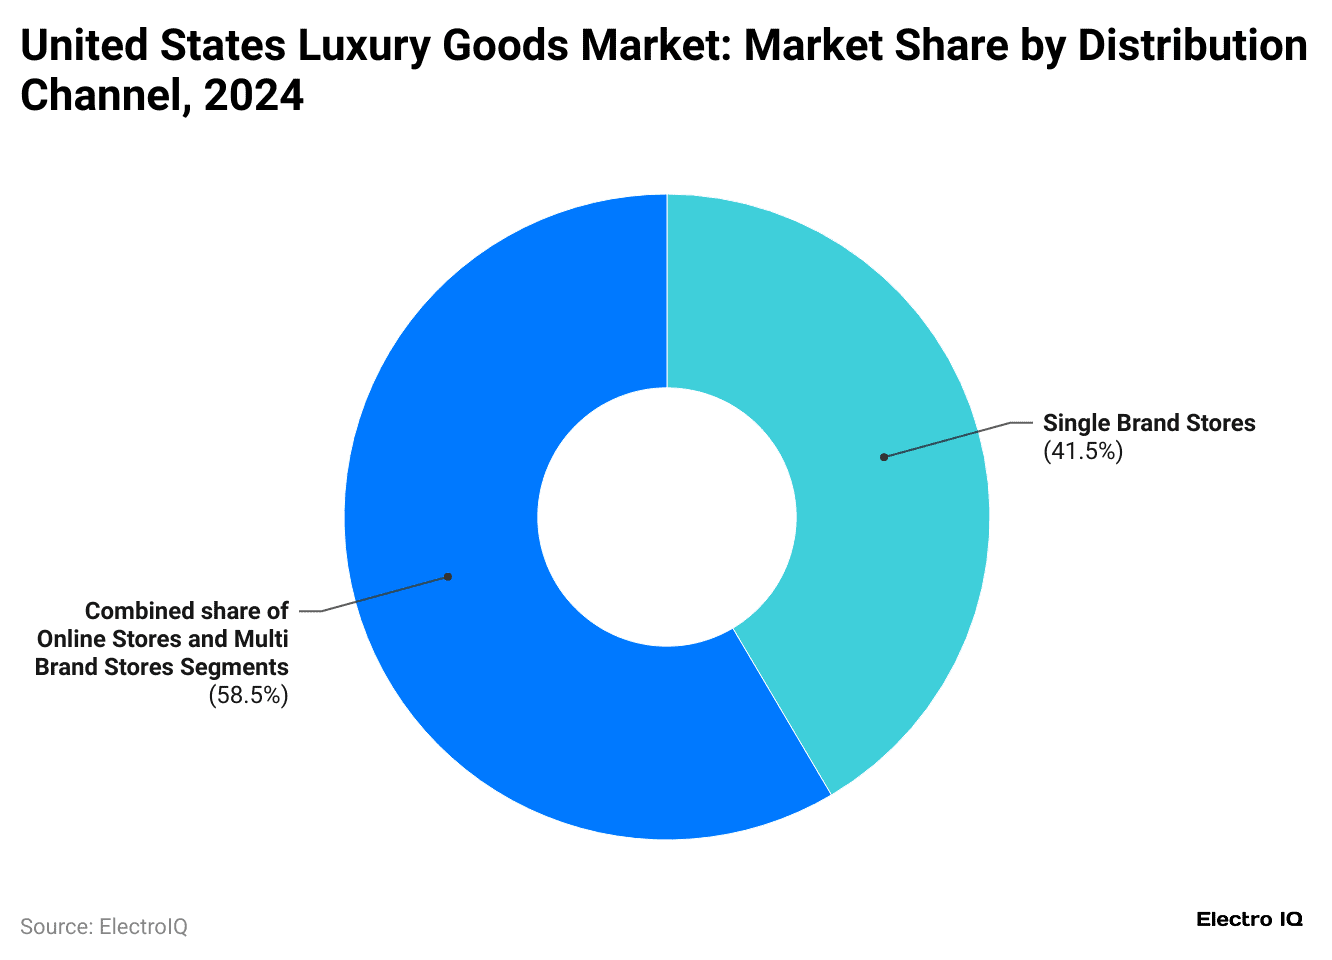 (Reference: mordorintelligence.com)
- In the United States, most sales of the luxury goods market come from single-brand stores, with 41.5% of total revenue.
- On the other hand, 58.5% of the luxury goods revenue share was made via online platforms and multi-brand retail outlets.
Purchase Behavior by Age Group
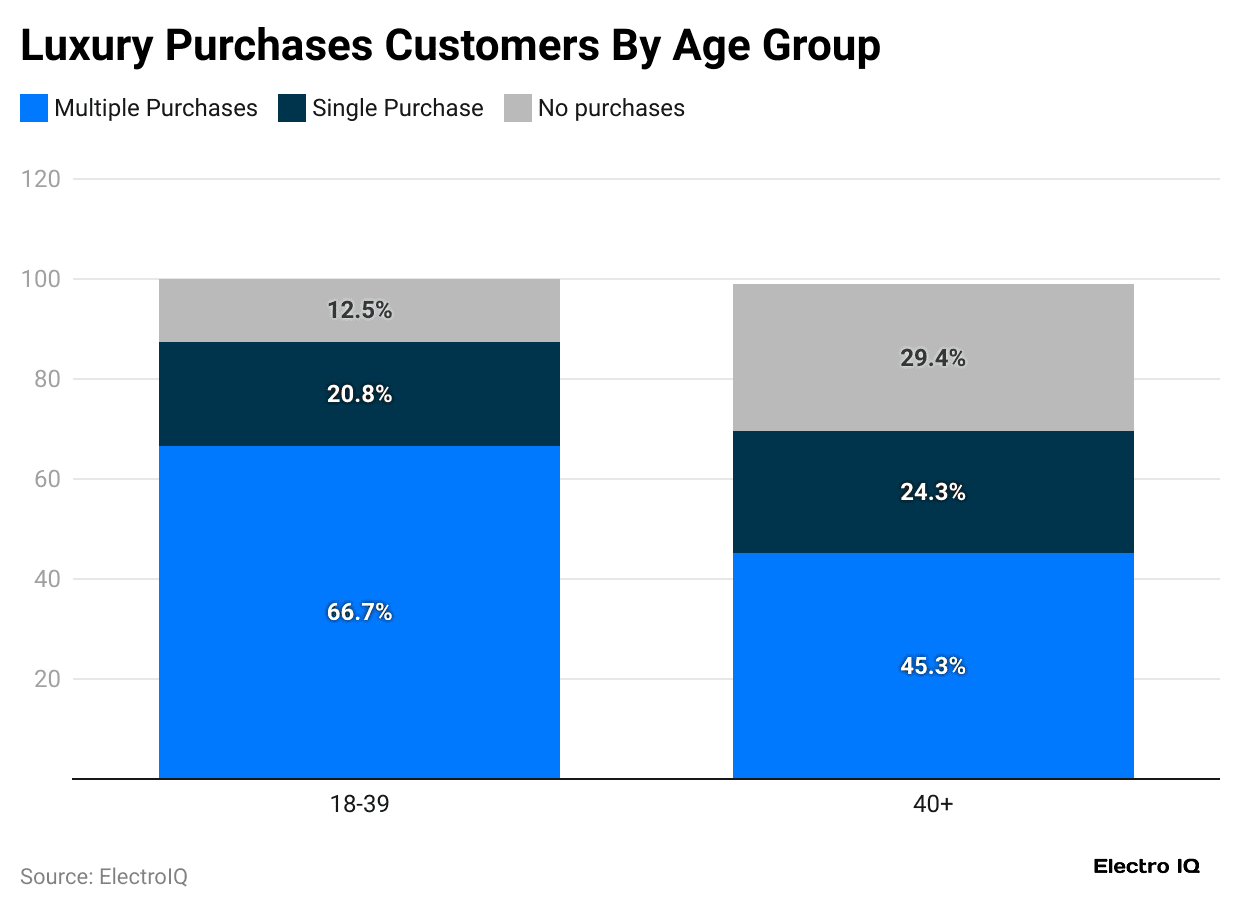 (Reference: brandsgateway.com)
- As of 2024, almost 20.8% American consumers aged from 18 to 39 years made up only a single purchase.
- Meanwhile, 66.7% made multiple purchases, and only 12.5% made no purchase.
- Besides, 45.3% buyers aged 40 years and above just made multiple purchases, 29.4% made no luxury purchases, and 24.3% only once.
Brand Popularity in the United States
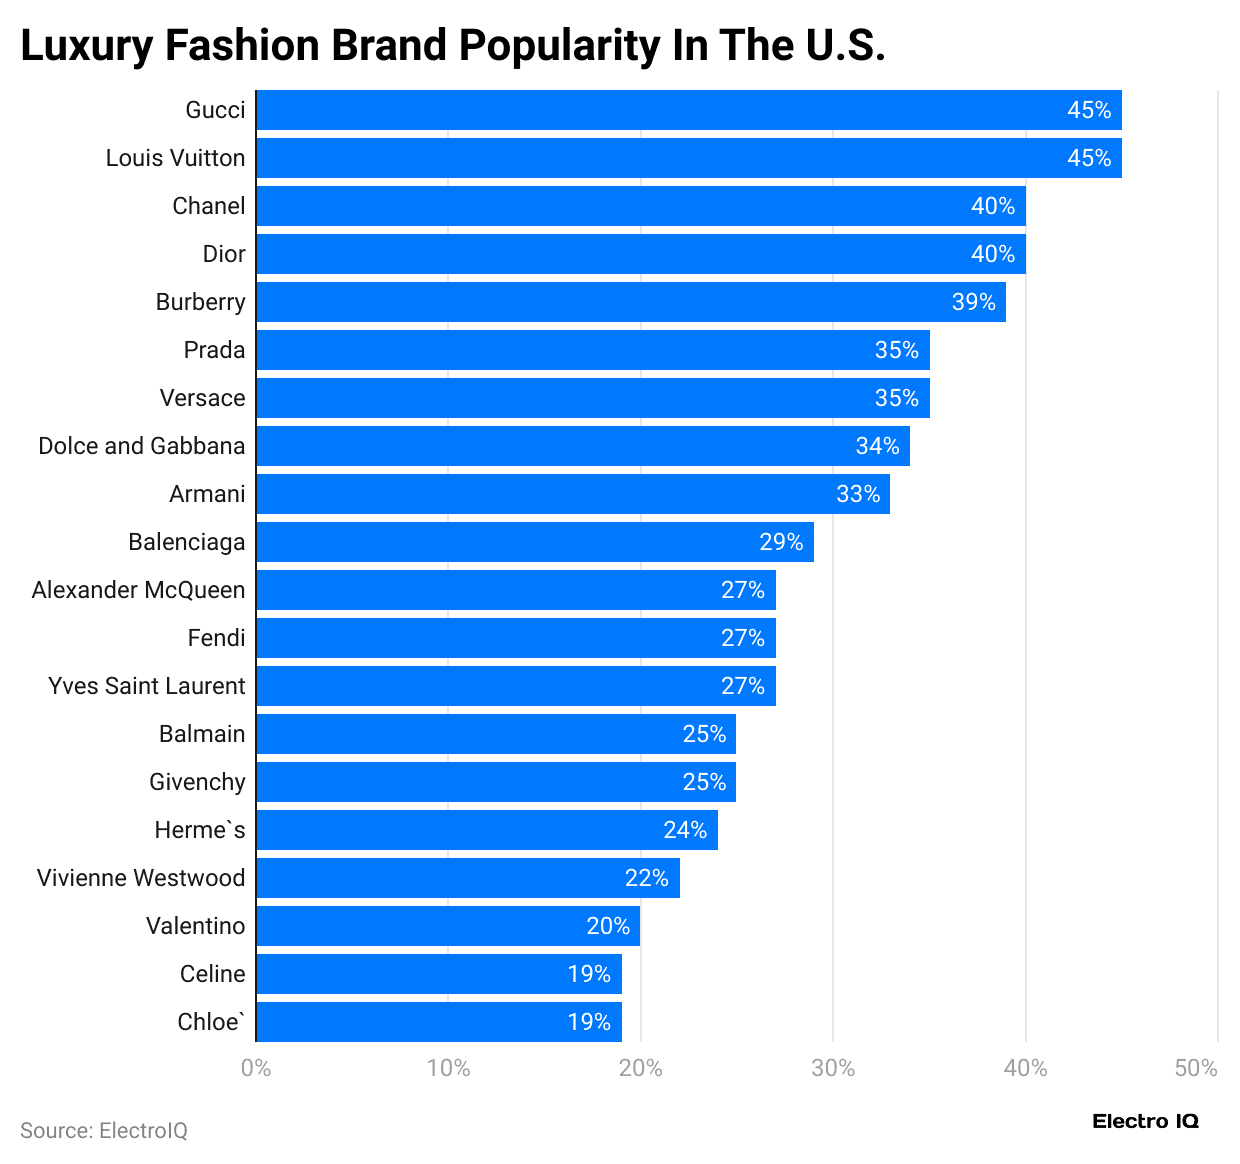 (Reference: brandsgateway.com)
- In the U.S., 2024, Gucci and Louis Vuitton were the most preferred luxury brands with a popularity share of 45%, followed by Chanel and Dior (40%), and Burberry (39%).
- Prada and Versace each capture 35%, and Dolce & Gabbana maintains 34% popularity.
- Other notable names include Armani (33%), Balenciaga (29%), and Alexander McQueen (27%), Fendi (27%), Yves Saint Laurent (27%), Balmain (25%), Givenchy (25%), Hermès (24%), Vivienne Westwood (22%), Valentino (19%), Celine (19%), and Chloe (19%).
Global Average Revenue Per Capita
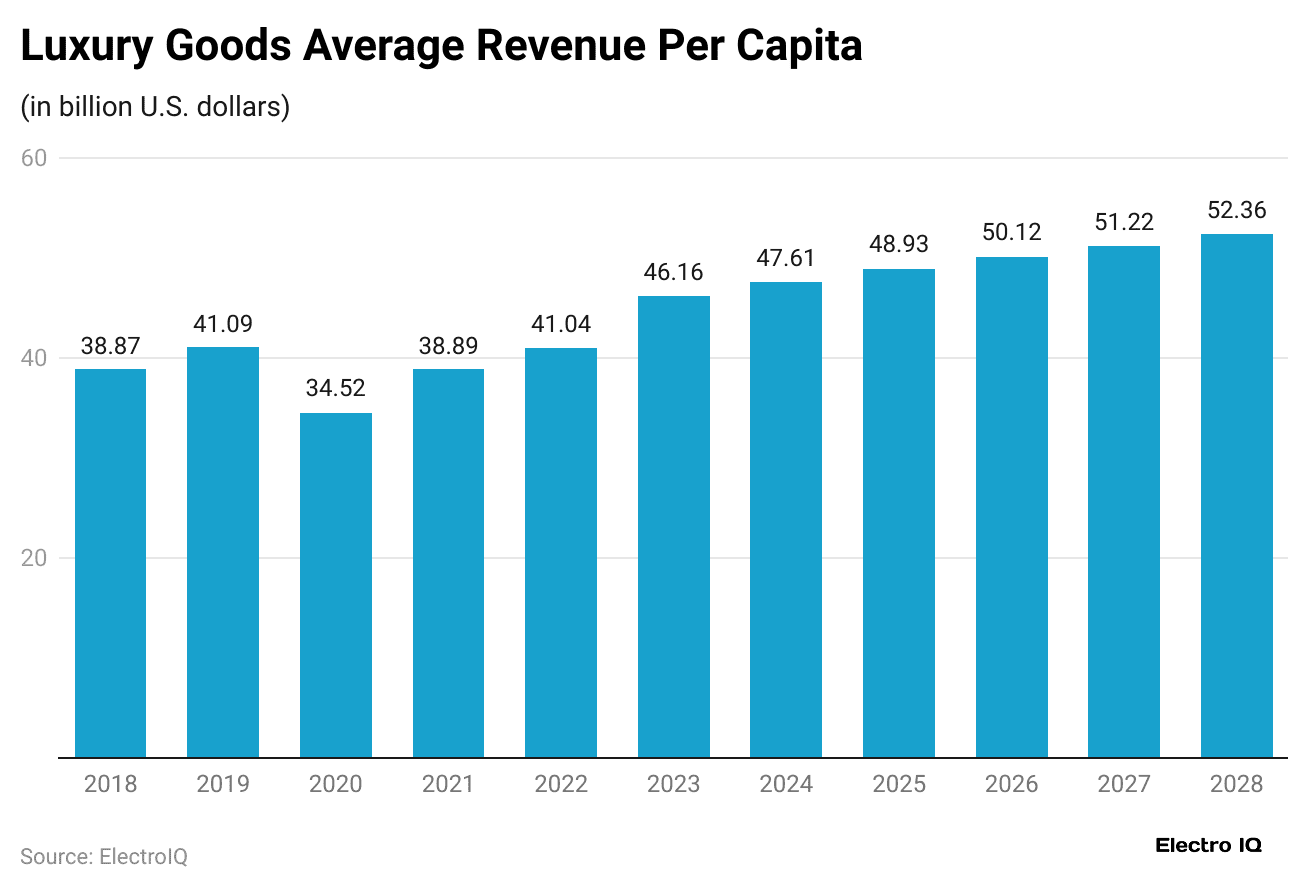 (Reference: market.us)
- The above chart shows that the average revenue per capita within the luxury goods market accounted for USD 46.16 billion in 2023 and USD 47.61 billion in 2024.
- In the coming years, the average revenue per capita is estimated to be USD 48.93 billion by 2025, followed by USD 50.12 billion (2026), USD 51.22 billion (2027), and USD 52.36 billion (2028).
By Types
| Types | 2024 | 2025 | 2026 | 2027 | 2028 |
| (USD billion) | |||||
| Luxury Eyewear | 2.8 | 2.8 | 2.9 | 2.9 | 2.9 |
| Luxury Fashion | 15 | 15.4 | 15.8 | 16.1 | 16.5 |
| Luxury Leather Goods | 10.2 | 10.6 | 10.9 | 11.2 | 11.6 |
| Luxury Watches & Jewellery | 10 | 10.2 | 10.3 | 10.5 | 10.6 |
| Prestige Cosmetics & Fragrances | 9.6 | 10 | 10.3 | 10.6 | 10.8 |
Global Competitive Analyses
 (Reference: market.us)
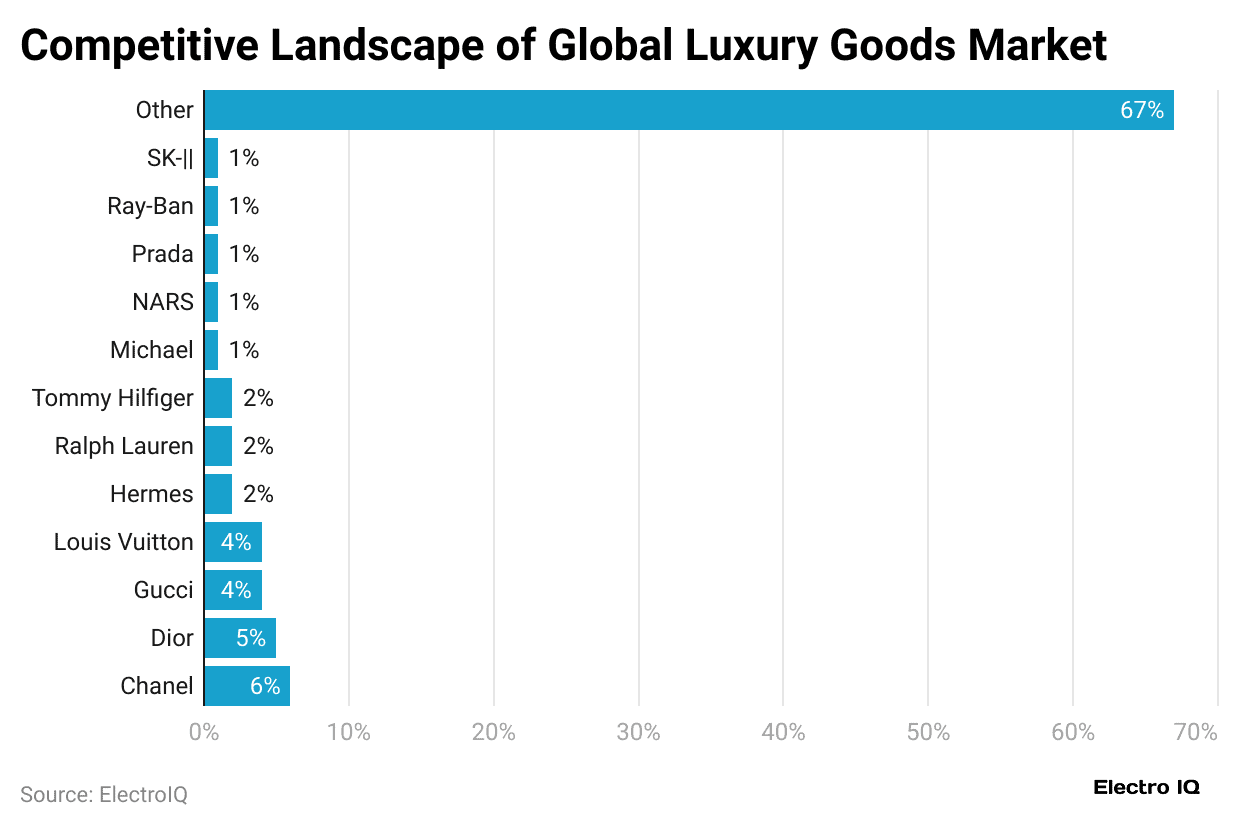
- According to the above chart, Chanel leads with a 6% market share, followed closely by Dior at 5% and Louis Vuitton and Gucci, each holding 4%.
- Hermès, Ralph Lauren, and Tommy Hilfiger each capture around 2% of the market.
- Meanwhile, brands like Michael Kors, NARS, Prada, Ray-Ban, and SK-II account for 1% each.
- The remaining 67% of the market is shared among various other luxury brands.
Top 10 Luxury Goods Companies
| Company Name (Country) | Annual Revenue (USD billion) | Share Price (USD) | 30-Day Price Trend |
|
LVMH (Moët Hennessy Louis Vuitton) (France) |
88.12 | 641.80 | 1.17% |
| Christian Dior SE
(France) |
88.12 | 600.67 | 1.08% |
|
Rajesh Exports Ltd. (India) |
49.79 | 2.04 | 1.52% |
| EssilorLuxottica SA
(France) |
27.58 | 320.09 | 0.77% |
|
Compagnie Financière Richemont SA (Switzerland) |
23.15 | 191.94 | 1.22% |
| Kering SA
(France) |
17.89 | 366.68 | 2.14% |
|
Hermès International S.A. (France) |
15.78 | 2,412 | 2.02% |
| Chow Tai Fook Jewellery Group
(Hong Kong) |
11.52 | 1.95 | 1.40% |
| Titan Company Ltd. (India) | 7.37 | 39.82 | 0.05% |
| Signet Jewellers Ltd.
(Bermuda) |
6.77 | 92.31 | 4.27% |
Key Driving Factors
 (Reference: researchgate.net)
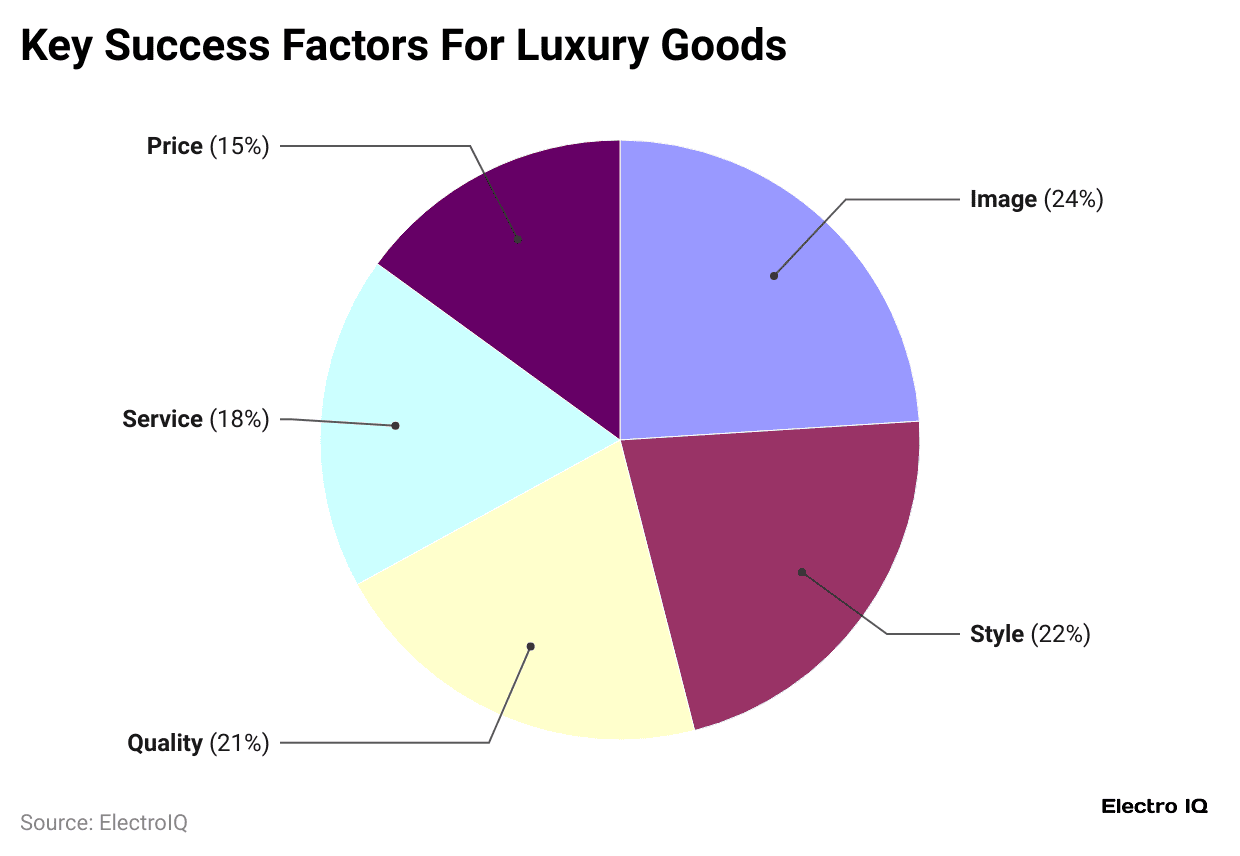
- The luxury goods market is influenced by several key factors, including Brand image, which holds the strongest influence, accounting for 24%.
- Other factors are followed by style (22%), product quality (21%), customer service (18%), and price (15%).
Value Chain Analysis
 (Reference: alliedmarketresearch.com)
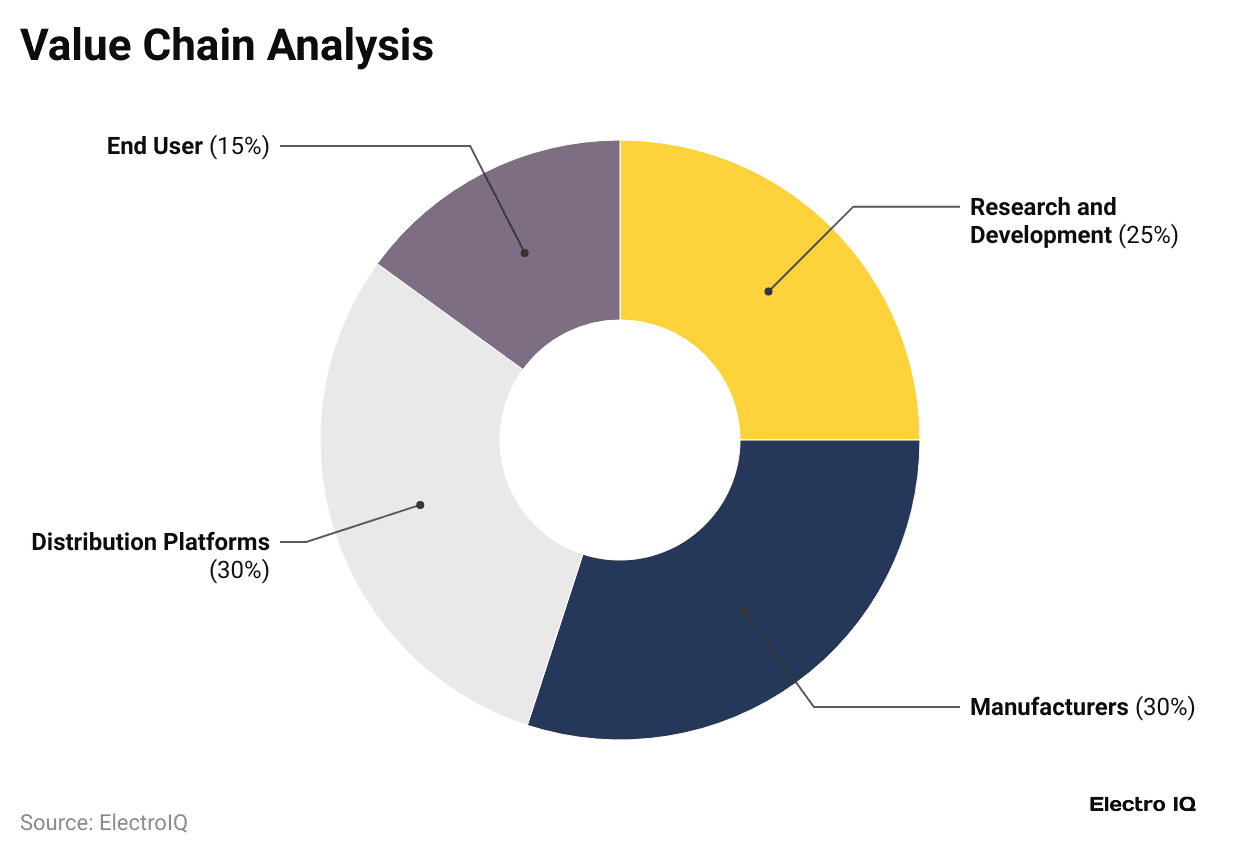
- Manufacturers and distribution platforms dominate the global luxury goods value chain, each holding a 30% share.
- Followed by Research and development (R&D) that accounted for 25%, and the end user segment, with 15%.
Conclusion
The article on Luxury Goods Statistics shows that the luxury goods market has been expanding enormously in recent years. The market is growing with modern technological advancements that allow it to attract today’s consumers. The leading luxury goods brands are mainly focusing on online presence, sustainability, and personalised experiences that include growing incomes of business and fulfilling a strong desire for premium lifestyles.
Luxury products are now becoming more eco-friendly and easier to buy, attracting customers who care about social and environmental values. In the future, the brands that combine premium quality with responsible and ethical practices are likely to gain more attention and loyalty from modern, conscious consumers. The future of luxury will centre on trust, technology, and sustainability, while preserving its image of sophistication and global prestige.
Sources
FAQ.
Main categories include personal luxury goods, luxury cars, hospitality, and experiential segments such as fine dining, premium travel, and entertainment.
- Rising disposable income in emerging markets
- Expanding millennial and Gen Z luxury buyers
- Growth of e-commerce and social media influence
- Focus on sustainable and ethical production
- Travel retail recovery after COVID-19
In 2025, China, the United States, France, Italy, and Japan dominate global luxury spending, with China contributing around 25% to 30%.
Luxury brands increasingly use eco-friendly materials, ethical sourcing, and circular fashion as younger consumers favour sustainable yet exclusive products.
The luxury market is mainly driven by personal luxury goods, which account for over 70% of total sales, while luxury cars and hospitality services hold the next largest shares.

Maitrayee Dey has a background in Electrical Engineering and has worked in various technical roles before transitioning to writing. Specializing in technology and Artificial Intelligence, she has served as an Academic Research Analyst and Freelance Writer, particularly focusing on education and healthcare in Australia. Maitrayee's lifelong passions for writing and painting led her to pursue a full-time writing career. She is also the creator of a cooking YouTube channel, where she shares her culinary adventures. At Smartphone Thoughts, Maitrayee brings her expertise in technology to provide in-depth smartphone reviews and app-related statistics, making complex topics easy to understand for all readers.