Spam Statistics By Country, Email, Messages, Industry, Social Media And Facts (2025)
Updated · Jul 25, 2025


Table of Contents
- Introduction
- Editor’s Choice
- Most Spam Received Channels Statistics
- Email Spam Statistics
- Types of Email Spam Statistics
- User Response Statistics to Email Spam
- Text Message Spam Statistics
- By Types
- Share of Spam Text Messages Statistics by Industry
- By Frequency
- Phone Call Spam Statistics
- Victims of Spam Calls Statistics by Demographics
- Number of Spam Calls and Messages Statistics per Month in the U.S., 2025
- Social Media Spam Statistics
- Spam Share in Social Platform Statistics
- Conclusion
Introduction
Spam Statistics: In today’s digitally connected world, we all face the problem of online spam that is included within emails, text messages, social media chats, phone calls, and in many other segments. Globally, almost everyone gets some kind of spam every single day. In technology and cybersecurity, spam means unwanted messages sent to many people at once, usually with useless or harmful content.
This article will help you understand what spam is, where it comes from, and how it affects us so we can keep our emails safe and clean. Go through the overall article that includes several current statistical analyses from different insights that will allow you to understand the topic better.
Editor’s Choice
- According to DeBounce, nearly 97% of people have received scam-related spam messages through different channels.
- Among them, 49% said email is where they get the most spam.
- Phone calls came next at 26.5%, followed by text messages at 14.7%.
- Only 9.8% mentioned apps like WhatsApp or Facebook Messenger.
- Out of all the people who got spam messages or calls, over 57% lost money.
- Most people lost between USD 100 and USD 249, but 2.9% said they lost more than USD 1,000.
- According to a report from SlickText, people in the U.S. got around 19.2 billion spam texts in February 2025.
- Wikipedia says that more than 90% of social network users report experiencing spam such as fake links, promotional messages, or comment bots.
- In April 2025, people in the U.S. received nearly 5 billion robocalls, according to YouMail.
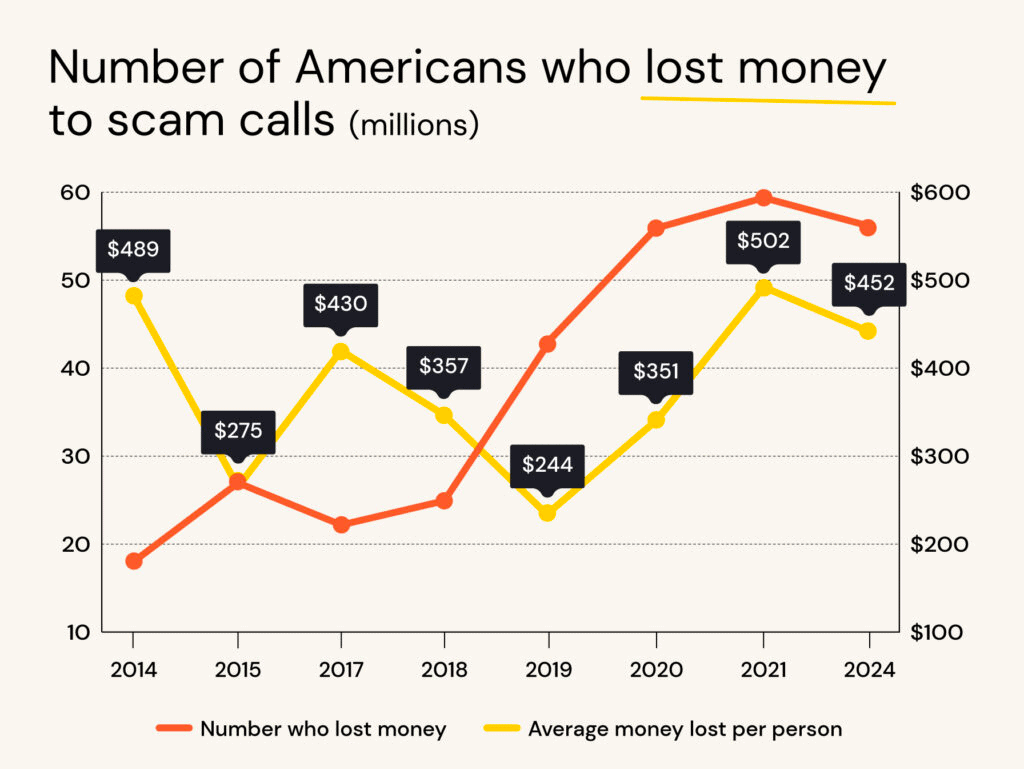
- According to the latest TrueCaller report, 56.2 million people lost a total of USD 25.4 billion to scam calls in one year, averaging a USD 452 loss per person.
Most Spam Received Channels Statistics
 (Reference: emailtooltester.com)
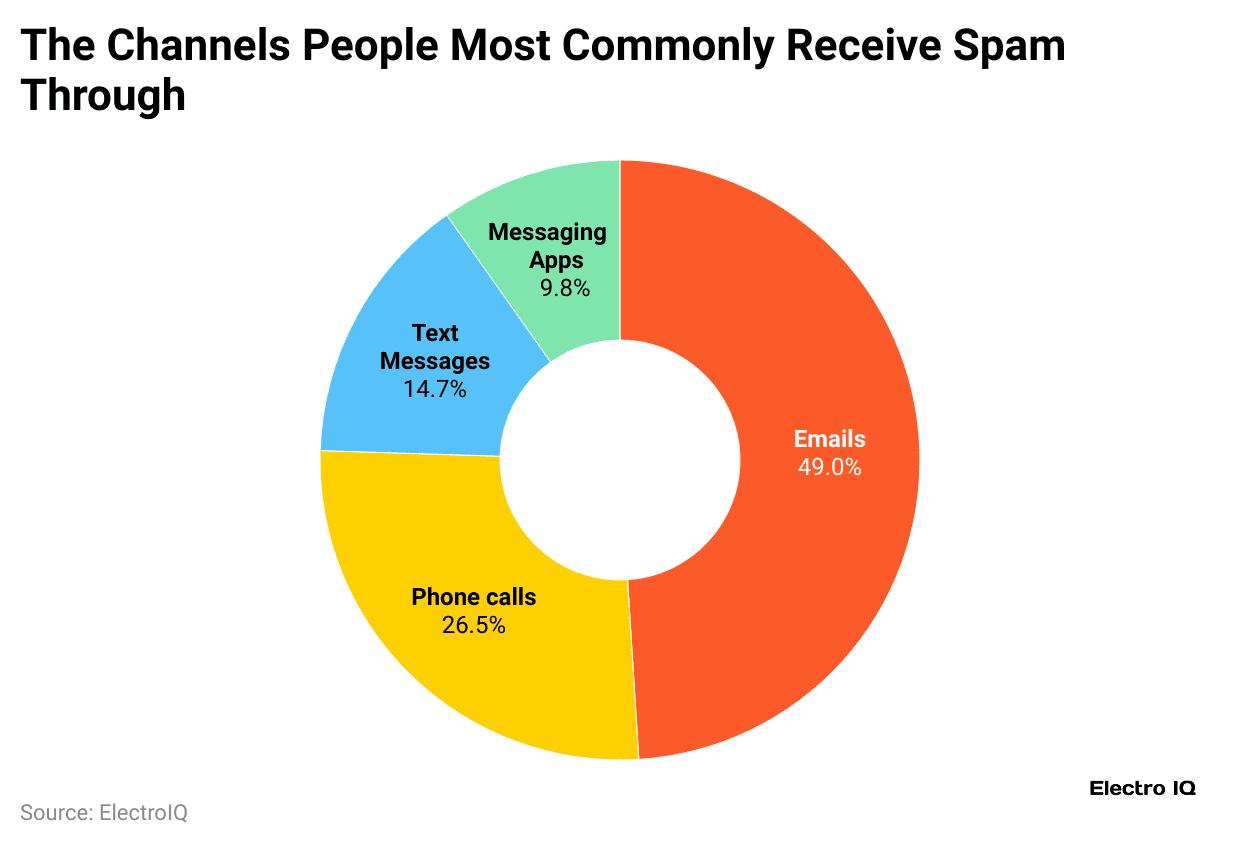
- The top source of receiving spam is captured via email, claimed by 49% of people.
- Spam also comes through phone calls (26.5%), text messages (14.7%), and apps like WhatsApp or Messenger (9.8%), but less often.
Email Spam Statistics
- According to the 2025 Debounce report, people now send and receive about 376.4 billion emails every day worldwide.
- About 49% of users say email is where they get the most spam.
- China and the U.S. each send around 7.8 billion spam emails daily, while India and Japan are close behind with 7.6 billion each.
- Many people unsubscribe from emails when they feel they are too spammy. Around 28% of unsubscribes happen for this reason.
- Most users deal with spam by just deleting it (40.8%), ignoring it (23.1%), or marking it as spam (19.9%).
- A smaller number open spam emails (7.9%), maybe out of curiosity.
- Only a few go further, 7.2% unsubscribe, and just 1% report spam to authorities.
 (Reference: imagekit.io)
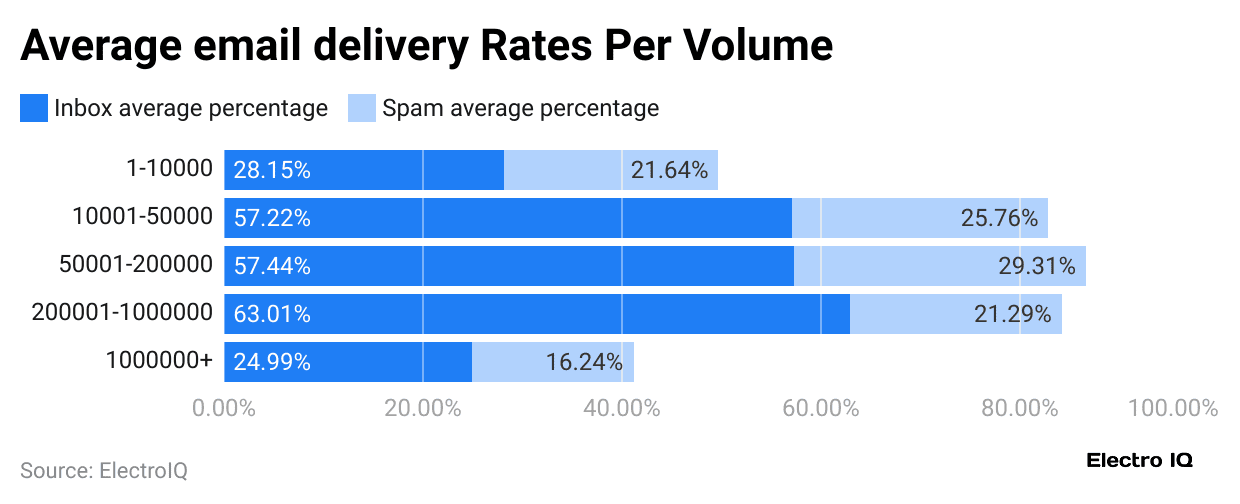
- Senders sending 1 to 10,000 emails/month face a 21.64% spam rate.
- Volumes of 10,001 to 50,000 emails/month see a higher spam rate of 25.76%.
- The rate peaks at 29.31% for 50,001 to 200,000 emails/month.
- For 200,001 to 1,000,000 emails/month, spam rates drop to 21.29%.
- Senders over 1,000,000 emails/month have the lowest spam rate at 16.24%.
Types of Email Spam Statistics
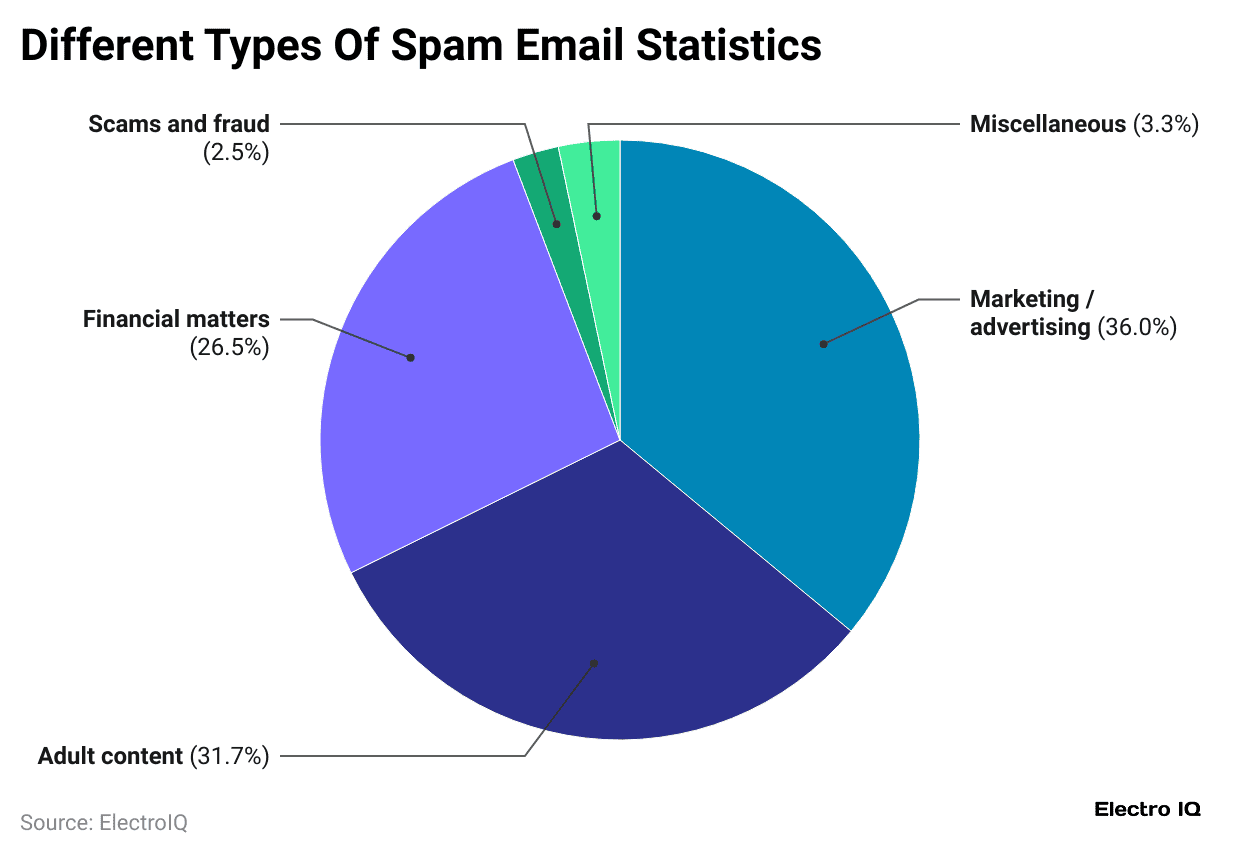
- As of 2025, most spam emails are about marketing or advertising, making up 36% of all spam.
- Messages with adult content follow closely, taking up 31.7%.
- Financial-related spam, such as fake investment offers or loan scams, accounts for 26.5%.
- Only 2.5% of spam emails are direct scams or frauds, while the remaining 3.3% fall into other mixed or random categories.
Daily Email Spam Statistics by Top 10 Countries 2025
| Country | Number of Spam Emails (Billions) |
| United States |
9.1 |
| China | 8.7 |
| Russia | 8.3 |
| Brazil | 8.1 |
| India | 8.0 |
| Germany | 7.9 |
| Czech Republic | 7.8 |
| Poland | 7.75 |
| Bulgaria | 7.7 |
| United Kingdom | 7.7 |
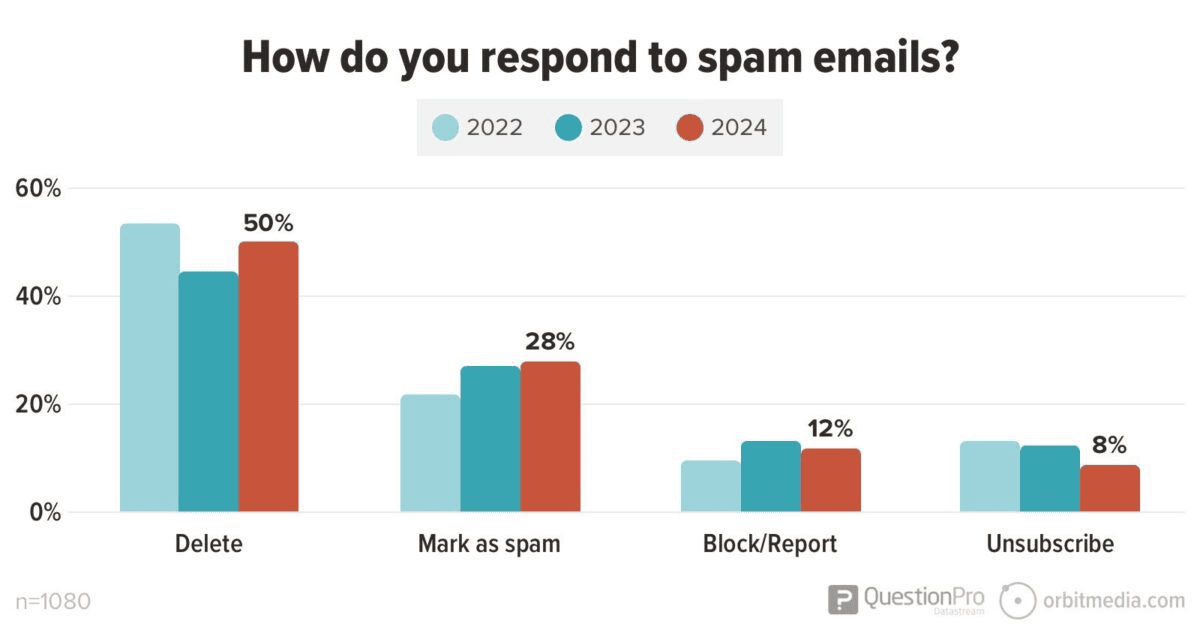
User Response Statistics to Email Spam
 (Source: orbitmedia.com)
- As of 2024, around 50% of users delete spam and phishing emails without opening them, treating them as junk.
- In contrast, 28% choose to mark suspicious emails as spam to filter similar messages in the future.
- Only 12% report or block senders, while only 8% click unsubscribe links.
Text Message Spam Statistics
- According to a report from SlickText, people in the U.S. got around 19.2 billion spam texts in February 2025.
- In 2024, about 21% of Americans said they lost money because of spam text messages.
- In December 2023, spam text messages increased sharply across the United States.
- California received the highest number, with around 2.5 billion spam texts that year.
- Texas came next with about 1.83 billion messages, followed by Florida, which got nearly 1.18 billion.
- New York was also heavily affected, receiving over 1.04 billion spam texts.
- Pennsylvania made it to the top five states, with a total of 719 million unwanted messages.
- Meanwhile, the top text scams included banking impersonation (10%), fake rewards (9%), delivery issues (9%), job scams (8%), and false Amazon security alerts (7%), tricking countless users.
- As mentioned in Go Beyond reports, in the U.S., only 36% of people understand what smishing is.
- Many victims have lost millions of dollars because of these scams.
- On average, each person in America gets around 41 spam text messages every month.
- As per Marketing Scoop’s 2024 report, people lost about USD 470 million to scams that started through text messages.
- By 2025, losses from SMS fraud are expected to rise sharply and reach around USD 101 billion.
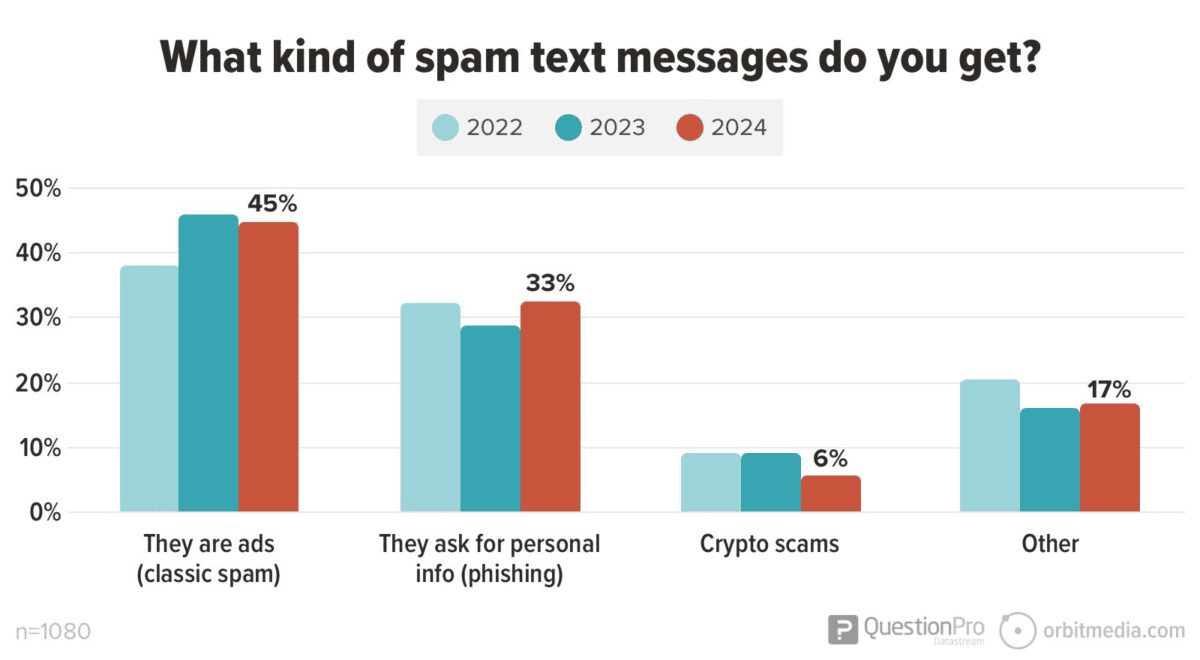
By Types
 (Source: orbitmedia.com)
- In 2024, 45% of spam text messages were advertisements, followed by phishing messages asking for personal info at 33%.
- Crypto scams made up only 6%, while 17% of users reported receiving other types of spam messages.
| Industry | Spam Message Share |
| Financial Institution | 27.7% |
| SaaS/Webmail | 17.7% |
| Social Media | 10.4% |
| Logistics/Shipping | 9% |
| Payment | 6% |
| E-commerce/Retail | 5.6% |
| Telecom | 3.1% |
| Cryptocurrency | 2.3% |
| Other | 18.2% |
By Frequency
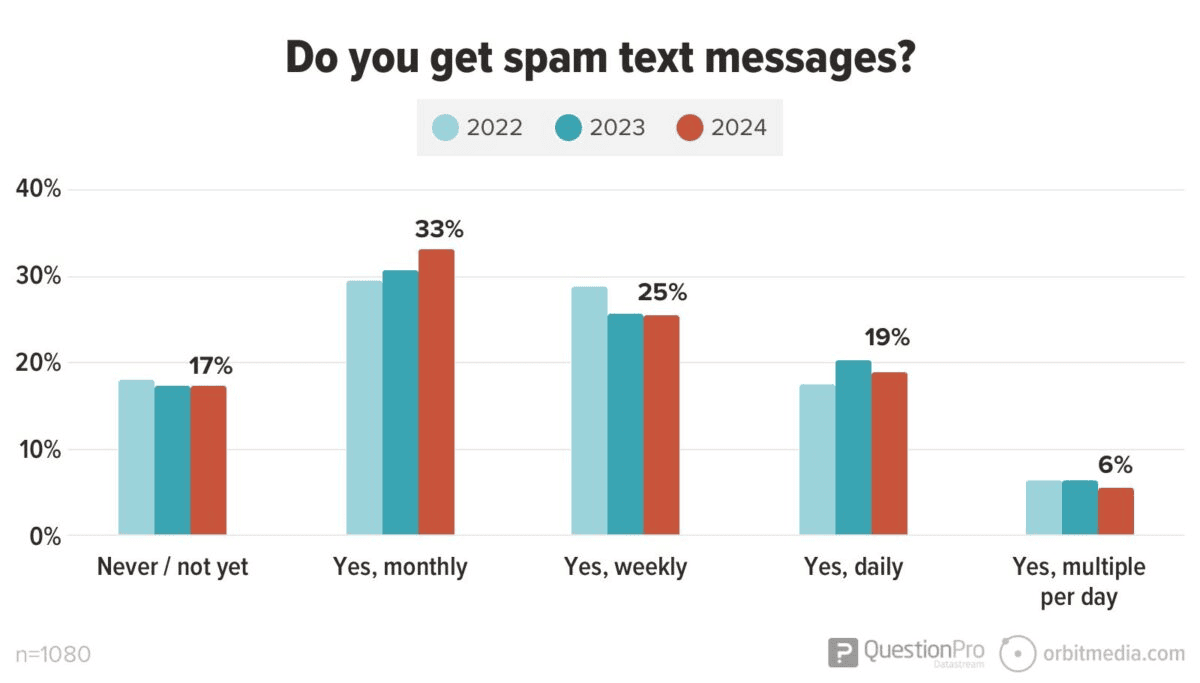
- In 2024, 33% of users reported that getting spam text messages was the highest frequency category, once every month.
- Around 25% get them weekly, while 19% reported receiving spam texts daily.
- Only 6% experience multiple spam messages per day, and 17% have never received any or have not yet.
Phone Call Spam Statistics
- In April 2025, people in the U.S. received nearly 5 billion robocalls, according to YouMail reports.
- That’s about 165 million calls every day, or 1,900 calls every second, with 15 calls per person each month.
- A report by PR Newswire said that in March 2025, Americans got around 4.8 billion robocalls, which is a 12.7% jump compared to March 2024.
- More than half of those calls, about 54%, were scams or telemarketing.
- By June 2025, there were 4.4 billion robocalls, and during the first six months of the year, the total hit 28.2 billion with a 10.6% increase from the same time in 2024.
- Hiya’s 2024 report showed that 28% of unknown calls were spam or fraud, and 16% of people fell for phone scams in 2023.
 (Source: emailtooltester.com)
- Around 56.2 million people lost a total of USD 25.4 billion to scam calls in one year, averaging a USD 452 loss per person.
- Truecaller says users get around nine spam calls a month.
- On average, Americans deal with 3.3 billion unwanted calls each month, and nearly 89% of these seem to come from within the U.S. itself.
 (Reference: truecaller.com)
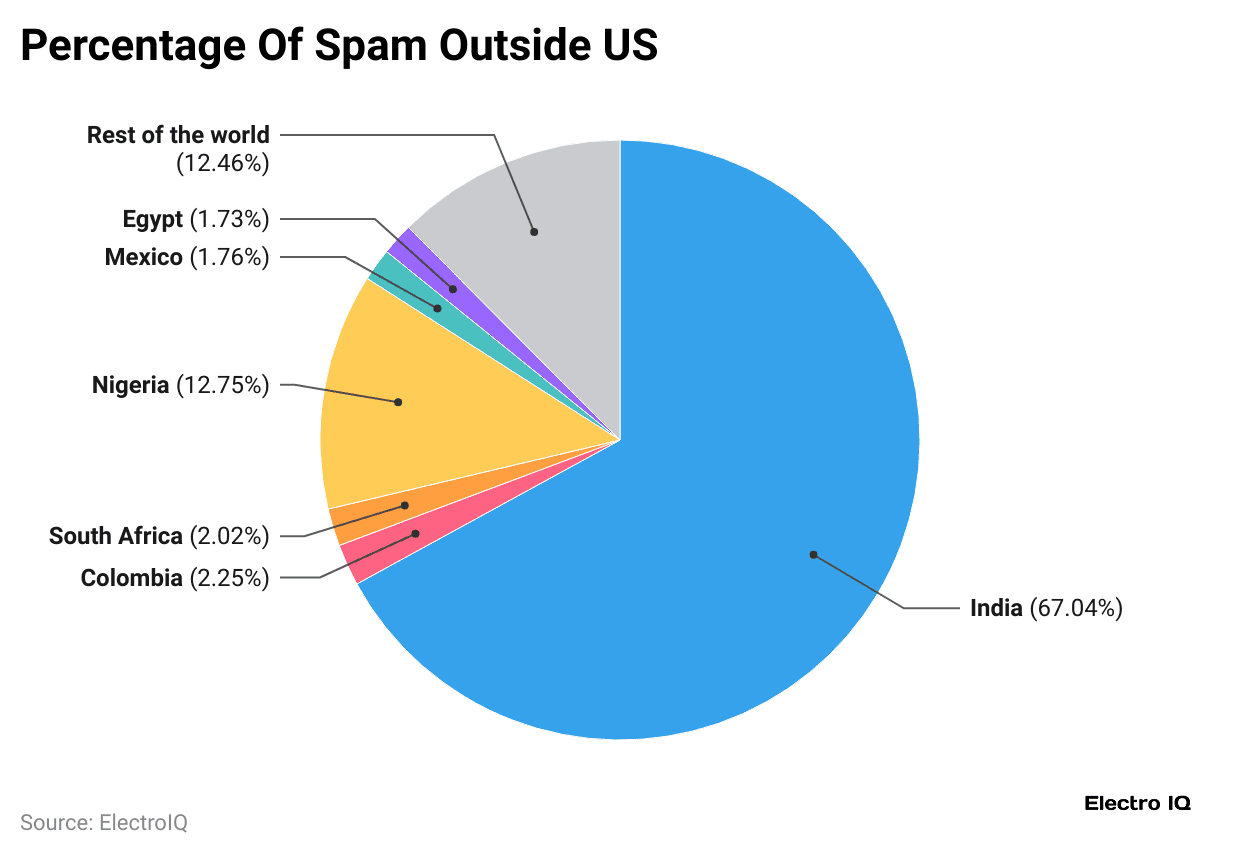
- In countries outside the U.S., India leads with 67.04% of global spam calls, followed by Nigeria at 12.75% and the rest of the world at 12.46%.
- Other contributors include Colombia (2.25%), South Africa (2.02%), Mexico (1.76%), and Egypt (1.73%).
Victims of Spam Calls Statistics by Demographics
| Age Group (Years) | Male | Female |
| 18 to 34 | 14.2% | 16.9% |
| 35 to 44 | 20.5% | 21.8% |
| 45 to 54 | 19.6% | 20% |
| 55 to 64 | 28.9% | 22.2% |
| 65+ | 35.5% | 35.4% |
- emailtooltester.com also shows that around 47% of Black Americans and 36% of Hispanic Americans have lost money to phone scams at least once.
- Only 25% of White Americans say they have experienced losing money in the same way.
Number of Spam Calls and Messages Statistics per Month in the U.S., 2025
| Countries | Spam calls | Spam messages |
| Washington | 29,747,337 | 4,150,157 |
| Oregon | 18,913,354 | 2,850,949 |
| California | 169,864,481 | 18,327,176 |
| Idaho | 8,729,899 | 1,799,155 |
| Nevada | 21,225,014 | 2,387,629 |
| Arizona | 40,660,370 | 4,878,047 |
| Montana | 5,885,793 | 507,693 |
| Wyoming | 3,428,978 | 560,787 |
| Utah | 18,497,962 | 2,634,229 |
| New Mexico | 11,903,907 | 1,289,590 |
| Colorado | 33,546,334 | 4,708207 |
| Texas | 332,457,441 | 21,132,930 |
| Oklahoma | 49,356,331 | 3,760,259 |
| Nebraska | 11,518,202 | 1,612,705 |
| Kaansan | 26,897,589 | 2,202,619 |
| South Dakota | 3,993,102 | 544,401 |
| North Dakota | 2,948,500 | 427,574 |
| Minnesota | 23,913,433 | 2,916,121 |
| Iowa | 22,914,560 | 1,770,642 |
| Missouri | 68,396,109 | 4,679,721 |
| Arkansas | 31,350,087 | 2,521,341 |
| Louisiana | 54,239,114 | 4,975,230 |
| Michigan | 66,333,104 | 6,256,368 |
| Wisconsin | 45,827,419 | 3,808,857 |
| Illinois | 78,224,802 | 5,287,332 |
| Tennessee | 94,556,247 | 5,696,084 |
| Mississippi | 55,628,470 | 3,543,701 |
| Indiana | 59,630,814 | 4,067,535 |
| Kentucky | 37,475,104 | 4,713,448 |
| Alabama | 73,332,539 | 6,241,469 |
| Florida | 199,057,376 | 14,591,623 |
| Georgia | 103,007,338 | 8,447,792 |
| North Carolina | 108,621,498 | 7,787,717 |
| South Carolina | 76,943,800 | 5,043,801 |
| Virginia | 52,664,159 | 4,198,527 |
| West Virginia | 16,894,658 | 1,416,576 |
| Ohio | 112,633,843 | 6,659,651 |
| Maryland | 35,936,477 | 2,385,733 |
| Pennsylvania | 82,807,787 | 7,301,026 |
| New Jersey | 43,455,469 | 2,645,658 |
| New York | 80,961,857 | 6,530,606 |
| Connecticut | 17,188,585 | 894,093 |
| Massachusetts | 22,507,954 | 2,649,868 |
| New Hampshire | 6,624,879 | 935,036 |
| Vermont | 1,757,465 | 295,355 |
| Maine | 9,083,362 | 1,222,928 |
Social Media Spam Statistics
- According to Wikipedia, more than 90% of social network users report experiencing spam such as fake links, promotional messages, or comment bots.
- About 40% of all social media accounts are estimated to be fake or bot‑driven, as mentioned on arxiv.org.
- The Sprinklr report also depicts that in Q4 2023, Meta (Facebook/Instagram) removed more than 2.6 billion fake accounts and 1.4 million spam items.
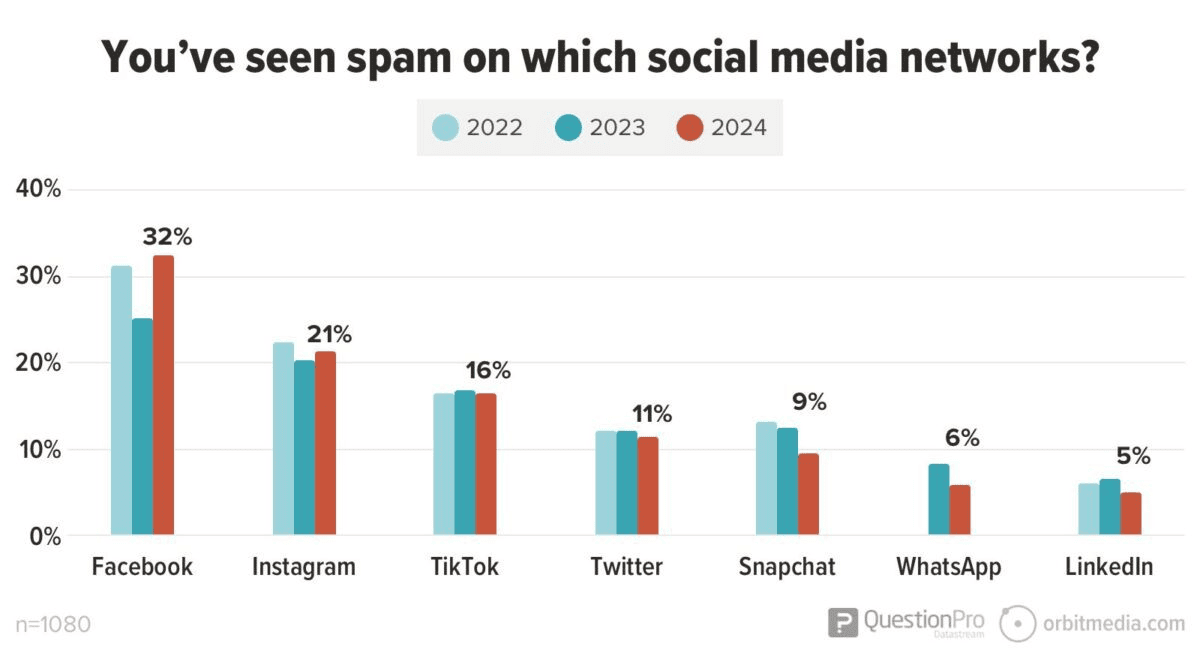
- VPN Alert also states that in 2024, Facebook had the highest spam report rate at 31%, followed by Instagram with 22%.
- TikTok (16%), Snapchat (13%), and Twitter (12%) also saw notable spam activity, while LinkedIn remained the lowest at just 6%.
- Around 35% of social media users saw spam comments every day, while 20% received spam messages daily.
- Meanwhile, 40% never got spam DMs, 21% reported getting them monthly, and 14% experienced spam messages weekly across platforms.
 (Source: orbitmedia.com)
- In 2024, 32% of users reported seeing spam on Facebook, making it the most affected platform.
- Instagram (21%) and TikTok (16%) followed, while Twitter (11%) and Snapchat (9%) showed moderate levels.
- WhatsApp (6%) and LinkedIn (5%) had the fewest spam reports, indicating they remain relatively less targeted by spammers compared to other networks.
Conclusion
To sum up, spam is still one of the biggest problems online today. It shows up in emails, text messages, and even on social media. Nearly half of all emails sent every day are spam, and many people receive these unwanted messages all the time. These messages can be annoying and unsafe. Spammers send fake ads, scams, or offers to trick people and steal their personal information.
This makes it tough to trust what you see online and can risk your privacy. To stay safe, always be careful, use spam filters, report strange messages, and follow simple internet safety rules. But fighting spam is not just about tools—it’s also about people being aware and working together to stay safe online.
Sources
FAQ.
Spam’s main purpose is to advertise, scam, or steal personal information through bulk messaging.
There are various ways to identify spam, such as unfamiliar senders, too-good-to-be-true offers, poor grammar, urgent or threatening language, and suspicious links or attachments.
No, it can’t be stopped permanently, but spam filters allow users to block most of them.
Yes, sending spam is illegal in many countries, like in the U.S., which has the CAN-SPAM Act, Canada enforces CASL, and the EU follows the ePrivacy Directive.
Clicking can lead to dangerous websites, installing malware, or tricking you into entering personal or payment details.

Barry Elad is a passionate technology and finance journalist who loves diving deep into various technology and finance topics. He gathers important statistics and facts to help others understand the tech and finance world better. With a keen interest in software, Barry writes about its benefits and how it can improve our daily lives. In his spare time, he enjoys experimenting with healthy recipes, practicing yoga, meditating, or taking nature walks with his child. Barry’s goal is to make complex tech and finance information easy and accessible for everyone.