Sports Betting Statistics By Market Size, Revenue, Players, And Growth

Updated · Jul 17, 2026


Table of Contents
- Introduction
- Editor’s Choice
- Sports Betting Market Size And Revenue Statistics
- Global Sports Betting Growth Statistics
- Online And Mobile Sports Betting Statistics
- Sports Betting Statistics By Region
- Most Popular Sports For Betting
- Sports Betting Statistics By Major Event
- Sports Betting Operator Statistics
- Sports Bettor Demographic Statistics
- Sports Betting Tax Revenue Statistics
- Sports Betting Advertising And Sponsorship Statistics
- Sports Betting Technology Statistics
- Responsible Gambling And Problem Betting Statistics
- Conclusion
Introduction
In the past, sports betting was strictly local and fragmented. However, modern sports betting has become a global gambling industry. Nowadays, it includes online sportsbooks, retail betting shops, mobile applications, betting exchanges, sports leagues, data providers, payment companies, and regulatory authorities.
It is obvious that this industry is complex and sophisticated, and it has become an integral part of sports entertainment. The biggest sports events are often sponsored and promoted by large betting companies, and it seems that this industry will keep growing.
This article will cover the latest and most relevant sports betting statistics. You’ll be able to read stats on the global sports betting market size, betting revenue, wagering volume, online and mobile adoption, regional markets, popular sports, major betting events, bettor demographics, operator statistics, and industry growth forecasts.
Editor’s Choice
- Global valuation: approximately US$111–114 billion in 2025. However, these estimates may differ depending on the source. Some reports measure operator revenue, others measure gross gaming revenue, total market activity, etc.
- Short-term projections: The market value might reach US$123–127 billion in 2026.
- Long-term projections: Some forecasts expect the global sports betting market to exceed US$230 billion by 2033.
- According to one market estimate, online sports betting generated approximately US$78.9 billion in revenue in 2024.
- Europe is the biggest betting market (approximately 48% of the global sports betting market revenue in 2025). The Asia-Pacific market is the fastest-growing, with a projected compound annual growth rate of 12.3% from 2025 to 2030.
- Regulated US sportsbooks accepted approximately US$166.94 billion in wagers in 2025, a 11% increase over 2024.
- US sports betting revenue reached approximately US$16.96 billion in 2025, up 22.8% from 2024.
- US state-regulated sportsbooks generated approximately US$3.71 billion in taxes during 2025, a 32.4% increase year over year.
- Due to a rapid smartphone adoption, mobile and online sports betting accounts for 72% of the global sports betting market share.
- Football is generally the largest sport by global betting volume, with estimates ranging from 40% to 70% market share, depending on the source and region.
- Major events such as the FIFA World Cup, Super Bowl, UEFA Champions League, March Madness, and Grand National generate major increases in betting activity, but the exact numbers vary depending on the sport, sources, and other factors.
- Live or in-play betting represents a growing share of online sportsbook activity. According to Mordor Intelligence, live or in-play betting accounted for 62.35% of the betting market share
Sports Betting Market Size And Revenue Statistics
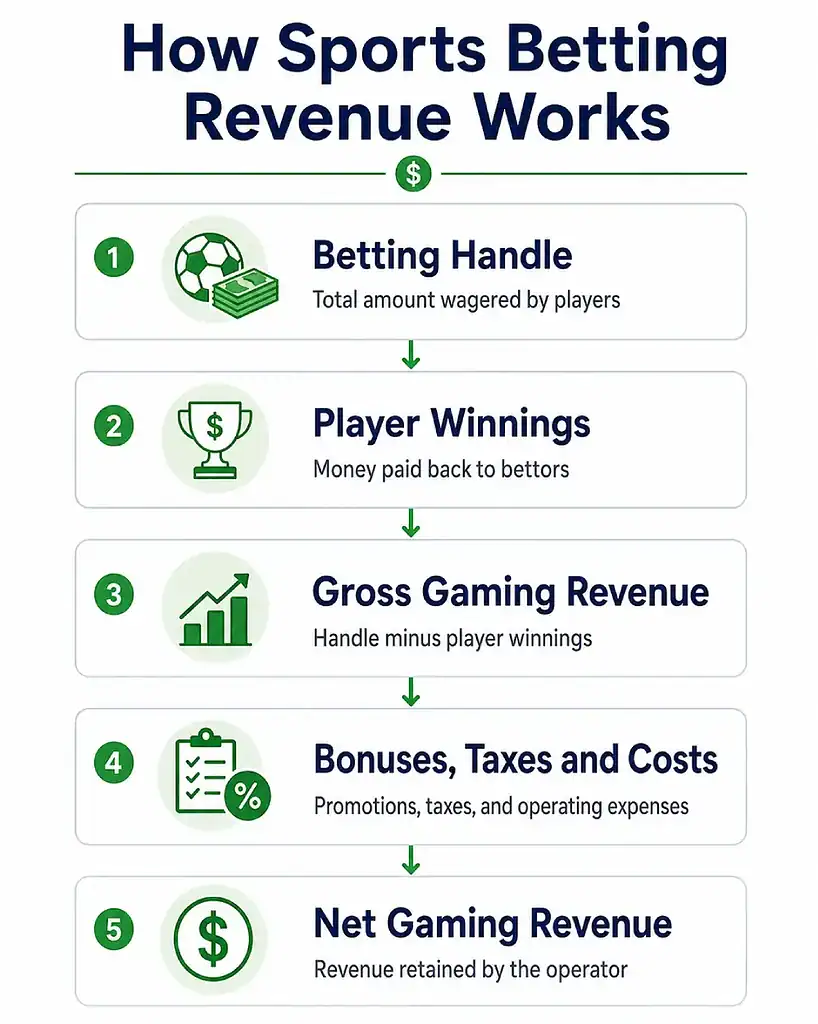
To get a better picture of how big the sports betting industry is at the moment, and how sportsbook operators generate revenue, you’ll need to take a look at certain stats. However, to understand those stats properly, you need to clearly distinguish between:
- Betting handle: the total amount wagered
- Hold: how much the betting companies have won
- Gross gaming revenue: stakes minus winnings paid to players
- Net gaming revenue: revenue remaining after certain deductions, bonuses, or taxes
- Market size: it’s calculated differently depending on the source
Now, let’s take a look at the stats:
- Global sports betting market value: approximately US$111–114 billion in 2025, depending on the source.
- Historical market growth: In the US alone, the sports betting market has grown from US$4.34 billion in 2021 to US$16.96 billion in 2025, which is a 290.78% increase.
- Forecast market value: Long-term projections estimate that the market value will exceed US$230 billion by 2033.
- Compound annual growth rate: According to Grand View Research, the projected CAGR for 2026-2033 is 9.7%.
- Gross gaming revenue: In the US, the sports betting industry has reached $78.72 billion in gross gaming revenue, which is a 9.2% increase compared to 2024.
- Betting handle vs sportsbook revenue: On US$166.94 billion betting handle in 2025, sportsbooks have made US$16.96 billion in revenue.
- Online versus retail betting market share: Online platforms and apps dominate the market with 71% share and the fastest CAGR of nearly 13.0% from 2026 to 2033.
- Operator margins or hold percentage: The overall hold for major operators ranges from 9.1% to 11.1%.
- In 2025, US state-regulated sportsbooks generated approximately US$3.71 billion in taxes.
- Advertising and sponsorship expenditure: In Great Britain, over US$1.5 billion was spent on gambling/sports betting advertising during 2025. US$185 million was spent on sponsorships.
- Data licensing and technology revenue: Given that live or in-play betting now accounts for over 60% of the market share, real-time data and official data feeds are in demand.
- Sports betting within the gambling industry: According to EGBA, sports betting accounts for 46% of total online gross gaming revenue, while online casino games account for 48%.
Global Sports Betting Growth Statistics
The sports betting market has been growing steadily over the years, and here are the reasons behind that growth:
- Sports betting has been legalized in new jurisdictions, making it more accessible and lucrative for many users. The countries have also increased their tax revenue by lifting sports betting bans.
- As a result, there are more regulated online sportsbooks that offer safe and secure playing environments. This attracts even more players every year.
- The growth of smartphone ownership has also boosted sports betting market growth. More smartphone users also means more people with access to online and mobile sports betting.
- Mobile betting applications and their development have made sports betting even more accessible and seamless, ensuring a smooth user experience that makes users come back.
- Faster digital payment methods have significantly reduced friction in sports betting. Users can now pay via direct bank transfers, e-wallets, and crypto, with payments processed in just a few seconds.
- Live and in-play betting has also popularized sports betting, as it allows bettors to place bets even after the game has started. Many bettors like to place bets based on real-time data.
- Same-game parlays and bet-builder products allow bettors to combine multiple different outcome predictions for the same games and matches. This has made sports betting even more flexible and appealing.
- Sports streaming integration shows live broadcasts of games inside the betting apps, which makes the whole betting experience more engaging.
- Data analytics and personalized betting markets analyze individual bettor preferences and offer tailored wagers, and this attracts even more loyal bettors.
- Increased sponsorship among sportsbooks, leagues, teams, and media companies has made more people familiar with sports betting and normalized it as a regular form of entertainment.
- Expansion in Latin America, Africa, Asia, and North America has opened up new markets and introduced new audiences to the world of sports betting.
According to projections from Grand View Research, the sports betting market could reach US$236 billion by 2033. Fortune Business Insights is even more optimistic, claiming that the sports betting market will reach US$295 billion by 2034.
Some sources forecast a compound annual growth rate of 9–12%. Despite differences in estimates and predictions, all sources agree that sports betting is a promising market with so much growth potential.
Online And Mobile Sports Betting Statistics
Sports betting has gone through a massive transformation when it went from retail betting shops and physical sportsbooks to online and mobile platforms. While the retail betting shops and physical sportsbooks still exist and make a decent revenue, online sports betting platforms have taken over the majority of the market.
| Mobile Betting | Desktop Betting |
|---|---|
| Around 80% of online wagers | Smaller share of wagers |
| 5.2 sessions per day | 1.3 sessions per day |
| 74% of live betting | Often used for research |
| Fast and convenient | Longer average sessions |
| Apps and notifications | Larger screen |
Here are some notable online and mobile sports betting statistics:
- According to the Grand View Research estimates, online sports betting generated $78.9 billion in revenue in 2024.
- Mobile share of sportsbook wagers shows how popular mobile sports betting is, as it accounts for 80% of all online wagers.
- Desktop platforms for sports betting are useful for pre-game research, which is why bettors spend significantly more time on these platforms (775 seconds on average) than in mobile apps, even though mobile apps account for the vast majority of all online wagers.
- Mobile application adoption: given how many bettors are also smartphone users, it is no wonder that they want native apps that are compatible with iOS and Android devices.
- Mobile web betting accounts for 18-20% digital market share, and it is particularly popular among bettors who want to place bets online without downloading apps.
- Frequency of mobile betting sessions: mobile users visit these apps 5.2 times per day on average, while desktop users have 1.3 daily sessions on average, which clearly shows the convenience and appeal of mobile apps.
- Approximately 92% of all US mobile sports betting transactions rely on services such as Apple Pay. The number of digital deposits and withdrawals is growing thanks to the popularity of mobile sports betting.
- 74% of all live betting comes from mobile devices, which shows how much the bettors value flexibility and the ability to place their bets on the go, even after the game has started
- Push notifications and personalized promotions can also make a great difference. Push notifications cause an 800% increase in the daily app retention rate, and users who opt in to these notifications have 171% higher app engagement.
- Geolocation technology in regulated markets ensures that users stay within legal boundaries when betting.
- Given that the vast majority of traffic and revenue comes from mobile users, sportsbookers design their UI to be mobile-friendly first.
Sports Betting Statistics By Region
Sports betting markets depend on major geographic regions. There are differences in regulation, sports preferences, payment systems, betting culture, and mobile adoption between these regions and markets.
Europe was the first region to regulate sports betting, which is why it’s now a mature, regulated market. On the other hand, the United States, Brazil, parts of Africa, and other newly regulated jurisdictions may show faster percentage growth.
- Europe represented approximately 48% of the global sports betting market in 2025, according to Grand View Research. It is valued at US$39.9 billion. The highest share of European revenue comes from the UK – 34.6%
- North America has a massive market share of 34%. Both Canada and the US are experiencing rapid growth, fueled by state-by-state legalization after the 2018 PASPA overturn.
- Asia-Pacific has the highest growth rate, thanks to digitalization and mobile adoption. However, this region shouldn’t be treated as one uniform betting market, as there are huge differences between countries:
- China has a large consumer base, but the regulations are tight.
- Australia and New Zealand are already mature markets with regulations aimed at protecting consumers.
- Japan holds 22% of the Asian market share due to extreme digitalization, as well as the interest in horse racing and esports.
- India has a huge growth potential due to its population size, digitalization, and interest in sports such as cricket.
- Singapore and Hong Kong have regulations that protect the consumers, but also allow the betting companies to provide well-organized betting services.
- The Latin American market is in its growth stage, with Brazil, Peru, and Colombia as leaders. Brazil is the largest regulated market, with US$7.0 billion in revenue in 2025.
- Sports betting in the Middle East and North Africa is becoming increasingly popular, especially in the UAE, Morocco, and Tunisia. The UAE is working on creating the regulatory framework for commercial betting, while Morocco and Tunisia rely on land-based casinos, and online sports betting is still unregulated.
- Democratization of mobile technologies has led to the expansion of online sports betting in Sub-Saharan Africa, especially in Nigeria, Kenya, and South Africa.
| Region | Main characteristic |
|---|---|
| Europe | Largest and most mature market |
| North America | Rapid growth after legalization |
| Asia-Pacific | Fastest-growing region |
| Latin America | Expansion led by Brazil |
| Africa | Growth driven by mobile betting |
| Middle East and North Africa | Uneven regulation |
Most Popular Sports For Betting
The most popular sports for betting are usually sports with the largest fan bases. For example, football is generally considered the largest global sports betting category, but exact market-share estimates differ between operators, jurisdictions, and research providers. Here are some useful stats:
-
- Football dominates the sports betting world with a 35-42% of global betting volume. It is particularly popular in Europe, Latin America, and Africa. FIFA World Cup, UEFA Champions League, and many other globally popular football competitions prompt millions to place their bets.
- American football is almost exclusively popular in North America, which is why the majority of bettors on this sport come from there. This sport accounts for approximately 30-35% of the US betting handle.
- Basketball accounts for 19% of global betting volume, which is solid proof of this sport’s popularity. The biggest basketball competition is definitely the NBA, followed by the EuroLeague and NCAA March Madness. Live betting accounts for 64% of basketball’s total handle.
- Horse racing accounts for 4-8% of global betting volume, and according to some sources, is valued at US$115 million annually.
- Tennis accounts for 7% of global betting volume, with Europe and Australia being the biggest markets.
- Baseball holds approximately 11% of the global betting market, with North America accounting for 70% transactions.
- Cricket accounts for around 9% of the global betting market, with its volume being heavily concentrated in the Asia-Pacific, the UK, and South Africa.
- Ice hockey accounts for 2-4% of global volume.
- Esports: 2-5% global volume.
- Combat sports: 2% global volume.
-
- Golf: 2% global volume.
- Rugby: 1-2% global volume.
Sports Betting Statistics By Major Event
Major sports events create short-term spikes in betting volume, customer acquisition, promotions, and sportsbook revenue. During these events, even the people who aren’t big sports fans want to tune in and maybe even make a bet.
Here are the events with the biggest impact on sports betting stats:
- FIFA World Cup: Global wagers for the 2026 World Cup will exceed US$50 billion, with millions of bettors placing their bets. Mobile betting is estimated to account for 90% of total betting volume.
- UEFA European Championship: Even though they are concentrated in Europe, wagers for UEFA Championships often reach US$50-70 billion annually. Approximately 88% of the handle is made online.
- Super Bowl: The legally wagered amounts in the US might reach US$1.71 billion in 2026, in comparison to US$1.5 billion in 2025.
- March Madness: US$3.3 billion in wagers for 2026 with approximately 70 million bettors. Mobile betting accounts for around 92% of the legal handle.
- Olympic Games: They generate US$2-3 billion in wagering revenue globally, with millions of fans watching, some of them betting. More than 85% of betting volume comes from online sources.
- UEFA Champions League Final: This single match reaches a global wagered amount of US$300-500 million. Most bettors come from Europe, Latin America, and Asia, and more than 90% wagers are placed online.
- Grand National has the biggest wagers of all horse races in the world, with wagered amounts often exceeding US$300 million. This even attracts over 13 million UK bettors, and more than 60% bets come from online betting.
- Kentucky Derby generates US$89 million handle, and US$200+ million on Derby Day. Online advance-deposit wagering accounts for approximately 65-75% or wager volume.
- Wimbledon: over the two-week tournament, a wagered amount reaches US$1.5-2 billion, with millions of fans and bettors worldwide, and 90% of Wimbledon’s handle comes from mobile betting.
- NBA Finals: Wagered amounts reach $200-350 million in a 4-to-7 game series, and 94% wagers come from mobile apps.
| Event | Estimated betting activity | Online/mobile share |
|---|---|---|
| FIFA World Cup 2026 | More than US$50B | Around 90% mobile |
| UEFA European Championship | US$50–70B | Around 88% online |
| Super Bowl 2026 | US$1.71B | — |
| March Madness 2026 | US$3.3B | Around 92% mobile |
| Wimbledon | US$1.5–2B | Around 90% mobile |
| Champions League Final | US$300–500M | More than 90% online |
| Grand National | More than US$300M | More than 60% online |
Sports Betting Operator Statistics
The global betting market is dominated by several industry giants. Here is what you should know about these companies:
- Flutter Entertainment:
-
-
- Annual betting revenue was US$16.38 billion in 2025.
- Number of customers: Flutter has over 40 million worldwide users.
- Active monthly players: 15.9 million monthly users
- Market share: 9.2%
- Main geographic markets: US, UK, Ireland, Australia, and Italy
- Sportsbook brands: FanDuel, Sky Betting & Gaming, Paddy Power, Sportsbet, PokerStars, Betfair, etc.
- Online versus retail operations: online 88%, retail 12%
- Revenue growth: 17.4% year-over-year increase
- Major acquisitions or partnerships: Flutter has acquired a 100% ownership of FanDuel.
-
- Bet365
-
-
- Annual betting revenue: US$5.4 billion in 2025
- Number of customers: over 120 million users worldwide
- Active monthly players: 38-47 million monthly visits
- Market share: 4.4%
- Main geographic markets: UK and Europe
- Sportsbook brands: bet365 Sportsbook, bet365 Casino, bet365 Live Casino, bet365 Poker, and bet365 Bingo
- Online versus retail operations: almost 100% online
- Revenue growth: 9% year-over-year increase
- Major acquisitions or partnerships: Bet365 is named the Official Sports Betting Partner of the UFC in the US and Canada
-
- DraftKings
-
-
- Annual betting revenue: $6.05 billion in 2025
- Number of customers: over 10 million in total registered users
- Active monthly players: 4.8 million of monthly unique payers
- Market share: 1.1%
- Main geographic markets: The US states such as New York, Illinois, and New Jersey
- Sportsbook brands: DraftKings Sportsbook & Casino, Golden Nugget Online Gaming, and DraftKings Pick6
- Online versus retail operations: online 98%, retail 2%
- Revenue growth: 16.8% year-over-year increase
- Major acquisitions or partnerships: The reverse merger with SBTech, the purchase of Golden Nugget Online Gaming, the long-term deals with ESPN and NBCUniversal
-
- FanDuel
-
-
- Annual betting revenue: FanDuel has made $5.79 billion in 2024
- Number of customers: over 12 million registered users
- Active monthly players: 3.5-4.8 million monthly active players
- Market share: 5-8%
- Main geographic markets: the US and Canada
- Sportsbook brands: FanDuel Sportsbook, FanDuel Casino, and FanDuel Racing
- Online versus retail operations: 95-98% online, the rest is retail.
- Revenue growth: 6% year-over-year
- Major acquisitions or partnerships: Acquiring BeyondPlay
-
- Entain
-
- Annual betting revenue: $7.08 Billion in 2025
- Number of customers: 23 million
- Active monthly players: 975,000 monthly active users
- Market share: 3.1%
- Main geographic markets: UK, Ireland, Italy, Central and Eastern Europe
- Sportsbook brands: bwin, Coral, Ladbrokes, PartyPoker, and Sportingbet
- Online versus retail operations: 70% online, 30% retail
- Revenue growth: Entain has achieved a 3% year-over-year increase
- Major acquisitions or partnerships: The creation of Entain CEE and the buyouts of Angstrom Sports and SuperSport
Sports Bettor Demographic Statistics
If you wonder who participates in sports betting and how demographics vary by country, take a look at these stats:
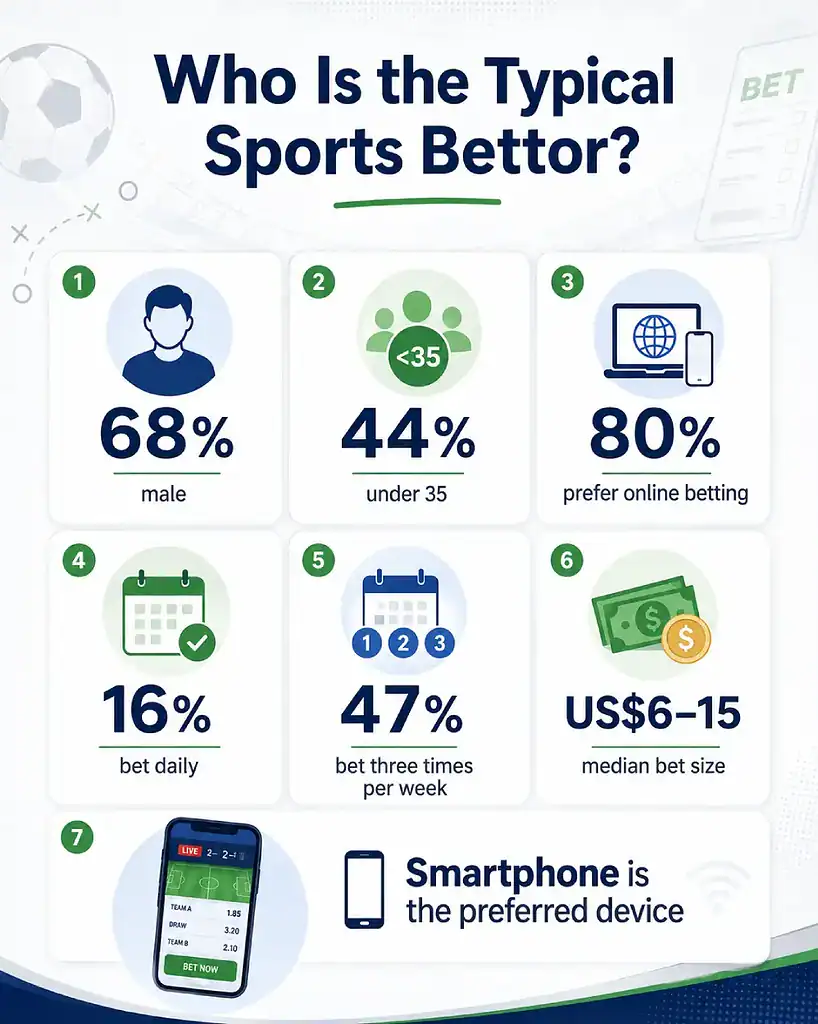
- Age: 44% bettors are younger than 35, and the 18-34 age group keeps growing
- Gender: Bettors are predominantly male, making 68% of the market
- Income: Bettors making $50,000-99,000 make the most frequent bets, 48% of them making at least one bet per week
- Education: According to an American Gaming Association study, sports bettors are highly educated
- Employment status: Most are full-time employed or full-time students
- Frequency of betting: 16% bet daily, 47% bet three times per week
- Preferred devices: Smartphones are preferred devices across all ages, genders, and incomes
- Preferred sports: Football, American football, basketball, etc.
- Average bet size: The average bet size is US$250-450 per wager, but the median is much lower, US$6-15
- Online versus retail preference: Approximately 80% bettors prefer online over retail betting
- Casual versus frequent bettors: Casual bettors make 85-95%
Sports Betting Tax Revenue Statistics
For a long time, many governments prohibited or limited sports betting. However, after they realized the tax revenue from sportsbooks could boost public budgets, those governments changed their stance:
- Tax on gross gaming revenue
-
-
- United States: Ranging from only 6.75% in Nevada to 51% in New York, New Hampshire, and Rhode Island
- United Kingdom: 15%
- Italy: 20.5% for retail betting, 24.5% for virtual betting
- France: 59.3% of GGR
- Germany: 5.3% tax on all sports betting stakes
- Netherlands: 30.5% flat tax on GGR
- Australia: 15-25% of net wagering revenue, depending on the state
-
- Licensing fees
-
-
- United States: $1,200 annually (Nevada) to $25 million upfront (New York)
- United Kingdom: US$10,000 to US$1 million
- Italy: Year 1 costs are approximately US$9 million
-
- France: Approximately US$20-30 million per year
-
-
- Germany: Initial fee of US$212,108.05 + 5.3% tax on player stakes
- Netherlands: An application fee is approximately US$50,000
- Australia: Annual free of US$13,609.58
-
- State or national tax income
-
-
- United States: US$3.71 billion in state taxes during 2025, according to the American Gaming Association.
- United Kingdom: US$1.5 billion
- Italy: US$516 million
- France: US$1.26 billion
- Germany: US$630 million
- Netherlands: US$1.03 billion
- Australia: US$1.12 billion
-
- Funding for responsible gambling
-
- United States: a percentage of tax revenue, additionally, a $3,78 million of responsible gaming grants was awarded in 2025
- The United Kingdom has a mandatory statutory levy of US$135 million annually.
- Italy: US$50 million to prevent and treat gambling addiction
- France: dedicated amounts determined by the ANJ (National Gaming Authority)
- Germany: budget allocations are managed by GGL (the Joint Gambling Authority of the States)
- The Netherlands has various grants and project funding to promote responsible gambling.
- Australia: state governments require betting operators to contribute a percentage of their revenue
Sports Betting Advertising And Sponsorship Statistics
There is an important commercial relationship between sportsbooks, sports teams, leagues, broadcasters, media companies, and athletes. Through this relationship, sports fans are converted into bettors. On the other hand, sports teams, media companies, and athletes get the necessary funding. It’s a win-win for everyone involved.
- Sportsbook advertising spending: In Great Britain, more than US$1.5 billion was spent advertising during 2025, with an additional US$185 million spent on sponsorships. In the US, gambling operators spend roughly US$3.9 billion on marketing annually.
- Shirt and jersey sponsorships: During the 2024/2025 Premier League, 11 out of 20 clubs had gambling shirt sponsors.
- Stadium naming or branding: sportsbooks and casinos are usually interested in mid-tier and collegiate-level stadiums.
- When it comes to the top divisions in the EU and the UK, 4 of the 31 leagues have a betting company as their title sponsor.
- During the opening weekend of the Premier League, almost 30,000 gambling adverts were broadcast to the audiences in stadiums, and via TV, radio, and social media.
- In 2023, affiliate programs paid out US$2.1 billion globally, mostly to influencers who did the promotions.
- Also in 2023, 17% viewers made their deposits after seeing the free-bet promotions.
- Restrictions on gambling advertising: In 2019, the UK introduced a “whistle-to-whistle” ban on the frequency of gambling/sports betting advertising during live football broadcasts. This led to 2.9 gambling ads per game, compared to 5.8 gambling ads per game in 2018.
- The Alcohol and Gaming Commission of Ontario (AGCO) prohibits active/retired athletes, celebrities, and influencers from participating in gambling/betting ads. The only exception is when these ads promote responsible gambling.
Sports Betting Technology Statistics
Technology advancements have enabled the evolution of the modern betting industry. Here are some stats that prove it:
- Mobile applications: According to Mordor Intelligence, mobile sports betting will keep expanding by 2031 at 13.75% CAGR.
- Geolocation: In 2022, AI location-tracking tools blocked 41% bets coming from georestricted users, compared to manual checks, which caught 22% of bets coming from georestricted users.
- Artificial intelligence: The same year, 78% of the top 50 betting operators used AI and ML models to detect unusual user behavior and betting patterns.
- A 2023 McKinsey study shows that betting companies that use personalized odds and promotions have a 10-30% bigger revenue.
- Among crypto gamblers and bettors, 60% choose Bitcoin, and 27% choose Ethereum.
Responsible Gambling And Problem Betting Statistics
Sports betting is a form of gambling, which means it isn’t immune to gambling-related harm. Here are some stats on sports betting problems:
- Sports betting addiction is a massive problem, and approximately 4.2 million Americans struggle with it.
- According to the World Health Organization, approximately 5.5% of women and 11.9% of men globally are harmed by gambling in one way or another.
- Young bettors (Millennials and Gen Z) place 87% of all esports wagers, which shows that this betting market has the potential to attract more young and vulnerable bettors.
- Live betting accounts for 50-80% of global betting volume, which further fuels the gambling addiction and enables addicts.
- A study shows that 46% of study subjects (aged 25-34) used credit or borrowed money for gambling.
- Among those who have voluntarily self-excluded themselves from gambling, 49% have breached their self-exclusion and gambled anyway.
Conclusion
The sports betting industry has gone a long way, from local and fragmented operations to a powerful global industry. Sports betting has become an integral part of enjoying sports, and this won’t change any time soon. While the exact numbers may vary between sources, all agree on one thing: the sports betting industry will keep growing.
Online and mobile sports betting is particularly appealing because it offers convenience and flexibility for bettors. That’s why it’s already dominating the traditional retail betting.
While some regions, such as Europe, have already adopted and regulated sports betting, other regions and markets (Latin America, Africa, etc.) are still growing. All these markets will need to find a way to ensure responsible gaming and protect bettors.
Explore Related Gambling Guides
Sports betting is only one part of the wider online gambling market. The guides below explain how crypto payments are used across casino platforms and how different digital currencies affect deposits, withdrawals, fees, and transaction speed.
Sources
FAQ.
Sports betting is still the most popular in Europe, and Europe accounted for 48% of the global sports betting market revenue in 2025. However, other regions and markets are growing at a rapid pace, and some of them might overtake Europe’s leading position.
Football is the most popular sport when it comes to sports betting, and it accounts for 35-42% of global betting volume. Other popular sports are American football, basketball, baseball, tennis, cricket, etc. Esports betting is also becoming increasingly popular as more people discover it.
With traditional betting, you can only place your bets before the game starts. However, with live betting, you can place bets even after the game has started. This allows you to base your bets on the real-time data, which could make your bets more accurate.
Yes, sports betting can be addictive. Sports betting is a form of gambling, and millions of people struggle with gambling addiction globally. To avoid getting addicted while still enjoying sports betting, try to educate yourself on responsible gambling.
Sports betting can be addictive since it’s a form of gambling. Millions of people worldwide struggle with gambling addiction. To avoid getting addicted, try to gamble responsibly, and don’t bet more than you can lose.

Željka Stanić is a writer with more than five years of experience specializing in finance, statistics, and general business topics. She writes helpful and engaging articles that make the complex economic concepts easier to understand. Through her writing, Željka uses a structured and readable approach to ensure that high-level statistics are interesting and compelling to read.