Grubhub Statistics By Revenue, User And Facts (2025)
Updated · May 13, 2026


Table of Contents
Introduction
Grubhub Statistics: Grubhub has established itself as a competitor in the U.S. online food delivery industry. Over the years, Grubhub has linked diners to local restaurants to deliver meals seamlessly across the continental United States. However, it was in 2024 that it experienced significant changes in market share, user engagement, and corporate ownership.
This article discusses the Grubhub statistics that define Grubhub by analyzing some metrics and trends that powered its journey during the period.
Editor’s Choice
- According to Grubhub’s statistics, the company’s revenue fell from US$2,482 million in 2022 to US$2,105 million in 2023, marking a downturn after years of growth.
- Gross transaction volume fell from US$10.1 billion in 2022 to US$9.4 billion in 2023- also reflective of less spending on the platform.
- Grubhub’s user base dropped from 33.8 million in 2021 to 24.6 million in 2023 due to some competition and changing customer behavior.
- Parent company Just Eat Takeaway.com reported a 2% decline in 2024 in total Gross Transaction Value (GTV), reaching €26.3 billion.
- The revenue of the financial year is down by 1% to €5,085 million because of lower order volumes realised in North America, Southern Europe, and Australia.
- Grubhub statistics show that adjusted EBITDA jumped from €339 million in 2023 to €460 million in 2024 due to operational efficiencies.
- Free cash flow before working capital changes increased to €104 million in 2024, compared with a negative €52 million in 2023.
- Grubhub sold itself to Wonder for an enterprise value of US$650 million; the deal concluded in January 2025.
- Courier costs decreased by 1% at €1,596 million in 2024, mostly due to efficiency improvements, but higher wages are an increasing cost factor in some areas.
- Order-processing costs dropped 9% from €251 million in 2023 to €228 million in 2024 due to reduced volume of orders and greater efficiencies realized.
- Marketing costs dropped 7% to €388 million in 2024, mainly due to better spending efficiency.
- Impairment losses in total amounted to €354 million in 2024; this includes €98 million related to goodwill and €253 million related to other intangible assets.
- Grubhub statistics state that in 2024, the net income tax benefit was reported at €42 million, slightly lower than €47 million in 2023.
- Grubhub’s losses in operations amounted to €1,155 million for the financial year 2024, mainly due to the revaluation of assets under the IFRS 5 standards.
- Noncurrent assets stand at €5,524 million as of 2024, mainly due to impairment losses and asset reclassification.
- Current assets, other than cash, dropped to €335 million, mainly as a result of reclassifying Grubhub’s assets as held for sale.
- Grubhub statistics reveal that cash and cash equivalents decreased from €1,724 million in 2023 to €1,177 million in 2024 as a result of repayments to debt and the buyback of shares.
- It was primarily due to accumulated losses and treasury share repurchases that the equity of shareholders decreased to 4,452 million in 2024.
Grubhub Revenue
| Year |
Revenue ($mm)
|
| 2010 | 8.5 |
| 2011 | 30 |
| 2012 | 60 |
| 2013 | 170 |
| 2014 | 253 |
| 2015 | 361 |
| 2016 | 493 |
| 2017 | 683 |
| 2018 | 1007 |
| 2019 | 1312 |
| 2020 | 2026 |
| 2021 | 2362 |
| 2022 | 2482 |
| 2023 | 2105 |
(Source: businessofapps.com)
- Grubhub reported revenues of US$2,105 million in 2023, which is a decrease from US$2,482 million last year. This was a marked change from years of steady increases for the company.
- The peak revenue for the company was in 2022 at US$2,482 million, compared with US$2,362 million in 2021 and US$2,026 million in 2020.
- The turning point, clearly shown in all the years before, was 2020, when sales jumped from US$1,312 million in 2019 to above US$2 billion, as many more consumers became interested in making use of food delivery services.
- Before that time, Grubhub was showing quite steady growth, from US$1.007 billion in 2018 to US$683 million in 2017, US$493 million in 2016, and then a billion dollars crossed in 2018 as it became evident that human appetite for on-demand food was increasing.
- The increase in revenue was because the company was expanding its restaurant count and market reach. Those actually go quite earlier, back when Grubhub grossed a revenue of US$361 million in 2015, having made US$253 million in 2014.
- By 2013, the company started making fast strides as it raised revenues to US$170 million, comparatively high from only US$60 million in 2012. This was the period of aggressive acquisition and improvement of technological aspects.
- The revenue figures were at US$30 million in 2011, coming after US$8.5 million in the previous year as the company put in efforts to grow its customer base while trying to establish itself in the food delivery market. In the course of time, Grubhub changed from what was initially a small startup into an industry giant, but indications are that serious challenges in revenue growth have begun coming in.
Grubhub Transaction Volume
| Year |
Gross transaction volume ($bn)
|
| 2013 | 1.3 |
| 2014 | 1.8 |
| 2015 | 2.4 |
| 2016 | 3 |
| 2017 | 3.8 |
| 2018 | 5.1 |
| 2019 | 5.9 |
| 2020 | 8.7 |
| 2021 | 9.7 |
| 2022 | 10.1 |
| 2023 | 9.4 |
(Source: businessofapps.com)
- Grubhub statistics indicate that in 2023, Grubhub’s gross transaction volume stood at US$9.4 billion. This figure represented a drop from the previous year’s level of US$10.1 billion.
- This decline was likely an indication of the slowing overall spending on the platform as it faced stiff competition from other platforms, while consumer spending habits changed.
- The peak transaction volume was in the year 2022 when the company recorded US$10.1 billion. It was slightly more than US$9.7 billion in 2021.
- The highest increases in gross transaction volume were seen in 2020, when it skyrocketed from US$5.9 billion in 2019 to US$8.7 billion.
- This was mostly due to COVID-19, which resulted in increased texting and demand for food delivery services. Before 2020, the platform saw a modest increase: US$5.1 billion in 2018 to US$5.9 billion in 2019. Historically, Grubhub’s transaction volume has steadily increased over the years.
- It reached US$3.8 billion in 2017 compared to US$3 billion in 2016 and US$2.4 billion in 2015.
- The growth of the mission outward and of popularity tended to foster this trend upward. In 2014, trading volumes reached US$1.8 billion; the previous year, they had stood at just US$1.3 billion, buttressing the swift dissemination of food delivery services over the internet.
- All in all, that’s a great deal for Grubhub with regard to its stellar growth over the decade, peaking in 2022 and, not surprisingly, the small dip that was recorded in 2023. How this online platform fares in a rapidly changing food delivery marketplace will probably spell the fate of its future transaction volumes.
Grubhub Users
| Year |
Users (mm)
|
| 2013 | 3.4 |
| 2014 | 5 |
| 2015 | 6.7 |
| 2016 | 8.1 |
| 2017 | 14.5 |
| 2018 | 17.7 |
| 2019 | 22.6 |
| 2020 | 31.4 |
| 2021 | 33.8 |
| 2022 | 28.3 |
| 2023 | 24.6 |
(Source: businessofapps.com)
- Grubhub statistics show that Grubhub’s user base continued to dwindle in 2023 as active users fell from 28.3 million in 2022 to 24.6 million. This drop followed a peak in user count in 2021, when the platform recorded 33.8 million users.
- The loss in active users in 2022 and 2023 is a vital indicator of some changes in the market scenario, which might include an increase in competition from DoorDash and Uber Eats, changing consumer behavior, or maybe some strategy adaptations by the company itself.
- Before the downturn, Grubhub grew at breakneck speed from 2013 to 2021, that is, from 3.4 million in 2013 to 31.4 million in 2020. This was the period when online food delivery services started to take off and when all forms of reliance on such platforms increased due to the COVID-19 pandemic.
- The peak user level had, therefore, been set in 2021, with the platform at 33.8 million users, thus highlighting a high demand for food delivery services.
- The Grubhub user base kept growing productively between 2013 and 2019. The platform had 3.4 million users in 2013, which grew to 5 million in 2014 and 6.7 million in 2015.
- The numbers kept climbing, and by 2016, it had grown to 8.1 million, 14.5 million in 2017, and 17.7 million in 2018. By 2019, the platform had 22.6 million active users, further showing strong consumer acceptance.
Grubhub’s Financial Performance And Market Trends In 2024
- According to Grubhub’s statistics, its parent company projects that its gross transaction value (GTV) in constant currency for non-North American operations grew by 2%, so it seems to satisfy the company’s projections for 2024. When, on the other hand, North American results are included, the group’s total GTV of €26.3 billion in 2024 reflected a 2% decrease from 2023.
- The group’s total revenue for the year was €5,085 million, a decrease of 1% from €5,148 million in 2023. Declines in order volumes due to softer market conditions in North America, Southern Europe, and Australia were the main reasons for this contraction.
- An increase in average transaction value, driven by food price inflation, consumer fees, and ad revenues, partially cushioned the drop. After adjusting for fulfillment costs, 7% more revenue was made per order than the year before.
- Adjusted EBITDA surged impressively from €339 million in 2023 to €460 million in 2024, with the largest contributions from the UK and Ireland on the back of fulfillment cost efficiencies and marketing.
- Free cash flow before working capital changes rose significantly to €104 million in 2024, a major improvement from a negative €52 million in 2023, mainly due to improved adjusted EBITDA.
- Grubhub statistics reveal that the company reported a net loss of €1,645 million in 2024 and a preceding loss of €1,846 million in 2023.
- The majority of the losses were linked to non-cash impairment charges amounting to €1,002 million related to Grubhub. In January 2025, it was announced that Wonder had acquired the platform for US$650 million in enterprise value.
Grubhub Order Fulfillment Cost
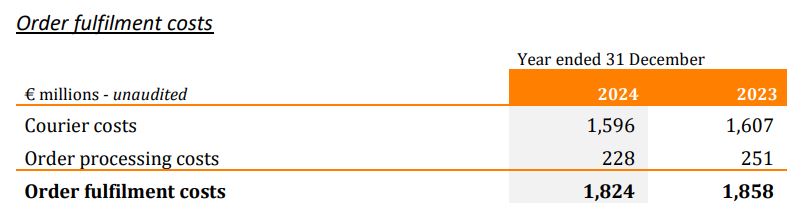
(Source: s205.q4cdn.com)
- Grubhub statistics state that in 2024, marginal declines in Grubhub’s parent company operational courier costs were observed, a numerical categorisation of which includes hiring couriers through agencies, third-party delivery services, independent couriers, and salaries for employed couriers.
- A 1% drop in total expenses from €1,607 million in 2023 to €1,596 million in 2024.
- Notably, in the UK and Ireland, declining courier expenses presented themselves at a cheaper cost per order due to the transfer of delivery operations into more efficient models; this, however, was weighed down by an upsurge in orders for delivery.
- For Northern Europe, however, courier costs went up due to inflation in courier wages and the repercussions of new minimum wage laws.
- The other regions where courier costs went down were North America, Southern Europe, and Australia, where fewer delivery orders were received compared to the previous year. Conversely, in the case of Canada, per-order courier compensation increased due to the application of Bill 88, which introduced new labor regulations that affected courier pay.
- Processing costs for orders went down considerably, decreasing by 9% from €251 million in 2023 to €228 million in 2024. This was mainly due to fewer volumes of orders and increased efficiencies in order management that reduced per-order processing costs.
Grubhub Other Operating Expenses
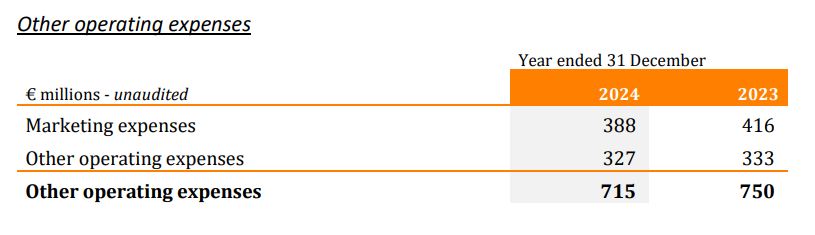
(Source: s205.q4cdn.com)
- Grubhub statistics show that marketing expenses for the year 2024 decreased by 7% from €416 million in 2023 to €388 million. This is mainly due to cost-effective marketing spending across the group.
- The company continued its partnership with UEFA and kept going on with global brand campaigning involving Christina Aguilera and Latto.
- As well as that, other operating expenses went down by another 2%, from €333 million in 2023 to €327 million in 2024, the major reason being a decrease in spending on technology that was partly offset by decreased staffing expenses.
- Depreciation and amortisation costs increased slightly from €307 million in 2023 to €315 million in 2024, with most of the increase due to higher depreciation and amortisation of capitalised development costs as well as right-of-use assets.
- The impairment losses for the year were €354 million, consisting of €98 million goodwill impairment, compared to €456 million in 2023. Other intangible impairments soared to €253 million in 2024 compared to only €12 million in the previous year.
- Grubhub statistics indicate that the net income tax benefit in 2024 is €42 million, somewhat less than reported last year at €47 million. Taxable profits gave rise to a current tax expense of €34 million, more than the €30 million incurred in the previous year.
- The deferred tax benefit now stands at €76 million compared to €75 million in 2023, mainly due to the temporary differences resulting from asset amortisation, impairments, and adjustments to available tax losses carried forward.
- Losses from Grubhub operations in 2024 fell slightly from the previous year to €1,155 million from €1,208 million in 2023. This loss for 2024 was explained primarily by impairment losses of €1,002 million after the revaluation of Grubhub’s assets at fair value according to IFRS 5 standards.
- Losses during 2023 were due in the largest part to impairment losses totalling €1,060 million resulting from an annual asset valuation review.
- Consequently, Just Eat Takeaway.com ended up with a total loss of €1,645 million in 2024 compared to the €1,846 million experienced in 2023. Out of that, €1,155 million relates to the discontinued operations of Grubhub versus €1,208 million in 2023.
- Total loss associated only with continuing operations, less impairment losses, stood at €136 million, compared to €160 million recorded in the previous year.
Grubhub Assets and Liabilities
- The change in property, plant, and equipment for the year that ended December 31, 2024, caused most non-current assets to tumble from €7,840 million at the end of 2023 to €5,524 million at the point of finality in accounting as far as 2024 is concerned.
- The major contributions to the decline in non-current assets were due to impairment losses and the amortisation of intangible assets.
- However, this decline was partially offset by foreign currency exchange contributions of €132 million and a new non-current asset reclassification of Grubhub totaling €812 million.
- Thus, current assets, excluding cash and cash equivalents, continued to decline from their previous year’s high of €607 million to €335 million this year.
- Current assets dropped due to the reclassification of Grubhub’s current assets worth €156 million as assets held for sale.
- Cash and cash equivalents fell from €1,724 million in 2023 to €1,177 million in 2024, due mainly to cash going to repay borrowings of €250 million, share buyback programs worth €203 million, and reclassification of €123 million cash from Grubhub’s disposal group to assets held for sale.
- The resulting shareholders’ equity was €4,452 million by the end of 2024, a drop from €6,044 million in 2023. This was mostly due to losses during the year and treasury shares acquired to the tune of €203 million.
- Reclassification of assets and liabilities amounted to almost all the decrease of non-current liabilities for €995 million.
Conclusion
As per Grubhub statistics, Grubhub was in a stage of transformation since the period was characterized by a decline in market share, user engagement, and order volumes. The acquisition by Wonder Group Inc. opened doors for new strategies but also highlighted the challenges in a fiercely competitive landscape where the likes of DoorDash and Uber Eats operate.
As consumer behavior continues to shift and the food delivery landscape changes, Grubhub’s ability to react and innovate will be pivotal in shaping its future.
Sources
FAQ.
Grubhub’s revenue fell from US$2,482 million in 2022 to US$2,105 million in 2023 due to increased competition, changing consumer habits, and a decrease in overall transaction volume on the platform.
Grubhub was sold for a US$650 million enterprise value, and the deal was completed in January 2025. Such a sale was within the strategic decision of Just Eat Takeaway.com to dispose of the seamless aggregator during continued financial losses.
Active customers shrank from 33.8 million in 2021 to 24.6 million in 2023 at Grubhub, much owing to competition exerted generally from DoorDash and Uber Eats plus changing consumer trends.
The adjusted EBITDA surged from €339 million in 2023 to €460 million in 2024, even with decreasing revenues, thanks to cost-reduction measures on courier fees, marketing expenses, and order processing efficiency.
In 2024, Grubhub posted losses of €1,155 million, primarily due to the asset revaluation per IFRS 5 standards and impairment losses amounting to €1,002 million. These adverse results aggravated the financial woes of Just Eat Takeaway.com, which clocked an overall loss of €1,645 million for the year.

Joseph D'Souza founded ElectroIQ in 2010 as a personal project to share his insights and experiences with tech gadgets. Over time, it has grown into a well-regarded tech blog, known for its in-depth technology trends, smartphone reviews and app-related statistics.