Smartphones Statistics and Facts: By Users, Market Share, Revenue Insights And Trend (2025)
Updated · Nov 17, 2025

Table of Contents
- Introduction
- Editor’s Choice
- Number of Smartphone Users Global
- Total Number of Smartphones
- Smartphone Users By Country
- Share of Smartphones Shipments
- Market Share of Smartphone Shipments
- Smartphone Ownership In The US
- Average Time Spent On Smartphones
- U.S. Smartphone Ownership Demographics
- Smart Users By Income Level
- Mostly Usage Of Smartphones
- Smartphone Revenue
- Future Projections
- Conclusion
Introduction
Smartphones Statistics: In 2025, the use of smartphones no longer resembles the traditional use of phones; rather, it is the use of small, powerful computers that we carry with us wherever we go. The smartphones that we use today have become the main actors in our daily lives, performing roles from streaming and messaging to online banking and shopping. The future trend of their growth is still being driven by rapid technological advances, especially in 5G connectivity and AI-powered capabilities, which will each have their respective impacts on the development of mobile phones.
The major global markets, such as China, India, and the U.S., are at the top in adoption, and the emerging economies show great promise. This report presents the most recent smartphone statistics, trends, and projections that will shape the future of the smartphone industry.
Editor’s Choice
- The total number of smartphones in use worldwide is approximately 7.43 billion as of 2025, which is a clear indication of how central mobile devices have become to people’s daily lives.
- The overall number of mobile phones around the globe is 8.31 billion, thus implying there are more phones than human beings.
- The number of smartphones in use is expected to hit 7.58 billion by 2026 and 8.06 billion by 2029, demonstrating the constant increase in their numbers.
- Out of the total 974.69 million smartphone users in China, India has 659 million, and the United States has 276.14 million.
- In 2025, India surpassed China as the leading supplier of smartphones to the U.S., with a 44% share of imports compared to China’s 25%.
- Samsung is the largest player in the global market with a share of 20%, while Apple comes second with a share of 17%.
- The percentage of people with smartphones in the U.S. rose to 91% in 2024, which is a significant increase from 35% in 2011.
- The daily average time spent on online activities using smartphones increased steadily from 1 hour and 38 minutes in 2014 to approximately 3 hours and 45 minutes in 2024, and eventually reached a plateau at a high level.
- Owning a smartphone is most prevalent among the rich—96% of the people in the US$100,000+ category are owners, while the percentage is 84% for the US$30,000- category.
- The three leading global smartphone activities are messaging (75% of users), emailing (71%), and managing finances (63%).
- The global smartphone revenue is likely to reach US$485.3 billion by 2025, with a compound annual growth rate of 3.76% going through till 2029.
- Although the smartphone market is mature, it is gradually expanding and is expected to generate US$0.6 trillion in revenue by the end of 2029.
- The adoption of 5G technology is gaining momentum, with the number of subscriptions reaching 1.9 billion by the end of 2024, and global coverage expected to be 65% in 2025.
- Mobile devices account for 58.7% of the total worldwide web traffic (this is expected to increase to 60.9% in 2025).
- The global app economy’s 2024 record stands at 255 billion downloads and is further expected to contribute US$613 billion by 2025.
- It is estimated that 72.6% of smartphone users will consider using their phones as their sole source for internet access by 2025.
Number of Smartphone Users Global
(Reference: testmyspeed.com)
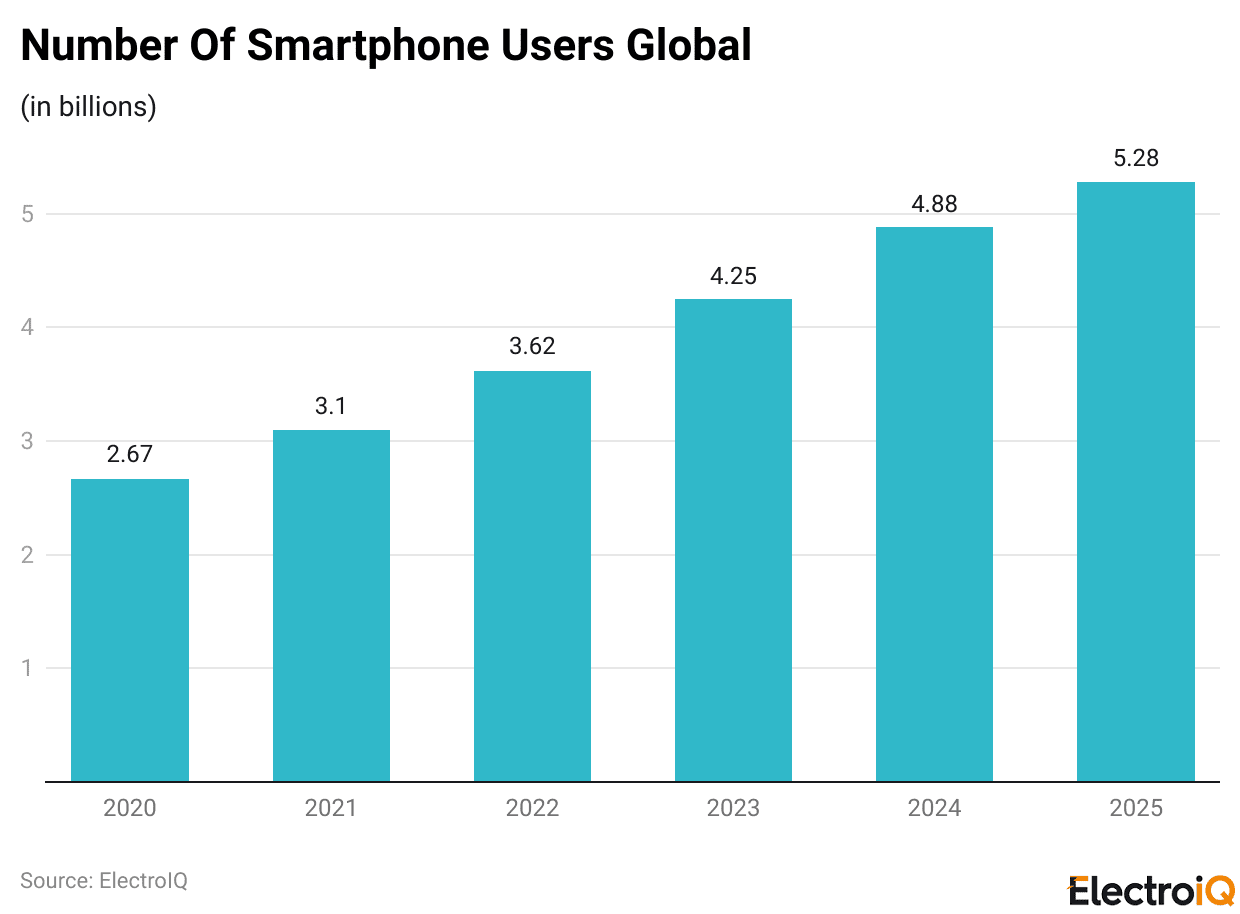
- By 2025, the number of smartphone users worldwide had already surpassed 7.43 billion — showing very clearly how deeply mobile technology has been integrated into people’s everyday lives.
- This number signifies a considerable rise over the years and once more verifies that the majority of mobile gadgets owned by individuals are smartphones.
- The journey from a simple mobile phone to a smartphone has been largely influenced by advancements in technology, including 5G networks, faster processors, more intelligent cameras, and AI features.
- Besides, mobile apps are making the operators of app stores billionaires by generating billions of dollars every year, which is a clear indication of the communication and trade areas where smartphones are completely indispensable.
- The flow of money into smartphone technology by companies in the tech world is a never-ending one, as each company strives to conceive the next great idea in a constantly competitive and ever-changing market.
- At present, the total number of mobile phones in the world is estimated to be around 8.31 billion; however, the majority of these are not smartphones.
- The primary reason for this is the users’ limited financial resources or inadequate access to the most up-to-date technologies.
- However, the trend is that the users of basic mobile phones will eventually migrate to smartphones as the latter get cheaper and network coverage becomes wider.
- Looking to the future, predictions indicate that by 2026, there will be approximately 7.58 billion smartphones worldwide.
- This gradual rise demonstrates how rapidly the world is approaching complete connectivity — a state of digital access and communication that can be compared to nothing that has ever existed in human history.
Total Number of Smartphones
| Year | Number of Smartphones (in billions) |
| 2014 | 2.33 billion |
| 2015 | 3.00 billion |
| 2016 | 3.70 billion |
| 2017 | 4.45 billion |
| 2018 | 5.05 billion |
| 2019 | 5.59 billion |
| 2020 | 5.92 billion |
| 2021 | 6.34 billion |
| 2022 | 6.62 billion |
| 2023 | 6.97 billion |
| 2024 | 7.21 billion |
| 2025 | 7.43 billion |
| 2026* | 7.58 billion |
| 2027* | 7.77 billion |
| 2028* | 7.95 billion |
| 2029* | 8.06 billion |
(Source: grabon.com)
- The information suggests that the worldwide number of smartphones has consistently increased over the past decade, indicating technological progress and a rise in global interconnectivity.
- The number of smartphones in use was roughly 2.33 billion in 2014, representing a rapid growth that surpassed 5 billion by 2018 and 6 billion by 2021.
- It is estimated that the number of active smartphones worldwide will reach 7.43 billion in 2025, and projections indicate continued growth to approximately 8.06 billion by 2029.
- If we factor in the feature phones, the total number of active mobile subscriptions will be 8.31 billion, which means there are more mobile devices than people on the planet.
- This clearly indicates that several people possess more than one smartphone, and the market is still growing, albeit at a slower pace compared to the previous years.
Smartphone Users By Country
| Country | Total Number of Smartphone Users |
Penetration
|
| China | 974.69 million | 68.4% |
| India | 659 million | 46.5% |
| United States | 276.14 million | 81.6% |
| Indonesia | 187.7 million | 68.1% |
| Brazil | 143.43 million | 66.6% |
| Russia | 106.44 million | 73.6% |
| Japan | 97.44 million | 78.6% |
| Nigeria | 83.34 million | 38.1% |
| Mexico | 78.37 million | 61.5% |
| Pakistan | 72.99 million | 31.0% |
(Source: grabon.in)
- The data demonstrate variations in smartphone adoption rates among major nations.
- The top smartphone user country is China, with approximately 974.69 million smartphone users, reflecting a penetration rate of 68.4% which indicates the majority of the population owns smartphones.
- India, with its 659 million users and 46.5% penetration rate, is next in line with a huge growth potential considering its enormous and still-developing market.
- The United States comes in third place with 276.14 million users, but has the highest penetration rate among large countries at 81.6%, meaning that most Americans are smartphone owners.
- Other countries, such as Indonesia, Brazil, and Russia, are also very supportive, with smartphone penetration rates above 65%. In contrast, the penetration levels in developing countries are very low, e.g., Nigeria has a penetration level of 38.1%, and Pakistan is at 31%, indicating a limited market.
(Source: statista.com)
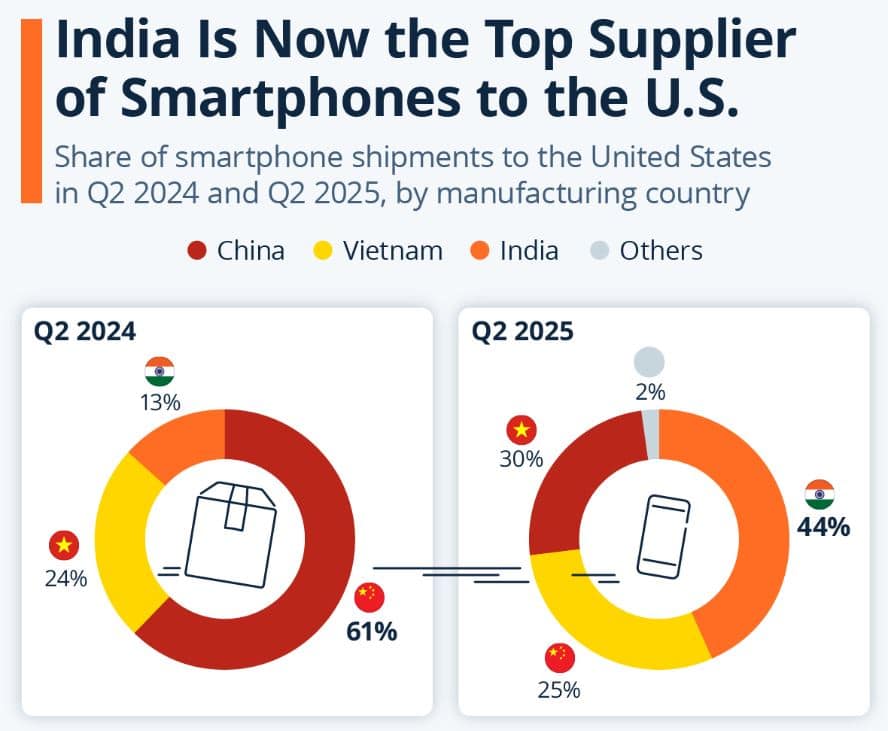
- India has emerged as the leading supplier of smartphones to the U.S. in the second quarter of 2025, indicating a significant shift in the global manufacturing landscape.
- Figures released by Canalys indicate that 44% of the total number of smartphones shipped to the United States were produced in India, while Vietnam supplied 30% and China accounted for 25%.
- A year ago, China held the largest share, at 61%, followed by Vietnam at 24% and India at 13%.
- India’s smartphone production doubled and tripled over the past year, fortifying its impressive growth in global supply chains.
- This alteration in the supply chain has its roots in the tensions between countries and the new U.S. trade policies.
- The Trump administration initiated the implementation of tariffs, and Apple, among others, subsequently transferred most of its production for the U.S. market from China to India. It has also been the case with Samsung and Motorola, although they have done so at a slower pace.
- During the worst period of the trade war, the U.S. imposed tariffs as high as 145% on Chinese products, but the rate has since been reduced to 30%.
- The U.S. has recently imposed 25% tariffs on Indian products and an additional tax on India’s acquisition of Russian oil.
- They have also reduced Vietnam’s tariffs to 20%, down from 46% for a short time.
- The policy changes announced on August 1, which are set to take effect from August 7, are causing a shift in Indian exports and positioning the country as a prominent player in the global smartphone industry, as well as in trade.
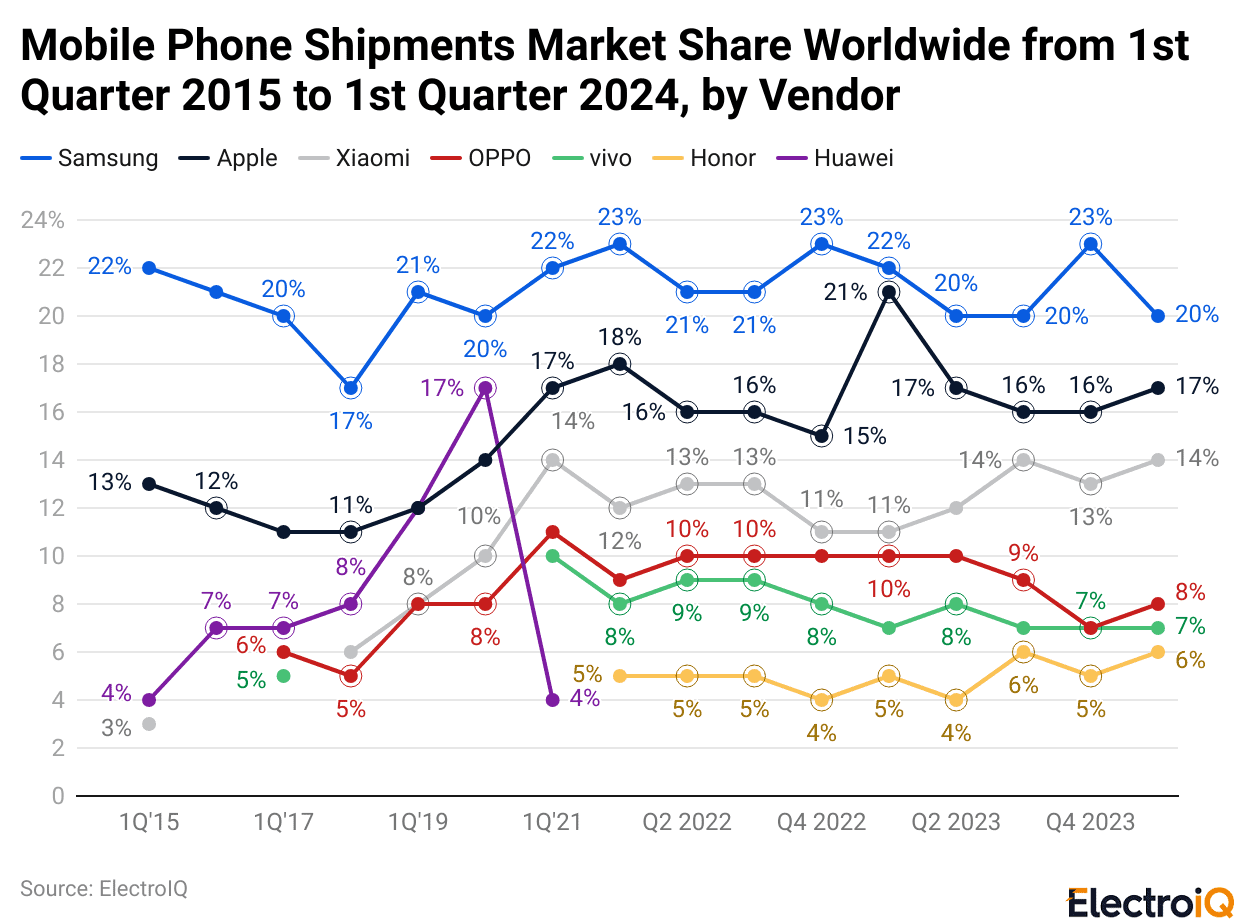
(Reference: statista.com)
- In the first quarter of 2024, Samsung took the lead in the global smartphone market with a 20% share, thereby consolidating its position as the top vendor.
- With a 17% share, Apple was the runner-up, a clear signal of its powerful presence worldwide.
- Other brands of smartphones collectively formed the rest of the market, indicating that there is still a wide range of competition; however, Samsung and Apple have already taken the lead in the global market.
Smartphone Ownership In The US
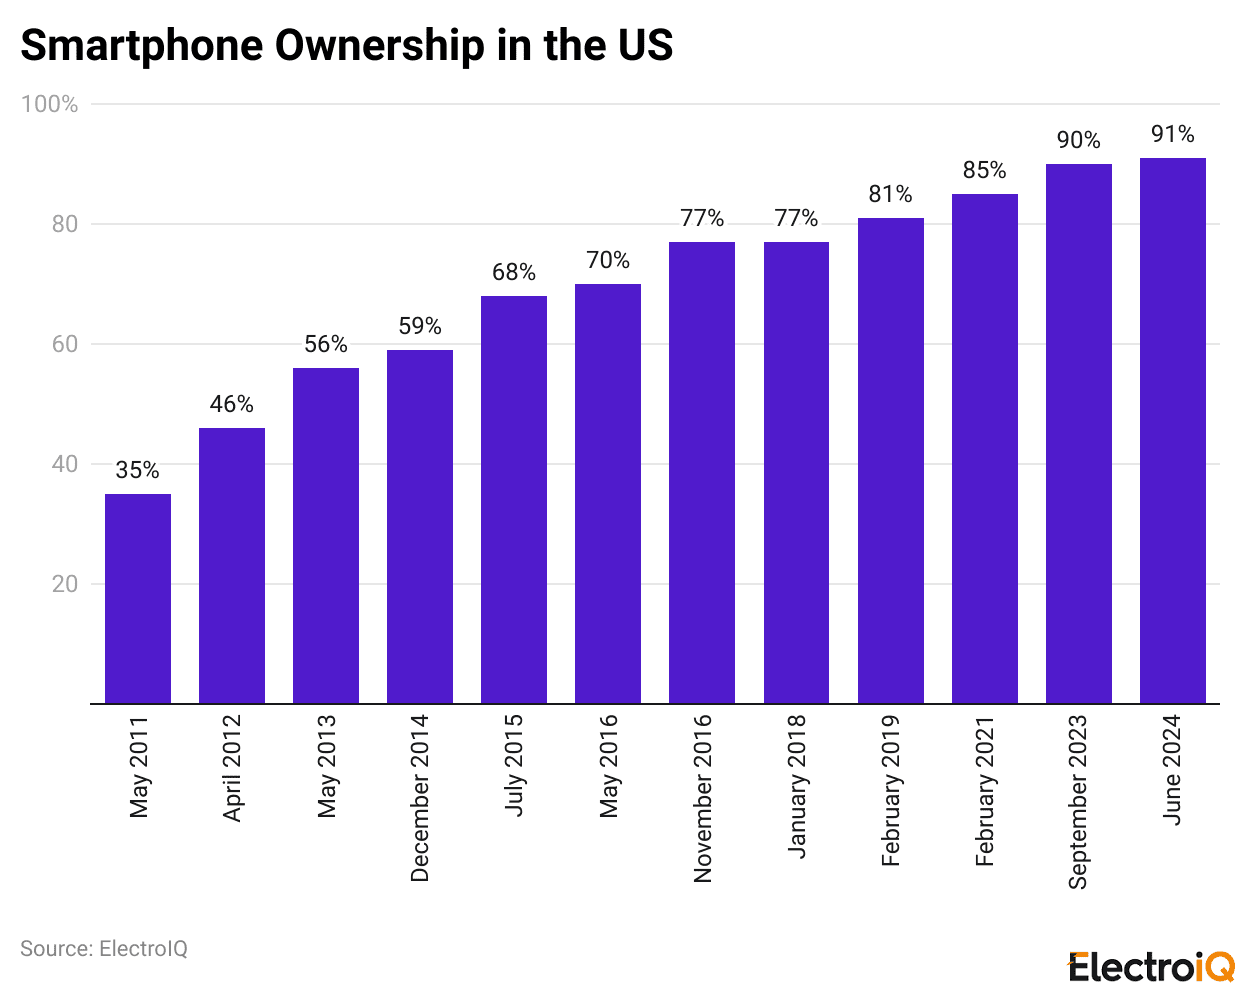
(Reference: backlinko.com)
- The ownership of smartphones in the United States has been increasing steadily since 2011, which is a testament to how rapidly mobile technology has become a necessity in people’s daily lives.
- In May 2011, only 35% of Americans owned a smartphone; by April 2012, this figure had risen to 46%.
- It continued to grow throughout the decade, reaching 56% in 2013 and 68% by mid-2015.
- By 2016, the number increased to 70%, and again in the same year, it went up to 77% which was the first time people above the age of 18 in the US were categorized as being more than 75% smartphone owners.
- The years 2018 to 2021 saw a mere fluctuation in the percentage of ownership, which was maintained at around 77–85%; hence, the market became mature.
- Nevertheless, in September 2023, the smartphone ownership percentage was recorded as 90% and by June 2024, it became 91%, thus representing almost total adoption by the US population.
Average Time Spent On Smartphones
| Date |
Daily Time Spent Using the Internet on Smartphones
|
| 2014 |
1 hour 38 minutes
|
| 2015 |
2 hours 2 minutes
|
| 2016 |
2 hours 21 minutes
|
| 2017 |
2 hours 31 minutes
|
| Q2-Q3 2018 |
3 hours 6 minutes
|
| Q3 2019 |
3 hours 22 minutes
|
| Q3 2020 |
3 hours 39 minutes
|
| Q3 2021 |
3 hours 43 minutes
|
| Q3 2022 |
3 hours 46 minutes
|
| Q3 2023 |
3 hours 50 minutes
|
| Q1 2024 |
3 hours 43 minutes
|
| Q2 2024 |
3 hours 45 minutes
|
(Source: backlinko.com)
- The figures show that people have been gradually spending more time on the internet with their smartphones during the last ten years.
- The average internet usage on smartphones was 1 hour and 38 minutes in 2014. By 2015, the duration had exceeded 2 hours, and by 2016, it had reached 2 hours and 21 minutes.
- The use of the internet on smartphones continued to increase slowly and reached the mark of 2 hours and 31 minutes in 2017, then experienced a leap to over 3 hours in 2018.
- The same uptrend was observed in 2019 and 2020, with daily smartphone internet usage reaching 3 hours and 39 minutes at the peak of the pandemic.
- The trend of increasing smartphone usage was also observed in 2021, with an average duration of use of 3 hours and 43 minutes, which steadily increased to 3 hours and 50 minutes by 2023.
- A slight average drop in the early 2024 period to 3 hours and 43 minutes was followed by a rise to 3 hours and 45 minutes in Q2, indicating that internet access via smartphones has nearly reached a high level of daily engagement.
U.S. Smartphone Ownership Demographics
- In the U.S., it is almost impossible to find a person without a mobile phone, as 19 out of 20 people use one.
- According to Pew Research, there are minor differences in smartphone ownership between demographic groups, with 80% of men and 75% of women having smartphones.
- Women are, however, a little more likely to have non-smartphone cell phones.
- The younger generation is leading in smartphone adoption, with a whopping 94% of people aged 18 to 29 having one.
- The percentage of ownership goes down gradually with age, the figure being 89% among those aged 30 to 49, 73% among 50 to 64, and only 46% among those over 65.
- The highest smartphone ownership is in urban areas at 83%, with 78% among suburb-dwellers and 65% in rural areas.
- There is not much difference in smartphone ownership across different ethnic groups, with 77% of whites and Hispanics and 75% of blacks having had smartphones at some point in their lives.
- However, including all the different types of cell phones in the figure, ownership rises to 98% among Blacks, 97% among Hispanics, and 94% among Whites.
- Education level has a huge impact on smartphone ownership. The ownership rate is only 57% among those with less than a high school education, whereas it is 69% for high school graduates, 80% for those with some college education, and 91% among college graduates.
- The circumstances are alike in the case of income levels – a smartphone is owned by only 67% of the persons with an annual income of less than US$30,000, while the ownership statistic goes up to US$ 30,000–US$ 49,999 82%, US$ 50,000-US$ 74,999 83%, and US$ US$75,000 or more, 93%.
- To sum up, the U.S. has nearly total smartphone ownership, but still, age, education, income, and location factors affect the extent of adoption throughout the population.
Smart Users By Income Level
| Income Range | Own a SMARTPHONE | Own a phone, but NOT a smartphone |
TOTAL of those who own ANY kind of phone
|
| Less than $30,000 | 84% | 10% | 95% |
| $30,000 – $69,999 | 89% | 8% | 98% |
| $70,000 – $99,999 | 95% | 3% | 99% |
| $100,000+ | 96% | 2% | 99% |
(Source: grabon.in)
- The United States shows a strong correlation between smartphone ownership and income.
- The economist analyzes the person’s income from less than 30,000 to 84% owning a smartphone, with another 10% reflecting in higher income brackets — 89% of those earning between US$30,000 and US$69,999 own smartphones, and 95% of those earning between US$70,000 and US$99,999 do.
- The highest income bracket, which is defined as an annual income of over US$100,000, has the leading smartphone adoption rate of 96%, equivalent to a universal phone ownership rate of 99%.
- This trend indicates that though the basic phone is owned by almost all in different income groups, the adoption of smartphones is still highly dependent on the income level.
Mostly Usage Of Smartphones
| Activity |
Percentage of Users Who Engage
|
| Messaging (text/chat) | 75% |
| Emailing | 71% |
| Managing finances | 63% |
| Music streaming | 62% |
| Video streaming | 61% |
(Source: grabon.in)
- In different parts of the world, people have divided the use of smartphones into numerous categories, but messaging is the leading one by a big margin — about 75% of people engage in texting or chatting via apps.
- Very closely behind, 71% of the mobile users resort to their phones for email, hence making it a significant device in both personal and professional communication.
- Users are also quite active in managing their finances, with 63% availing of mobile banking and other services through apps.
- Entertainment is another case where people use more than 60% to be specific —62% of the population streams music on their phones, and 61% watch videos.
- All in all, the use of smartphones is mainly in the areas of communication, productivity, and entertainment.
Smartphone Revenue
| Year |
Revenue (US $)
|
| 2018 | 0.4 trillion |
| 2019 | 0.5 trillion |
| 2020 | 0.4 trillion |
| 2021 | 0.5 trillion |
| 2022 | 0.5 trillion |
| 2023 | 0.5 trillion |
| 2024 | 0.5 trillion |
| 2025 | 0.5 trillion |
| 2026* | 0.5 trillion |
| 2027* | 0.5 trillion |
| 2028* | 0.5 trillion |
| 2029* | 0.6 trillion |
(Source: grabon.in)
- Revenue from the global smartphone market has been steadily increasing over the years and is expected to reach approximately US$485.3 billion by 2025.
- The annual growth for this market is projected to be 3.76% through 2029, with China being the largest contributor, bringing in revenues of about US$111.9 billion.
- The smartphone industry’s growth has been consistent and is mainly attributed to the continuous flow of technology, better access to the internet, and more people growing fond of smartphones.
- Revenue trends have shown a stable performance over the years, with the market expected to be around US$0.5 trillion from 2019 through 2028 and then a slight rise to US$0.6 trillion in 2029.
- This situation indicates that the market has matured but is still growing relatively slowly in terms of demand.
Future Projections
- Smartphone usage worldwide continues to increase and is not anticipated to cease anytime soon.
- The development of new technologies such as 5G, quick networks, and strong internet connectivity will push more people toward using smartphones for daily tasks and digital access.
- By 2025, the number of global smartphone users is expected to increase by around 2–3% to 7.34 billion, and the number of smartphone subscriptions will likely rise further to 7.69 billion by 2027.
- As mobile device reliance grows, it is estimated that about 72.6% of smartphone users will access the internet primarily through their phones by the year 2025, indicating a significant transition to mobile-only internet access.
- The global smartphone market, which is expected to be worth US$1.48 billion in 2024, is also likely to grow further to US$1.74 billion by 2033, all thanks to the combination of innovation and consumer demand.
- Smartphones have also taken over web activity, which led to mobile devices holding 58.7% of global website traffic in 2024, a number that is predicted to be 60.9% in 2025.
- Also, the global app economy is still in its peak with 255 billion app downloads in 2024, an increase of 7% over the last year, and US$613 billion is the predicted revenue for 2025.
- One of the reasons for this tremendous development is the spread of 5G, which is expected to have 1.9 billion subscriptions by the end of 2024 and will be available to 65% of the world’s population by 2025.
- Besides, mobile commerce is on the rise; almost 80% of smartphone users will have made at least one phone purchase by 2025.
Conclusion
Smartphones Statistics: Smartphones have metamorphosed from luxury items into vital daily drivers of global connectivity, commerce, and communication. The constant increase in the number of users, the roll-out of 5G networks, and the growth of the mobile sector reflect a strong and maturing market. As mobile devices take over web traffic and app downloads hit new records, smartphones remain the major factor in digital behaviour across the globe.
Income, education, and location continue to influence device ownership, but an increasing number of people can now access them. In the near future, smartphone adoption is expected to continue growing, mobile commerce will further develop, and innovation will continue to broaden the capabilities of these devices. The evolution of smartphones remains the primary aspect of the future.
FAQ.
In 2025, an estimated 7.43 billion smartphones will be in use across the globe, which reflects the deep integration of mobile technology in day-to-day living. This number will gradually rise to 8.06 billion in 2029.
China is the undisputed leader with about 974.69 million users, India follows close with 659 million, and the U.S. with 276.14 million. The U.S. also enjoys the highest penetration rate among the top countries at 81.6%.
Smartphone ownership in the U.S. increased from 35% in 2011 to 91% in 2024, which means practically everyone owns a smartphone. The most significant growth was between 2011 and 2016, as smartphones became the only means for communication and access to the internet.
The most popular smartphone activities all over the world are messaging (75%), emailing (71%), and money management (63%), while music (62%) and video streaming (61%) come next.
The global smartphone market is expected to make a revenue of US$485.3 billion in 2025, registering an annual growth rate of 3.76% until 2029. The expanding 5G networks, mobile commerce, and app usage will be the main factors driving the further global adoption and innovation of smartphones.

Tajammul Pangarkar is the co-founder of a PR firm and the Chief Technology Officer at Prudour Research Firm. With a Bachelor of Engineering in Information Technology from Shivaji University, Tajammul brings over ten years of expertise in digital marketing to his roles. He excels at gathering and analyzing data, producing detailed statistics on various trending topics that help shape industry perspectives. Tajammul's deep-seated experience in mobile technology and industry research often shines through in his insightful analyses. He is keen on decoding tech trends, examining mobile applications, and enhancing general tech awareness. His writings frequently appear in numerous industry-specific magazines and forums, where he shares his knowledge and insights. When he's not immersed in technology, Tajammul enjoys playing table tennis. This hobby provides him with a refreshing break and allows him to engage in something he loves outside of his professional life. Whether he's analyzing data or serving a fast ball, Tajammul demonstrates dedication and passion in every endeavor.