Apple Statistics By Revenue, Market Share, Shipments, Net Income And Carbon Emission
Updated · Sep 27, 2024

Table of Contents
- Introduction
- Editor’s Choice
- Global Revenue Of Apple
- Revenue Of Apple By Quarter
- Revenue Of Apple By Operating Segment
- Apple Revenue By Region
- Apple Net Income
- Apple’s Number Of Employees
- Apple iPhone Revenue Over The Years
- Apple Shipments Worldwide
- iOS Market Share Worldwide
- iPhone Adoption Rate
- Apple Revenue From Mac
- Apple Mac Shipments Worldwide
- Mac Os Version Market Share Worldwide
- Apple Revenue From iPad
- iPad’s Share In The Total Revenue Of Apple
- Apple iPad Unit Shipments Worldwide
- Revenue Comparison Of Apple With Top IT Companies
- Apple’s Expenditure On Research And Development
- Carbon Emissions Of Apple Devices
- Apple Overview
- Conclusion
Introduction
Apple Statistics: Apple is a name synonymous with innovation. It is well known for its out-of-the-box approach to changing the status quo in the technology industry. Since its inception, the company has been the guiding force and a trendsetter, from personal computing devices to iPods and game-changing iPhones.
Thus, it became the first US company valued at over $1 trillion. Likewise, we will review Apple statistics to learn about its success and the factors that have caused the company to gain high customer loyalty.
Editor’s Choice
- The iPhone generated USD 69.7 billion in revenue in Q1 2024 alone.
- America accounted for 43.94% of Apple’s revenue share in Q3 2024.
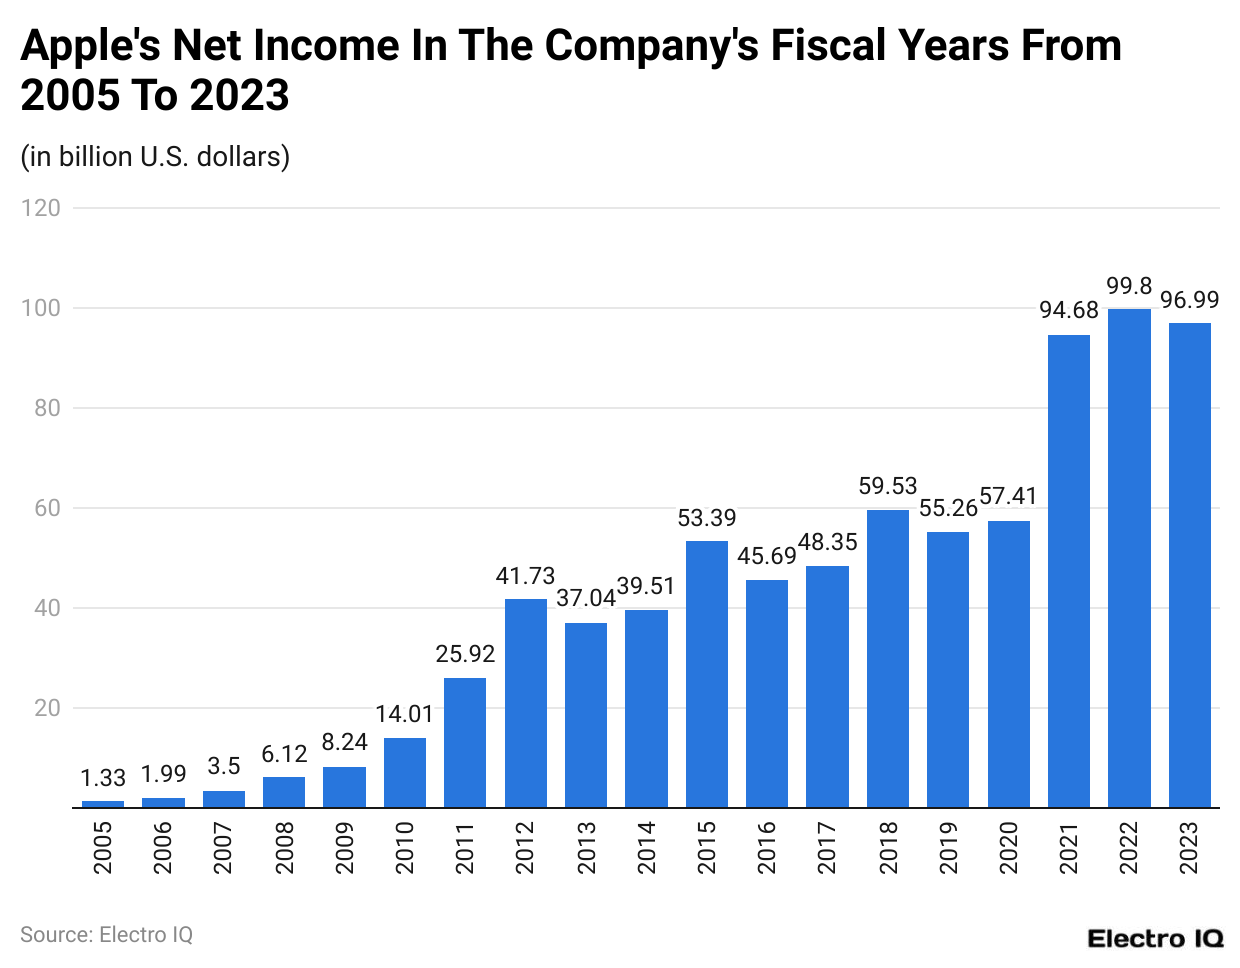
- Apple’s net income peaked at USD 99.8 billion in 2022.
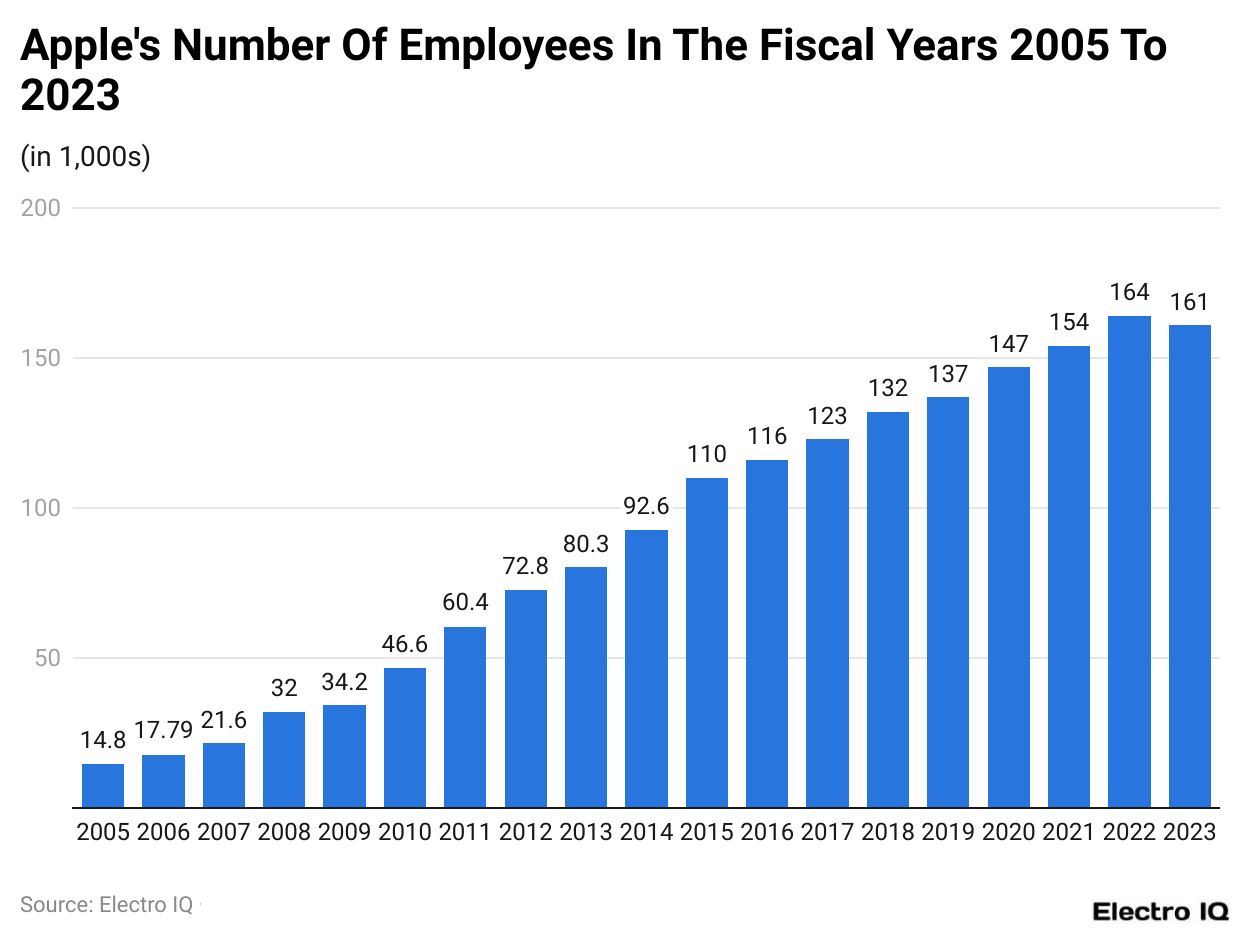
- The number of Apple employees reached 164,000 in 2022.
- iPhone shipments hit a record 90.1 million units in Q4 2020.
- iOS 17.0 dominated the market with a 62.74% share in February 2024.
- The iPhone 15 Pro Max had the highest adoption rate among iPhone 15 models.
- Mac revenue peaked at USD 11,058 million in Q4 2022.
Global Revenue Of Apple
(Reference: Statista.com)
- As per Apple statistics, the iPhone is the company’s highest-grossing product.
- Since its introduction to the public in 2007, the iPhone had the highest revenue in Q1 2022, with $71,628 million.
- As of Q3 2024, Apple’s revenue was $39,928 million.
- The Apple statistics showcase that the company’s global revenue is increasing consistently.
- By the end of 2023, Apple’s revenue was $383.29 billion.
- Between 2004 and 2023, Apple’s highest revenue was recorded in 22, at $393.3 billion.
Revenue Of Apple By Quarter
(Reference: Statista.com)
- Looking at Apple’s statistics, one will find that its global revenue has increased quarter by quarter.
- Between Q1 2005 and Q3 2024, the highest quarterly revenue was recorded in Q1 2022, with $123.95 billion.
Revenue Of Apple By Operating Segment
(Reference: Statista.com)
- Looking at Apple’s statistics, it is evident that the iPhone has a significant share of the company’s overall revenue.
- As of Q3 2023, iPhone had the highest revenue of $69.7 billion in the first quarter of 2024. It is followed by Services with $23.12 billion, Wearables, home and accessories with $11.95 billion, Mac with $7.78 billion, and iPad with $7.02 billion.
- Between Q1 2012 and Q3 2024, Apple’s highest revenue was recorded in Q1 2022, at $71.63 billion.
Apple Revenue By Region
(Reference: Statista.com)
- Apple statistics reveal that the company’s revenue can be divided into five regions: the Americas, Europe, Greater China, Japan, and the Rest of Asia Pacific.
- America is consistently the highest-grossing region. As of Q3 2024, Apple’s revenue share was 43.94%, followed by Europe at 25.51%, Greater China at 17.17%, the Rest of Asia Pacific at 7.45%, and Japan at 5.94%.
Apple Net Income

(Reference: Statista.com)
- Apple statistics reveal that net income is increasing consistently.
- Between 2005 and 2023, Apple’s income was highest in 2022 at $99.8 billion.
- In 2023 the revenue of Apple’s net income was $96.99 billion.
Apple’s Number Of Employees

(Reference: Statista.com)
- Apple statistics show that Apple’s revenue has been increasing consistently.
- Between the period (2005 – 2023), the highest number of employees was 164k in 2022.
- By the end of 2023, there were 161k employees at Apple.
Apple iPhone Revenue Over The Years
(Reference: Statista.com)
- As per Apple statistics, the iPhone is the company’s highest-grossing product.
- Since its introduction to the public in 2007, the iPhone had the highest revenue in Q1 2022, with $71,628 million.
- As of Q3 2024, Apple’s revenue was $39,928 million.
Apple Shipments Worldwide
(Reference: Statista.com)
- Apple statistics showcase that the company’s revenue fluctuates continuously.
- Between Q1 2010 and Q1 2024, the highest number of shipments was recorded in Q4 2020, with 90.1 million units.
- By the end of Q1 2024, there were 45.2 million shipments.
(Reference: Statista.com)
- iOS is Apple’s core operating system, and its new version is released annually.
- As of February 2024, Apple statistics showcase that iOS 17.0 has the highest market share with 62.74%, followed by iOS 16 with 24.12%, iOS 15 with 8.97%, iOS 14 with 1.7%, iOS 12 with 1.3%, iOS 13 with 0.79%, iOS 11 with 0.26%, and iOS 10 with 0.18%.
iPhone Adoption Rate
(Reference: Statista.com)
- iPhone 15 is one of the most popular Apple phone models available worldwide.
- Apple statistics showcase that the iPhone 15 had the following variants: iPhone 15, iPhone 15 Plus, iPhone 15 Pro, and iPhone 15 Pro Max.
- As of January 2024, the iPhone 15 Pro Max has the highest adoption rate, with 3.64%, followed by the iPhone 15 Pro, with 2.3%, the iPhone 15, with 1.66%, and the iPhone 15 Plus, with 0.66%.
Apple Revenue From Mac
(Reference: Statista.com)
- According to Apple statistics, the highest revenue for the company’s Mac computer was in Q4 2022, at $11,058 million, between Q1 2006 and Q1 2024.
- In Q1 2024, Apple generated $7009 million in sales from revenue from its Mac computers.
Apple Mac Shipments Worldwide
(Reference: Statista.com)
- According to Apple statistics, the highest number of shipments of Apple products between Q1 2006 and Q2 2023 was between Q3 2022, with $8,267k.
- As of Q2 2023, the Apple Mac shipments were $6,349k.
(Reference: Statista.com)
- Going through the Apple statistics, one will find the following versions of Mac:macOS Catalina, macOS Mojave, macOS High Sierra, macOS Sierra, OS X El Capitan, OS X 10.10, OS X Mavericks, and Other Versions.
- In February 2024, macOS Catalina had the highest market share, with 94.97%, followed by macOS High Sierra at 1.37%, macOS Sierra at 0.93%, macOS Mojave with 0.81%, OS X El Capitan with 0.64%, Other versions with 0.59%, OS X 10.10 with 0.45%, and OS X Mavericks with 0.24%.
Apple Revenue From iPad
(Reference: Statista.com)
- The Apple statistics showcase that revenue from iPad has been steady.
- Between Q3 2010 and Q3 2024, the highest revenue from iPad sales was in Q1 2014, with $11,468 million.
- As of Q3 2024, the revenue of Apple iPad was Q3 2024 with $7,162 million.
(Reference: Statista.com)
- Apple statistics show that the overall percentage of iPads as a share of Apple’s total fortune has consistently decreased.
- Between Q3 2010 and Q3 2024, the highest percentage share of iPad in Apple’s total revenue was 26.19% in Q3 2012.
- By the end of Q3 2024, The revenue of apple is 8.35%
Apple iPad Unit Shipments Worldwide
(Reference: Statista.com)
- The total shipments of Apple tablets have been fluctuating over the years.
- Between Q1 2012 and Q1 2024, Apple shipped the most in Q3 2013, with 26 million shipments.
- By the end of Q1 2024, there will be 12.3 million shipments of Apple iPads.
Revenue Comparison Of Apple With Top IT Companies
(Reference: Statista.com)
- Apple’s statistics show it fares well among its competitors, namely Google, Alphabet, and Microsoft.
- In 2022, Apple posted a revenue of $394.33 billion in comparison, Alphabet had an income of $282.83 billion, Google had an income of $279.8 billion, and Microsoft had a revenue of $198.27 billion.
Apple’s Expenditure On Research And Development

(Reference: Statista.com)
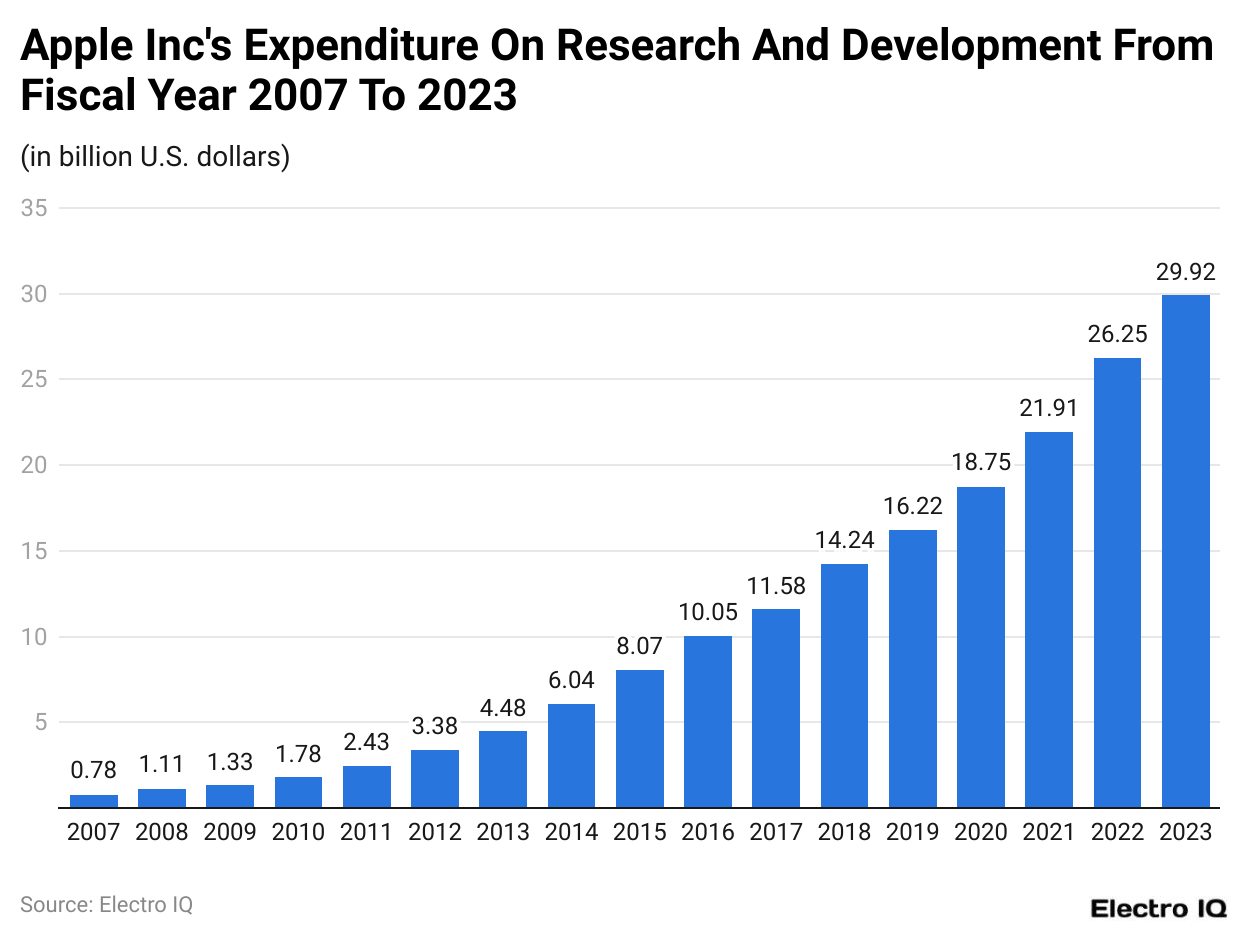
- The Apple statistics show that Apple’s investment in research and development is increasing steadily.
- As of 2023, Apple’s expenditure was $29.92 billion, a significant leap from $0.78 billion in 2007.
Carbon Emissions Of Apple Devices

(Reference: Statista.com)
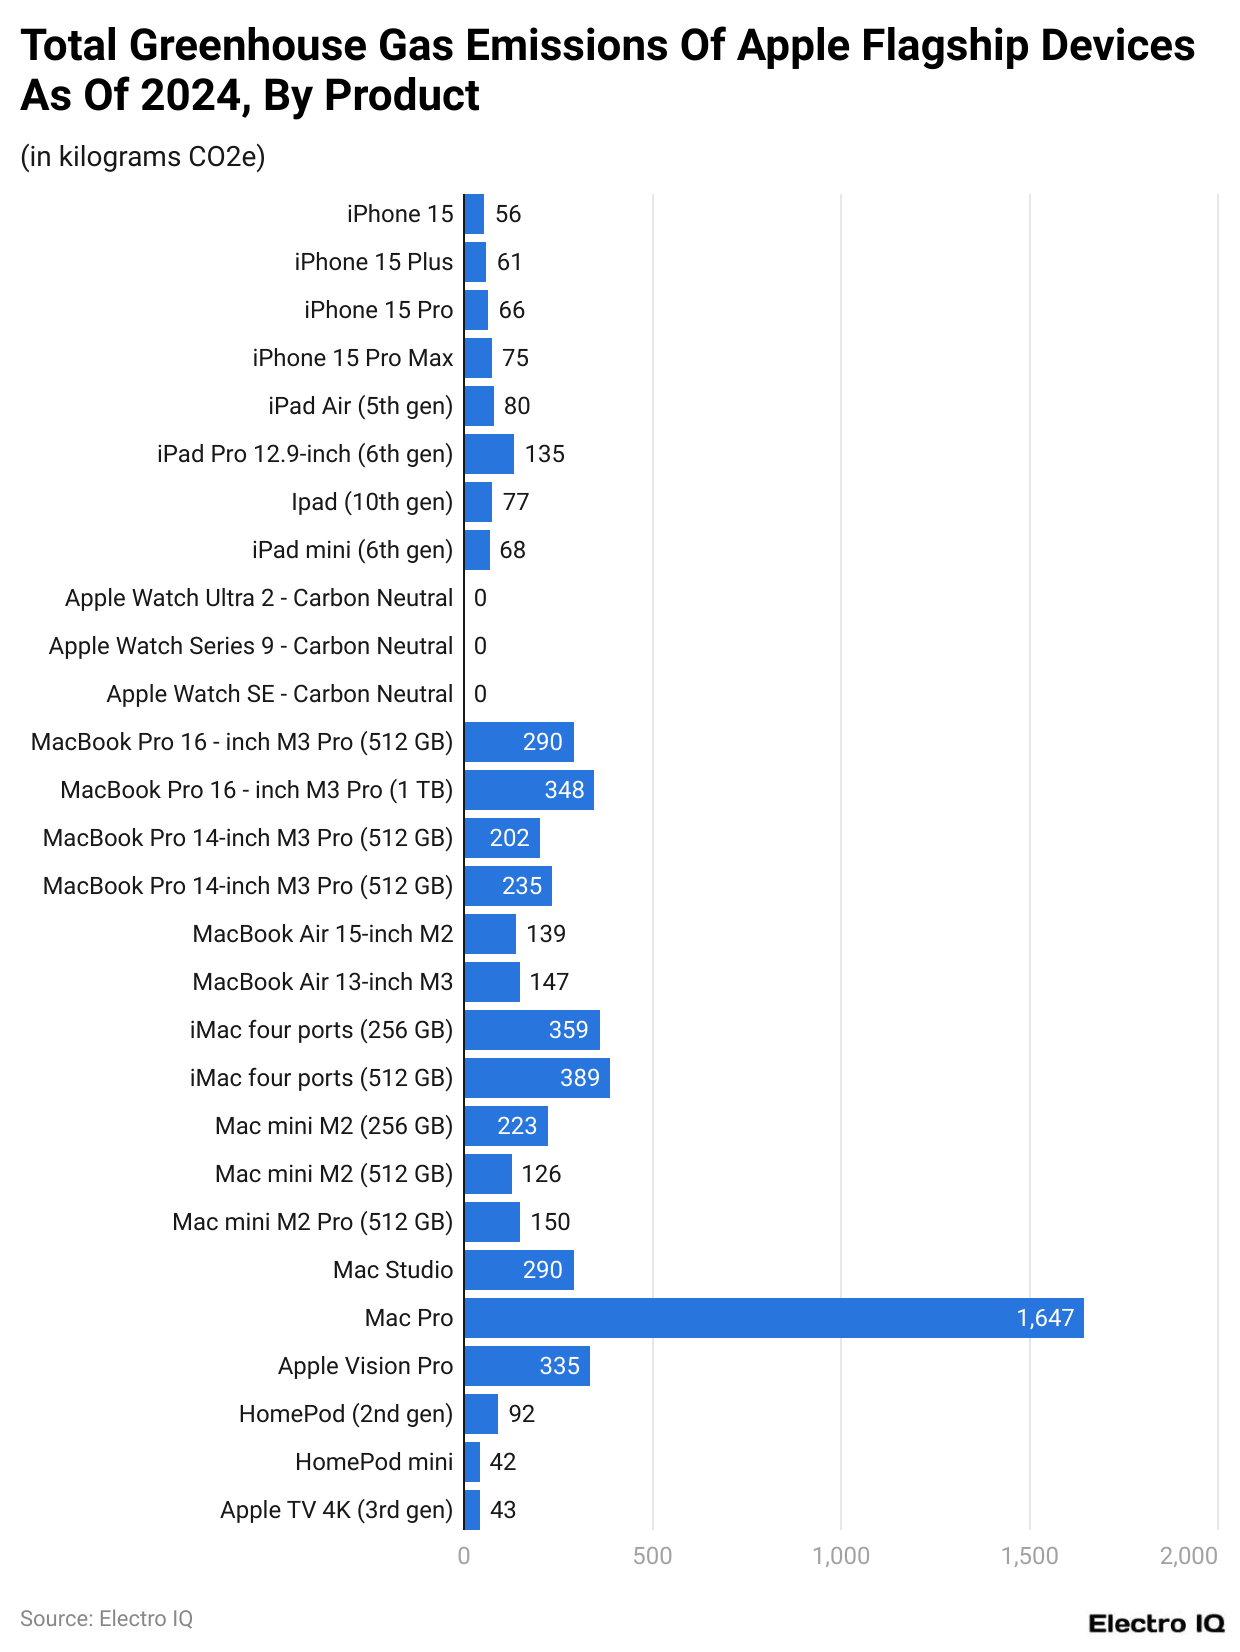
- Going through Apple statistics, one can see that there is a different amount of carbon emissions on each product, while the Mac Pro has the highest emission with 1,647 kg of C02 emissions it is followed by Mac Studio with 290 kg, Apple Watch Ultra 49 mm with 315 kg, Apple Watch Ultra 2 with 311 kg, MacBook Pro 16-inch M2 Max with 290 kg, MacBook Pro 16-inch M1 Max (512GB) with 248 kg, MacBook Pro 16-inch M1 Pro (512GB) with 202 kg, MacBook Pro 14-inch M1 Pro with 219 kg, MacBook Pro 14-inch M2 Max (512GB) with 275 kg, MacBook Pro 14-inch M2 Pro (512GB) with 175 kg, MacBook Air 15-inch M2 with 119 kg, MacBook Air 13-inch M2 with 147 kg, MacBook Air 13-inch M1 with 125 kg, iMac 24-inch M1 (512GB) with 159 kg, iMac five ports (512GB) with 389 kg, Mac mini M2 (512GB) with 233 kg, Mac mini M2 Pro (512GB) with 126 kg, Mac mini M1 (512GB) with 170 kg, MacBook Air 15-inch M2 with 119 kg, iPad Pro 12.9-inch (6th gen) with 115 kg, iPad Pro 11-inch (4th gen) with 72 kg, iPad Air (5th gen) with 75 kg, iPad (10th gen) with 72 kg, iPad mini (6th gen) with 65 kg, iPhone 15 with 56 kg, iPhone 15 Plus with 61 kg, iPhone 15 Pro with 66 kg, iPhone 15 Pro Max with 75 kg, HomePod (3rd gen) with 42 kg, HomePod mini with 13 kg, Apple TV 4K (3rd gen) with 48 kg, Apple Watch Series 9 with 0 kg, Apple Watch SE with 0 kg.
Apple Overview
- Apple has maintained its position as a leader in the technology industry, with impressive financial figures in 2023 and strong projections for 2024. Apple Statistics show that in 2023, the company’s revenue reached approximately $394 billion US dollars, reflecting a 5% increase compared to 2022. A significant portion of this revenue came from iPhone sales, which accounted for 52% of the total, generating over $200 billion US dollars.
- Apple’s services sector, which includes iCloud, Apple Music, and the App Store, also showed substantial growth in 2023. This division contributed around $80 billion US dollars, a 10% increase from the previous year. The rise in services revenue indicates Apple’s success in expanding its business beyond just hardware. This is an essential factor, as it adds a steady income stream through subscriptions and digital products.
- Looking ahead to 2024, Apple is expected to continue growing. Apple Statistics shows the company’s revenue is projected to surpass $410 billion US dollars. iPhone sales will likely increase by 3-4%, contributing to this growth. The services sector is also expected to continue its upward trend, with an estimated revenue of around $88 billion US dollars, marking a 9% rise compared to 2023. Additionally, wearable devices such as the Apple Watch and AirPods are forecast to generate about $45 billion US dollars in revenue.
- Apple has also seen significant international sales, with around 60% of its revenue in 2023 coming from markets outside the United States. China remains a key market, while Apple’s increasing focus on India as a manufacturing hub is expected also to drive growth in that region.
- In 2024, Apple is anticipated to release updated versions of its flagship products, including new iPhone models. The company is also exploring new technologies, such as augmented reality (AR), which could lead to new product categories. These innovations could further strengthen Apple’s position in the tech industry.
- In summary, Apple Statistics for 2023 and 2024 show that the company continues to grow, with solid performances in both hardware and services. This trend will likely continue as Apple expands its product offerings and global reach.
Conclusion
As a tech company, Apple has consistently become the market leader in the tech industry. The company’s impressive revenue of $383.29 billion in 2023 broadly demonstrates its dominance in the market. Apple’s global reach is evident, with international sales accounting for about 60% of its revenue.
If one refers to Apple statistics, one will find that America continues to be the most robust market. Still, Apple’s focus on emerging markets like India for manufacturing could drive future growth. The company’s foray into new technologies could open up new opportunities.
FAQ.
Apple’s revenue in 2023 was $383.29 billion.
The iPhone consistently generates Apple’s highest revenue.
Apple had 161,000 employees by the end of 2023.
The highest quarterly revenue was $123.95 billion in Q1 2022.
The Americas consistently contributes the highest revenue share for Apple.
Apple’s net income in 2023 was $96.99 billion.
iOS 17.0 had the highest market share, with 62.74% as of February 2024.
The iPhone 15 Pro Max had an adoption rate of 3.64% as of January 2024.
Apple’s R&D expenditure in 2023 was $29.92 billion.

Maitrayee Dey has a background in Electrical Engineering and has worked in various technical roles before transitioning to writing. Specializing in technology and Artificial Intelligence, she has served as an Academic Research Analyst and Freelance Writer, particularly focusing on education and healthcare in Australia. Maitrayee's lifelong passions for writing and painting led her to pursue a full-time writing career. She is also the creator of a cooking YouTube channel, where she shares her culinary adventures. At Smartphone Thoughts, Maitrayee brings her expertise in technology to provide in-depth smartphone reviews and app-related statistics, making complex topics easy to understand for all readers.


