Table of Contents
- Introduction
- Editor’s Choice
- Active Use By Google Apps
- User Demographics And Industry Usage
- Google Sheets Vs. Microsoft Excel – Feature Comparison
- Statistics On Collaboration And Sharing For Google Sheets
- Google Sheets Consumption In The Education Sector
- Pilot Evaluation Of Using Google Sheets In The Classroom
- Google Sheets Add-Ons For Reporting And Analysis
- Using Statistical Add-Ons For Advanced Analysis
- Quick Way To Do Data Analysis With Google Sheets
- Recent Developments And Feature Updates
- Conclusion
Introduction
Google Sheets Statistics: By the end of 2025, Google Sheets will have evolved beyond a cloud-based spreadsheet. It has become a data hub, a collaborative platform, and an analytics engine used worldwide. This includes professionals, students, businesses, and companies. Initially, because Microsoft Excel was ubiquitous on desktops, Google Sheets was considered a lesser tool. However, it is now a significant part of daily activities, whether finance teams working with monthly figures, teachers recording student performance, or marketing teams developing dashboards.
The report you are about to read is detailed, providing key 2025 figures on usage, collaborative work, market dynamics, and economic impacts. These include the successful financial performance and industry rankings.
Editor’s Choice
- The total number of Google Sheets users worldwide in 2025 reached 1.1 billion, a 12% increase from the previous year.
- For teamwork and collaborative tasks, 56% of users worldwide prefer Google Sheets to Microsoft Excel.
- In the U.S., 85% of startups and 61% of small businesses consider Google Sheets their primary spreadsheet tool.
- Google Workspace welcomed its 10 millionth paying business customer, thus ensuring that Sheets is a well-known product in medium and large companies.
- At least one department in 44% of Fortune 500 companies uses Google Sheets.
- The fact that 74% of Gen Z professionals use Google Sheets every day is a strong indicator of how important this tool is in today’s cloud-centric work environment.
- Sheets adoption grew considerably in the new markets, the education sector in Asia-Pacific registering an 18% and Latin America a 22% increase, respectively.
- The mobile version of Google Sheets has surpassed 600 million downloads for Android, which signifies a strong and continuous use of the mobile version app.
- The age group 25-34 years dominates the user profile with the percentage of 38% while the rest 61% consider themselves as having medium to high-level skills.
- The technology and IT sector had the largest share of Google Sheets users, at 27%, with education trailing closely at 22%.
- Two-thirds of freelancers rely on Sheets as their primary tool for managing data.
- Google Sheets can be connected with more than 120 different external applications, such as CRM systems, project management tools, and marketing platforms.
- Worldwide usage of the Google Sheets API exceeded 900 million monthly hits, underscoring its standing as a data backbone.
- Sharing is the mainstay of Sheets usage, with 87% of users working on joint spreadsheets every week.
- Offline and hybrid teams cannot do without Sheets—54% use it to monitor project progress.
- In public education in the U.S., Google Sheets is used by 55% of schools, whereas 66% of secondary and high schools use it for grading purposes.
- The use of Google Forms and Sheets for conducting student surveys is at 87%.
- According to pilot studies, 82% of teachers consider Sheets very effective at engaging students.
- Student collaboration scores increased by 19%, and the assignment completion rate rose by 22% when Sheets was used alongside other Google tools.
- In the Google Workspace Marketplace, there are more than 520 add-ons for Sheets that include reporting and analytics tools, which are among the most sought after.
Active Use By Google Apps
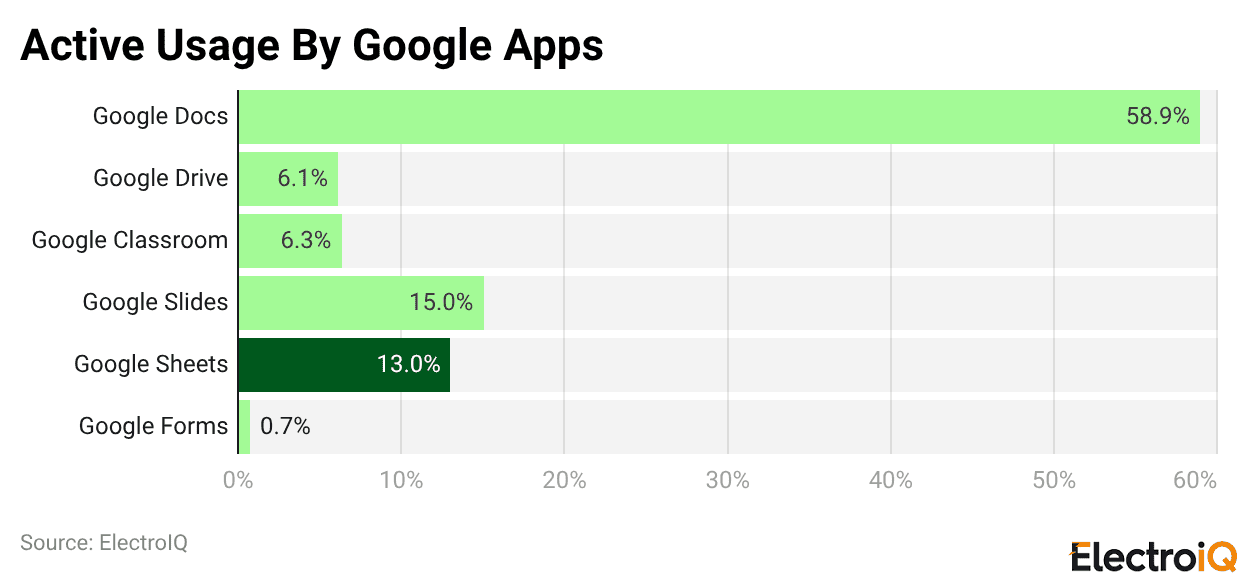
- According to statistics, Google Docs is the most popular application in Google Workspace, with a usage share of 58.9%.
- The application is the primary tool for writing, sharing, and editing documents, both in companies and in schools.
- Google Slides is next, with a much smaller usage share of 15%, which still underscores the app’s reliance for visual communication, including training materials, presentations, and more.
- Google Sheets comes third with support from 13% of the users, which shows that the app is utilized regularly for tasks like entering data, analysis, and basic computations, especially in educational institutions and businesses.
- Then there’s Google Classroom, which accounts for 6.3% of active usage, underscoring its continued importance for managing assignments, coordinating coursework, and organising group activities, especially in schools.
- The same goes for Google Drive, which is right behind it with a 6.1% share, indicating that although file storage and sharing may not be the most attractive, they are still part of daily operations that support other applications.
- On the contrary, Google Forms appears to be the least used app, with only 0.7% of users reporting its use, suggesting that activities such as form creation, surveying, and data collection are limited in scope or typically occasional rather than daily workflows.
User Demographics And Industry Usage
- In 2025, Google Sheets is used most by professionals aged 25-34, who account for 38% of the application’s total users.
- A large majority (61%) of users rate themselves as having intermediate to advanced spreadsheet skills, indicating they use the app as professionals rather than for occasional basic tasks.
- The tech and IT industry has the largest share of adoption, at 27% of total usage, while the educational sector is not far behind, at 22%, driven by extensive use in schools and universities.
- Using the platform is a standard operating procedure for freelancers, and an over-the-top 68% of them have chosen Google Sheets as their main data management tool.
- Nonprofit organizations are also very active in this area, and 43% of them are utilizing Sheets to manage their donations and report on grants.
- In the marketing segment, 35% of professionals now use Google Sheets instead of Excel, primarily due to its collaborative features.
- Growth across specific industries is also notable, with the real estate sector seeing a 19% increase in usage over the previous year.
- Finance and accounting teams are more in favour of Sheets for real-time dashboards that account for 31% of their reporting workflow.
- Remote workers use Sheets more consistently than their office-based counterparts, and their weekly activity is, on average, 22% higher.
Google Sheets Vs. Microsoft Excel – Feature Comparison
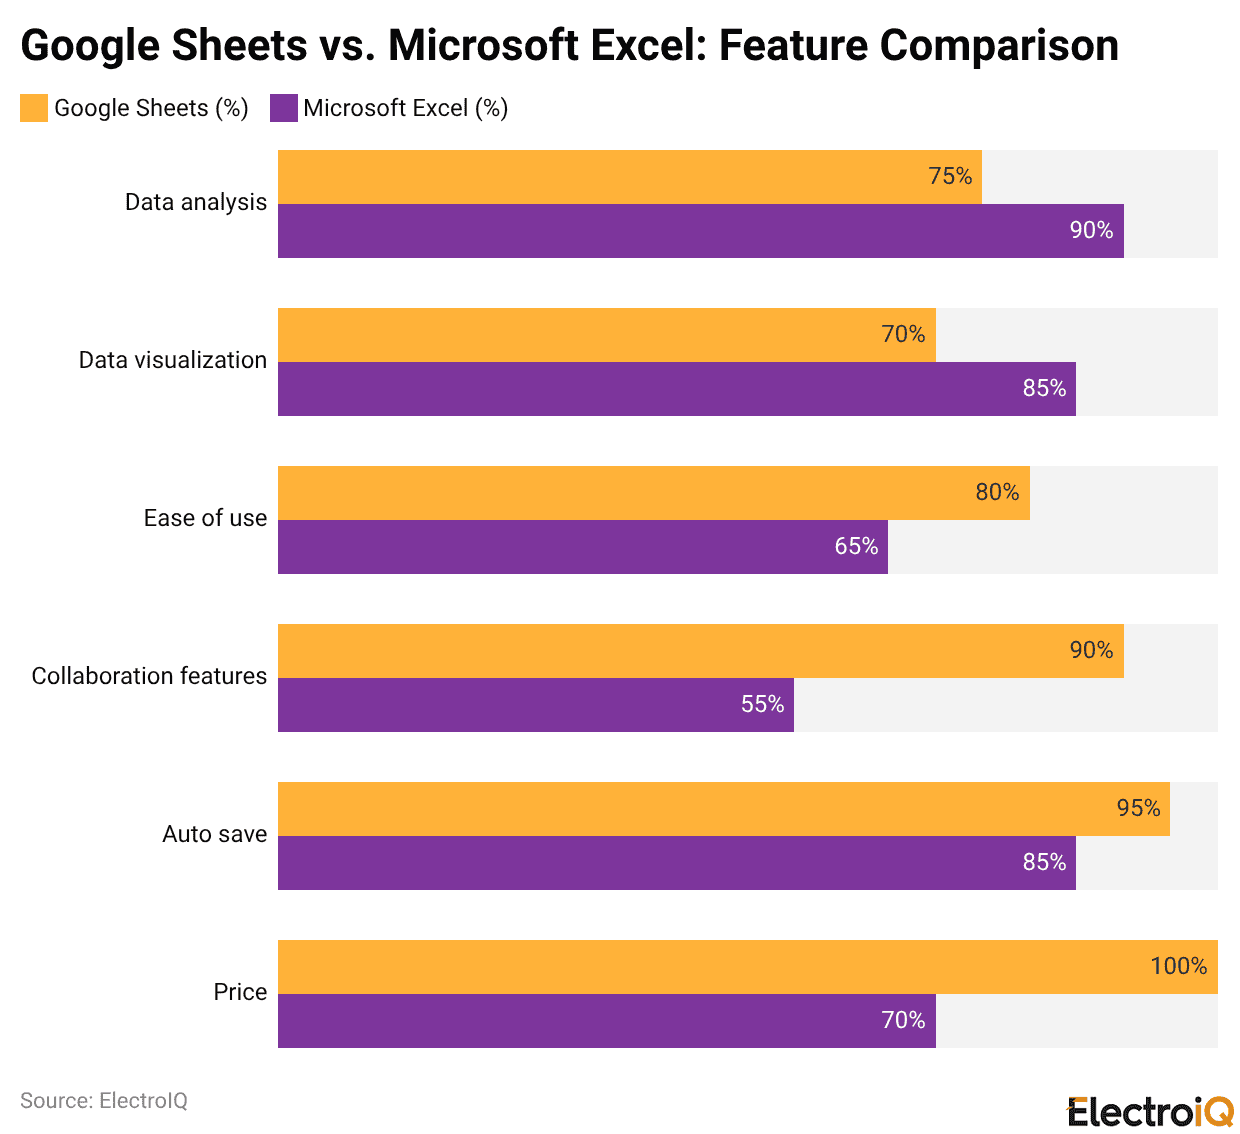
- The comparison clearly delineates the strengths of both spreadsheet tools, based on their usage.
- For analysing advanced data, Microsoft Excel remains the preferred tool, accounting for 90% of the credit; its powerful formulas, pivot tables, and analytical capabilities are key.
- It also outperforms Google Sheets in data visualisation, earning a score of 85% compared to Sheets’ 70%, attributable to its wider range of charting options and customisation features.
- On the other hand, Google Sheets excels in usability and collaboration.
- It receives an 80% rating for ease of use, which makes it more user-friendly than everyday users while Excel is locked at 65%.
- By contrast, collaboration is the area where Sheets clearly outperforms Excel, achieving a 90% rating compared with Excel’s 55%, largely because it allows simultaneous editing by multiple users without risking multiple versions of the same document.
- Automatic saving is another feature in which Google Sheets prevails, scoring 95%, which minimizes the likelihood of data loss when compared to Excel, which has an 85% rating.
- With a perfect score of 100%, it indicates that Sheets is free for single users and also part of low-cost Google Workspace plans, whereas Excel, scoring 70% often needs a paid Microsoft 365 subscription.
Statistics On Collaboration And Sharing For Google Sheets
- Collaboration is a strong point of Google Sheets; 87% of its users work on at least one shared document every week.
- Teamwork on documents has been increasing regularly; the average now includes 4.3 collaborators per Sheet, up from 3.1 in 2022.
- Real-time interaction is widely used: 92% of businesses use Sheets to enable commenting for faster feedback and decision-making.
- In large companies, collaboration typically involves multiple teams. In companies with over 500 employees, 70% of shared spreadsheets include multiple departments.
- On a global scale, Google Sheets documents are shared in Google Workspace more than 2 billion times per month.
- Controlled access is also in place, as “comment-only” permissions are set for 17% of shared links to prevent direct edits.
- Remote and hybrid teams are highly dependent on Sheets, with 54% using it as their primary tool for project tracking.
- To control changes and keep people accountable, 29% of users check the version history monthly, and Google has increased concurrent editing to support up to 100 users per document in 2025.
- In the education sector, collaboration is especially evident, with 82% of students and teachers using Sheets for group projects and lab reporting.
- The use of external collaboration continues to rise, and the documents that are shared outside an organization’s domain increased by 14% year over year in 2025.
- The functional teams also benefit from shared workflows, with 47% of HR professionals using Sheets to manage the interview schedule.
- The integrations also improve collaboration, with 28% of users who collaborate connecting Sheets to platforms such as Slack and Microsoft Teams.
- From the point of view of administration, 64% of Google Workspace admins are changing Sheets sharing permissions every week, while 36% of the users are applying conditional formatting to make the roles and responsibilities within the teams clearer and more divided.
Google Sheets Consumption In The Education Sector
- Google Sheets is widely used in the U.S. education system, with more than 55% of public schools actively using it through Google Workspace for Education.
- In districts where students use Chromebooks, Sheets is part of the basic instructional resources in 43% of cases.
- Classroom data collection is increasingly digital, with the joint use of Google Forms and Sheets accounting for 87% of student surveys.
- Teachers are the primary users of Sheets for academic administration; an estimated 66% of middle and high schools use it to maintain gradebooks.
- Apart from regular classrooms, special use cases are also increasing. About one in every four U.S. schools is now relying on Sheets for managing Individualized Education Program (IEP) paperwork in the context of special education.
- In the higher education sector, collaborative research is the primary driver, with more than 70% of university group studies using Google Sheets for data collection.
- The scope of formal training has also expanded, with more than 800 universities worldwide implementing Sheets modules in their student and staff onboarding programs.
- Moreover, the integration with Google Classroom has played a major role in raising the adoption level, thus leading to a 21% growth in assignments centered around Sheets on a yearly basis.
- Moreover, high schools’ data visualization projects using Sheets went up by 34% in 2025, which is an indication of the software’s growing role in the data literacy education process.
Pilot Evaluation Of Using Google Sheets In The Classroom
- Pilot programs conducted in more than 300 U.S. schools demonstrated a significant educational impact from using Google Sheets.
- In these investigations, 82% of teachers rated Sheets as “very effective” in increasing student engagement.
- Students in group assignments using Sheets showed a 19% increase in collaboration performance, while classrooms that combined Sheets with Forms and Slides saw a 22% increase in assignment completion rates.
- The teachers had great time savings too, which was about 3.4 hours weekly, by employing Sheets in grading, tracking attendance, and reporting.
- Additionally, advanced use is evident: 12% of classrooms are using Google Apps Script with Sheets to automatically prepare weekly performance summaries.
- In the math education sector, 61% of participating high school teachers used Google Sheets to teach functions and equations.
- Among students, there were noticeable gains in confidence: 80% reported being more comfortable using spreadsheets for STEM-related tasks.
- The real-time dashboards created in Sheets made students 47% more aware of their academic progress, and automated reporting workflows increased parent-teacher communication frequency and effectiveness by 2x compared to traditional methods.
Google Sheets Add-Ons For Reporting And Analysis
- In 2025, the Google Workspace Marketplace will host over 520 certified add-ons for Google Sheets, marking an expansion of the platform ecosystem.
- Supermetrics, Power Tools, and Coupler.io are among the most widely downloaded reporting-focused extensions.
- Marketing and eCommerce are the segments where users really love the tools—61% of the Sheets users say they cannot do without at least one analytics add-on weekly.
- Overall use of automated reporting add-ons increased by 29%, indicating a growing need for efficient data workflows.
- The finance and accounting departments are the major areas where advanced analytics, and hence add-on installations, are taking over.
- The Google Analytics add-on remains the leading reporting tool, with around 4.3 million active users.
- 27% of online retailers use data export add-ons that integrate Sheets with e-commerce platforms such as Shopify, HubSpot, and Stripe.
- HR departments are also relying more and more on add-ons; payroll and leave management usage increased by 18%.
- The academic community and survey-based research are using the Pivot Table Helper add-on, which saw a 21% increase in usage.
- Tools that support real-time data refresh and scheduled reporting saw the highest growth, adding 36% more active users in 2025.
Using Statistical Add-Ons For Advanced Analysis
- Statistical add-ons such as Solver, XLMiner, and BigML are increasingly used to power even the most demanding analytical work in Google Sheets.
- In 2025, 28% of power users indicated using such tools for regression analysis, forecasting, and predictive modelling.
- Time series analysis became another area of focus as forecasting-oriented add-ons grew by 17% in the last year.
- Machine learning integrations in Sheets have increased by 31% mainly due to the adoption of data science and analytics education.
- In regulated sectors, Sheets is used for more advanced modelling, with logistic regression appearing in 12% of healthcare and insurance organization spreadsheets.
- Tools focused on compliance are also in more demand as the use of data anonymization add-ons has risen by 23% to assist in meeting GDPR requirements.
- Market researchers rely on statistical add-ons in about 40% of their projects, while 26% of mid-market SaaS companies keep A/B testing data in Sheets.
- Furthermore, quality control and manufacturing teams are increasingly using anomaly detection tools, with 19% relying on these add-ons to identify inconsistencies and quality issues.
Quick Way To Do Data Analysis With Google Sheets
- Google Sheets is making data analysis even simpler by using built-in intelligence and automation.
- The Explore feature is now the go-to for 57% of users who want to discover patterns, insights, and visualizations without writing formulas.
- Functions like SUM, COUNTIF, and AVERAGE are auto-suggested correctly in 90% of edits, thereby minimizing manual effort.
- Smart fill and intelligent suggestions are primarily responsible for improved user productivity, with an average of 2.6 hours per week saved on repetitive data tasks.
- Dashboard creation has also become faster, with 39% of dashboards in 2025 employing filter views and slicers for interactive analysis.
- There was a 26% increase in the use of advanced QUERY and IMPORT functions, particularly among power users handling external or complex datasets.
- Many data analysts now regard Sheets as the quickest tool to learn for junior professionals, with a 60% onboarding success rate in the first month.
- The ready-made templates for cohort analysis, funnel tracking, and financial modeling have experienced a 42% increase in downloads, which is an indication of the market’s preference for easily accessible analytical frameworks.
- The integration of BigQuery and other platforms in real-time allows the analysis of datasets with a maximum of one million rows in no time, while 18% of project dashboards are currently utilizing conditional chart logic to provide dynamic visual insights.
Recent Developments And Feature Updates
- Google made several significant changes to Sheets in 2025 to make it faster, smarter, and more collaborative.
- Smart Fill 2.0 was launched in March 2025, and its accuracy was improved by 31%.
- Duet AI integration now enables users to generate formulas, interpret calculations, and automate workflows using natural language requirements, making advanced analysis easier.
- New checkbox functionality allows rules and linked formatting to be used conditionally, and 17% of the user base has implemented it to monitor progress.
- Users of the timeline view, which supports colour-coded grouping and collapsible task rows, now represent 24% of product managers.
- Grouping and collapsible row sections, rolled out in early 2025, are already being utilised in 38% of newly launched templates.
- Enterprise and developer-centric updates have gained popularity among users. 11% of corporate accounts utilise data classification labels such as “Confidential” or “Internal” to facilitate governance. Setting expiration dates on protected ranges is one of the methods HR departments use to control access during onboarding.
- The upgraded Apps Script platform, which incorporates a debugger and a log viewer, has now become the choice of development teams for 21%.
- One of the performance enhancers is spreadsheets with more than 200,000 rows, loading up to 20% faster, and offline sync reliability is up 43%.
Conclusion
Google Sheets Statistics: By 2025, Google Sheets will undoubtedly be one of the main components of modern productivity tools. This is quite a long way from being just a spreadsheet. With more than a billion users, including strong adoption in business, education, and enterprise sectors, Sheets has become a central hub for collaboration, automation, and data-driven decision-making.
Its superior position in real-time collaboration, affordability, and user-friendliness continues to attract startups, educators, and remote teams. Meanwhile, advanced add-ons and automation features open up new horizons for data analysis. As digital-first workflows accelerate, Google Sheets is positioned as a scalable, accessible, and future-ready analytics platform.