Twitter Users Statistics By Audience Ad Revenue and Facts (2026)
Updated · Mar 14, 2026


Table of Contents
- Introduction
- Editor’s Choice
- Global Twitter (X) Ad Revenue
- X/Twitter Distribution of Global Users By Violation
- Twitter (X) Global Audience By Age And Gender
- Twitter (X) Distribution of Users By Leading Country
- Twitter’s Most Popular User Account
- Twitter Usage By Industry And Profession
- Twitter User Engagement Rate Per Tweet
- Retention And Churn Rates of Twitter Users
- Twitter User Advertising Reach And Engagement
- Twitter User Behavior During Major Events And News Cycles
- Conclusion
Introduction
Twitter Users Statistics: In 2025, the social media platform that was once widely called Twitter and now carries the brand name X is still very much one of the hottest places for instantaneous digital communication, mixing up politics, money, entertainers, and even sometimes unnoticed social movements. Nearly two decades after its birth in 2006, X is still one of the determinants of the global conversation — though it is already amidst new rivals like Meta’s Threads and bringing up options like Bluesky, which is decentralized.
This in-depth article is a great resource for marketers, researchers, and tech lovers, as it uncovers the latest approved Twitter users statistics, monetization trends, user demographics, and forecasts for 2025.
Editor’s Choice
- Twitter’s ad revenue peaked at USD 4.51 billion in 2021, then declined for several years due to advertisers pulling back and uncertainty around the platform.
- The monthly retention rate increased to 72.6% in 2025, a sign of stronger attachment among Twitter users.
- Twitter Blue users show strong loyalty, with an 82% retention rate.
- Abuse and harassment accounted for over one-third of user reports in 2024, underscoring the safety problems facing the platform.
- The platform, therefore, faced significant moderation pressure, as nearly 30% of reports were related to hate speech.
- The largest group of users is men aged 25–34, who make up 22.4% of the total Twitter population.
- The US is still the country with the largest number of Twitter users, which was over 106 million as of April 2024.
- Twitter has a global ad reach of 545 million users, which means that advertisers can still obtain a large pool of customers.
- The average click-through rate for ads hit 1.39%, and LinkedIn quietly ran in the background.
- Video ad engagement is 2.6 times that of image-based formats.
- Sports content has the highest engagement at 0.072%, which is way above the platform average.
Global Twitter (X) Ad Revenue
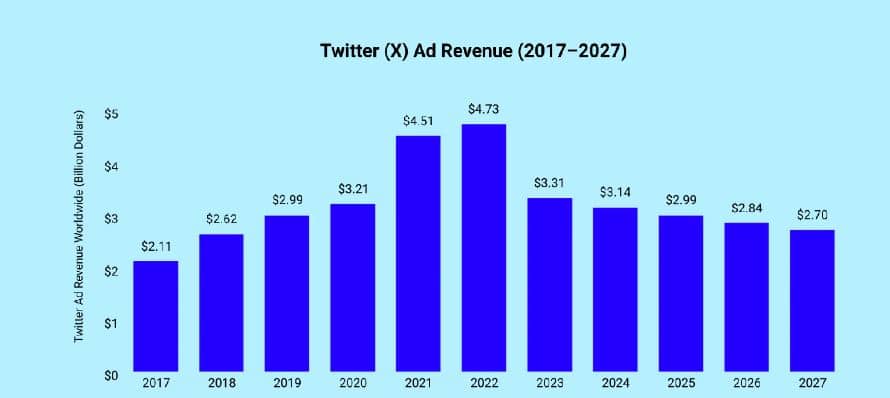
(Source: oberlo.com)
- The trajectory of Twitter’s (now X) advertising revenue reveals an initial period of success followed by increasing pressure from structural issues.
- The years 2017-2019 saw the platform make a strong case for its monetization capability, with advertising revenue going up from USD 2.11 billion to USD 2.99 billion, thanks to user growth and increased trust from advertisers.
- The momentum into 2020 continued but at slowly diminishing rates, signalling the maturity of the advertising business rather than demand weakening.
- The actual turning point was in 2021 when ad revenue reached USD 4.51 billion, boosted by digital ad spending and an upsurge of Twitter user interactions during the global pandemic. Unluckily, this summit was not easy to hold on to.
- In 2022, the revenue growth rate decreased to 4.9%, indicating early signs of advertiser restraint, despite stable engagement among Twitter users.
- Twitter underwent leadership transitions, modified its regulations, and the slowdown in the advertising market all contributed to the erosion of brand trust, despite users still logging in. The negatives of 2024 and the forecast of declines till 2027 reek of intense competition.
X/Twitter Distribution of Global Users By Violation
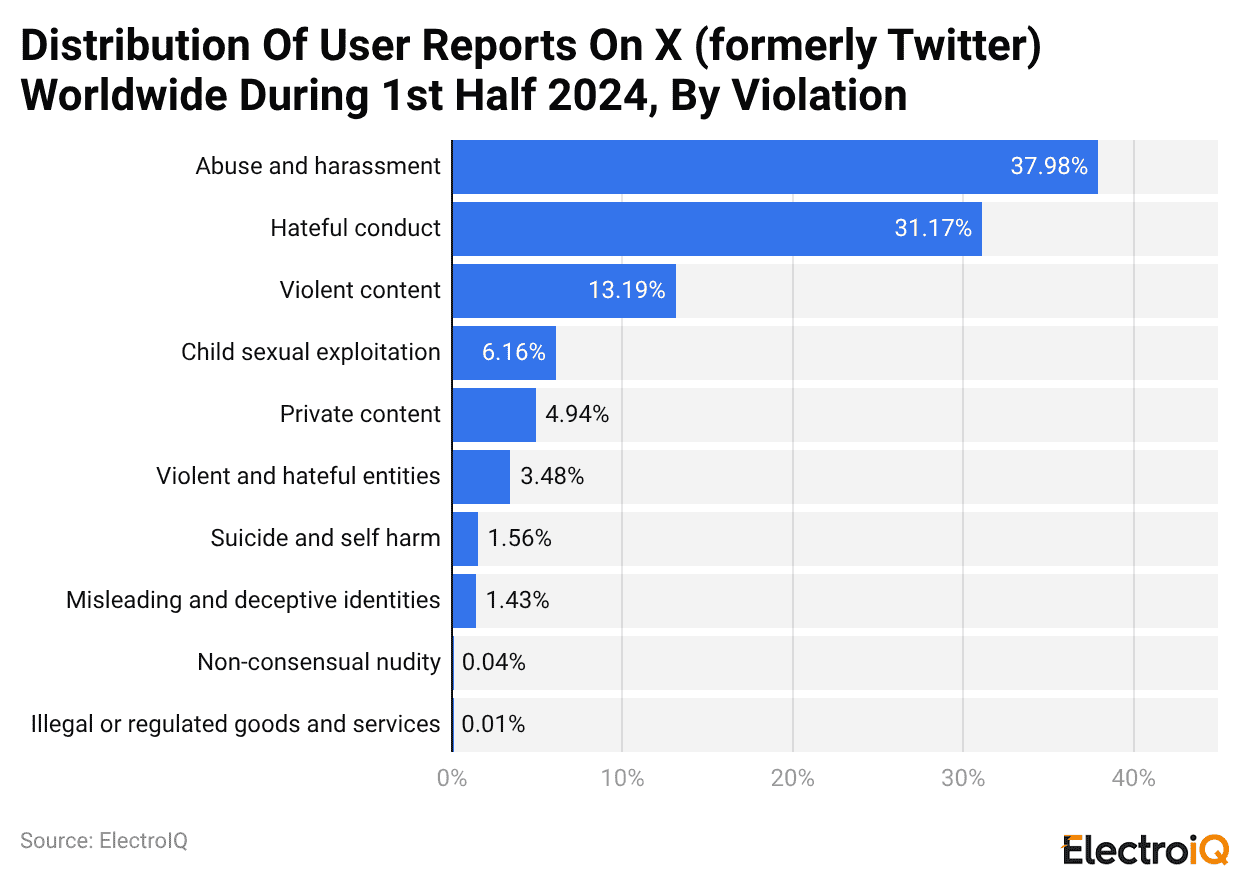
(Reference: statista.com)
- The user report volume and structure on X during the first half of 2024 as a pointer to the existence of safety and trust issues.
- The major cause of user complaints is abuse and harassment, accounting for over 33% of total reports filed, underscoring that daily negative user interaction remains a major frustration for Twitter.
- The reports relating to hate speech, which are nearly 30% in number, indicate serious issues that have not been fixed concerning harmful and polarizing discourse.
- The reports about violence that make up 17% of the total further point to the fact that there are still gaps in the areas of moderation.
- The security of Twitter users and the improvement of the platform’s governance are the major steps before restoring user trust and achieving long-term stability.
Twitter (X) Global Audience By Age And Gender
(Reference: statista.com)
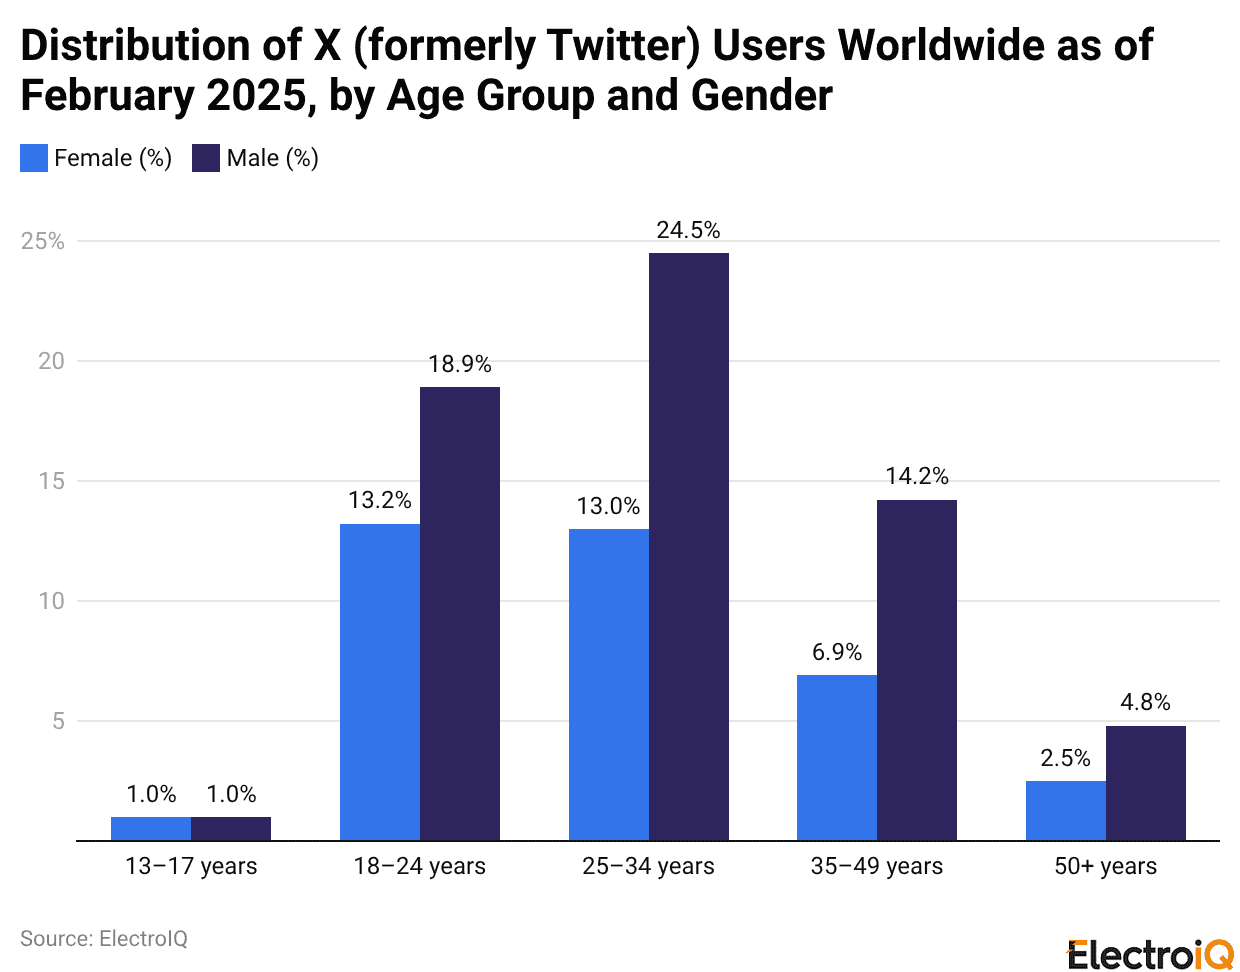
- The demographic statistics for January 2024 present a very male-dominated audience on X.
- Men aged 25 to 34 make up 22.4% of the platform’s total users; thus, they are the largest demographic group on Twitter.
- Almost 20% of users are men aged 18 to 24, which is very close to the number in the 25 to 34 age group, further confirming that the platform is very popular among young adult males.
- The above situation indicates that users on X are more involved in news, debate, and live commentary, a characteristic typical of the age group associated with them. Compared to competing sites, X’s male dominance is very much apparent.
Twitter (X) Distribution of Users By Leading Country
(Reference: statista.com)
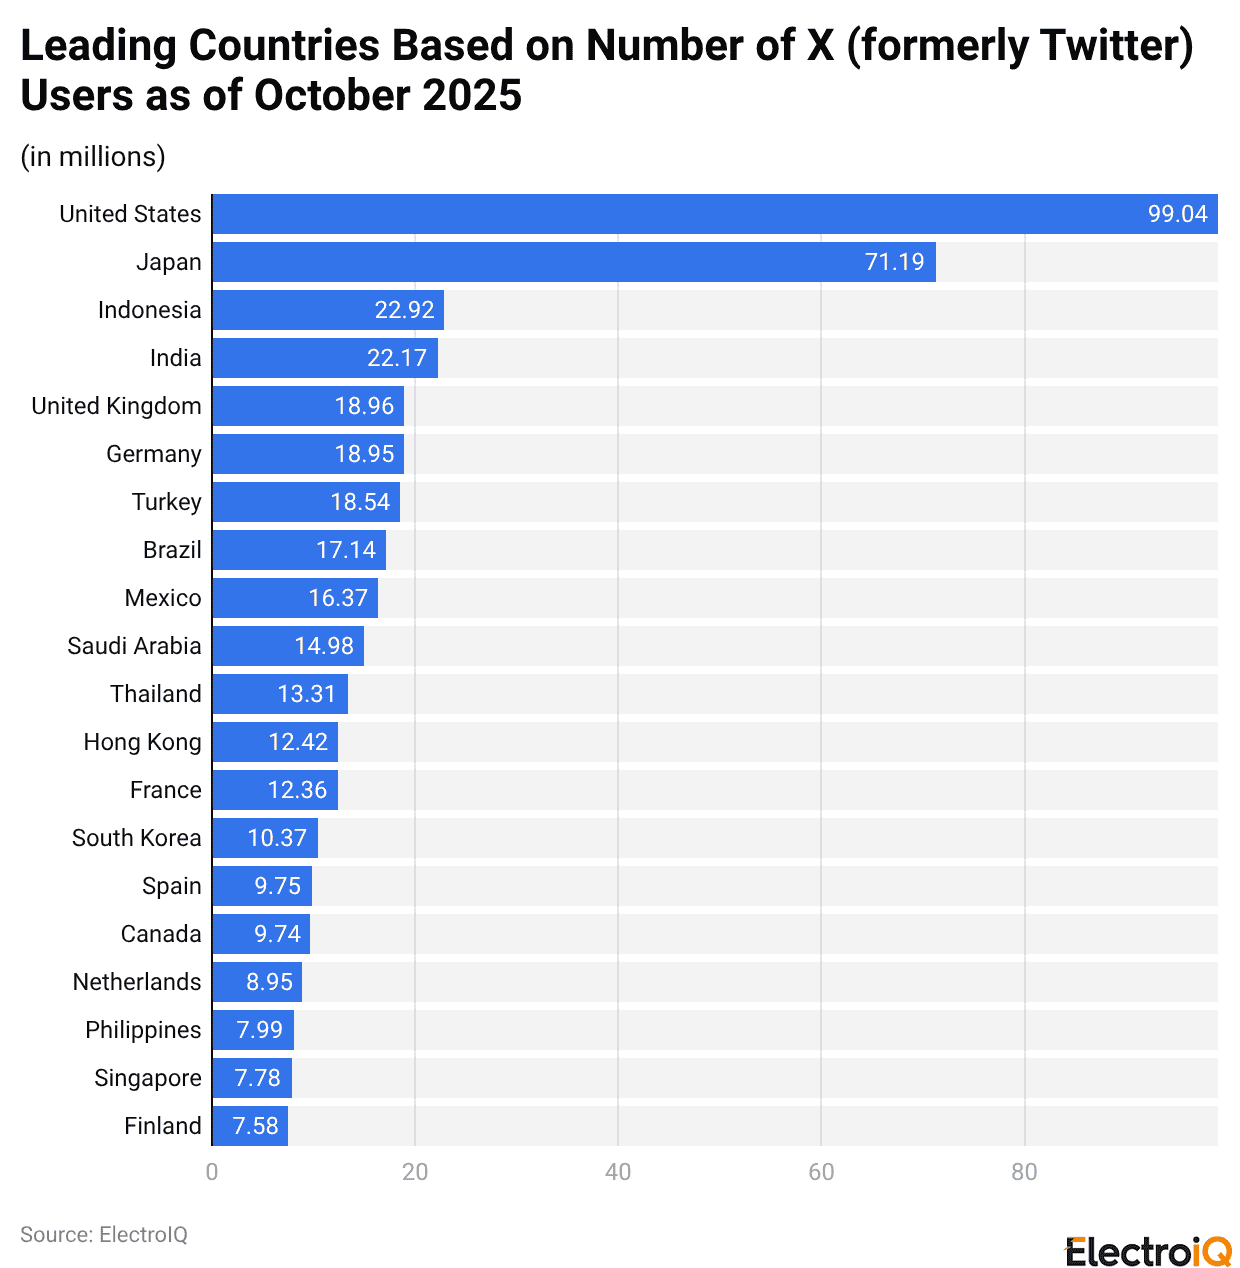
- According to a Statista report, X still has a very big and very strategically important global presence.
- By the end of April 2024, there will be around 106.23 million Twitter users in the USA alone. This figure shows that the platform remains strong, even though the market has faced some turbulence.
- With about 69 million, Japan is the second largest user country, followed by India, which adds about 25 million. This trend indicates that X remains a worldwide network, both distributed and regionally influential.
- On a larger scale, the company reported 206 million daily active users who could be monetized during Q2 of 2021, showing its enduring power to engage and turn that into revenue.
- Prominent voices, such as Musk, Obama, and others, have attracted large crowds to the platform, turning it into a real-time barometer of public opinion.
- Governments and foreign ministries have also made their presence known on the social media platform and adopted it as their direct line to the public for communicating policy announcements and messages, thus appearing to be in control of the situation.
- The case of Trump is a good example of the impact of social media; his heavy tweeting triggered a worldwide debate, and according to a 2018 survey, 61% of participants considered his tweets inappropriate.
Twitter’s Most Popular User Account
(Reference: backlinko.com)
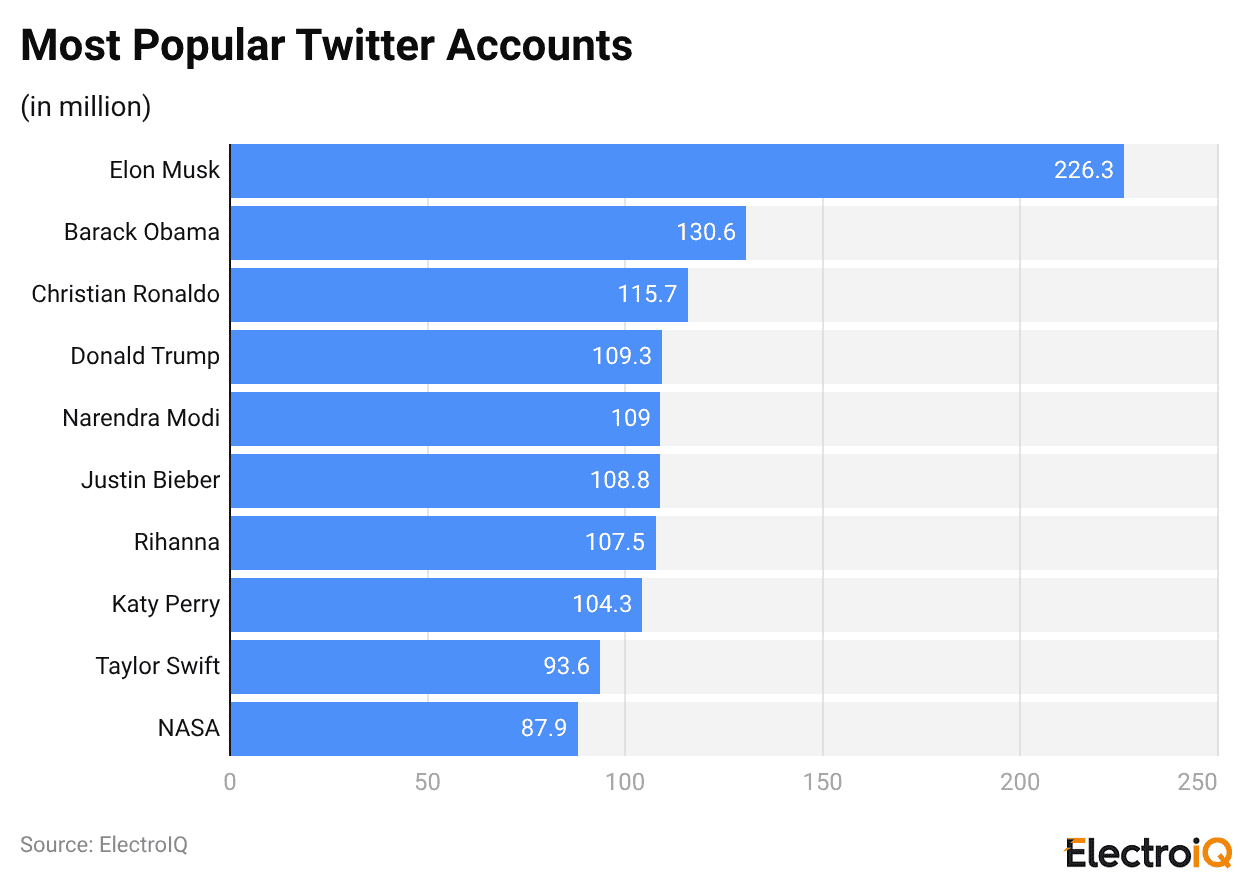
- Currently, the most-followed accounts on X suggest that the platform’s power is influenced by a combination of leadership, celebrity, and institutional credibility.
- Elon Musk’s massive following of more than 226 million followers indicates that Twitter users are drawn to real-time commentators who shape technology and media.
- The top accounts mirror users’ preference for using Twitter as a platform for political narratives, policy signals, and public debate among the major political leaders – Barack Obama, Donald Trump, and Narendra Modi.
- Middle-ranking entertainment stars like Cristiano Ronaldo, Justin Bieber, Rihanna, Katy Perry, and Taylor Swift demonstrate that engagement from fans contributes to their enormous followings, as Twitter users are the ones who echo music, sports, and pop culture.
- NASA’s position in the top ten is particularly significant as it shows that Twitter users are also drawn to the educational, science-driven storytelling when it comes to being done in an accessible, real-time format.
Twitter Usage By Industry And Profession
- Twitter’s professional landscape in 2025 illustrates how deeply the platform is entrenched in real-time knowledge sharing and influence-building.
- Journalists are the core of the ecosystem, with 61% of Twitter users being daily users, which is why Twitter users continue to associate the platform with the latest news and public discourse.
- The large number of tech professionals, who make up 13.4% of verified accounts, is another indicator of Twitter’s continued relevance in shaping discussions on innovation, AI, and emerging technologies.
- Education and academia, accounting for 9.6% of the most-followed accounts, indicate that Twitter users are increasingly looking to the platform for expert commentary rather than only for entertainment.
- The healthcare sector has also raised its profile, with 21% more doctors and public health workers using Twitter mainly for health-related updates and campaigns.
- Marketers, on the other hand, have become the ones who spend the most time on Twitter, 44 minutes daily on average, which is a clear indication of how the users see the platform mainly for following trends and interacting with brands.
- The global expansion of more than 210,000 government accounts illustrates that Twitter is a digital town hall, while lawyers and legal advisors gradually employ it for professional visibility.
- The entertainment, Web3, and startup communities, among others, are the main contributors to the diversification of Twitter users, thus making the platform a cross-industry nerve center rather than a single-purpose social network.
Twitter User Engagement Rate Per Tweet
(Source: notta.ai)
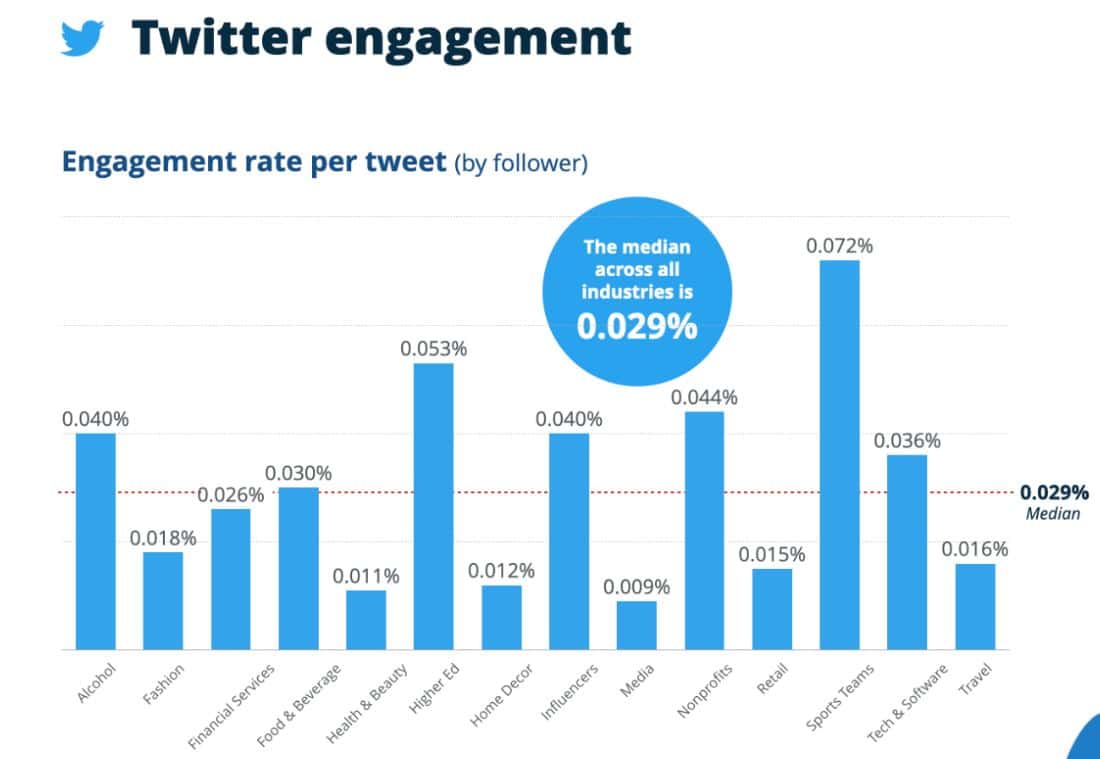
- According to the Notta.ai report, it is evident that Twitter users across industries have varied ways of interacting with content, which, in turn, is probably a reflection of emotional relevance and industry dynamics.
- The median engagement rate of 0.029% is far from impressive, but it still marks the point at which the competition for users’ attention on the platform has reached an extremely high level.
- Sport teams’ 0.072% engagement rate has put them on top of the chart, and they are showing that live moments, fans, and quick reactions are the factors that attract the most Twitter users.
- The engagement of 0.053% in higher education reflects the participation of the intellectually curious, who are creating academic, cultural, and social communication through discussions, debates, and happenings.
- In the meantime, nonprofits, influencers, and alcohol brands are all outperforming the median by offering new content that reflects the storytelling, authenticity, and identity themes around which Twitter users’ conversations and sharing activities revolve.
- Manual engagement practices are evident in the case of media and health & beauty, where the former has already lost the battle for the attention of busy Twitter users, while the latter is simply not mattering with its less time-sensitive content.
- Data in general indicates that for the users of Twitter, the qualities of immediacy, emotion, and relevance have been winning consistently over mere industry size.
Retention And Churn Rates of Twitter Users
- The most recent data regarding retention and churn rates indicate that the ecosystem with Twitter users is stabilizing, but at the same time, getting more and more segmented.
- Monthly retention rising to 72.6% is a sign of the platform’s renewed stickiness, while the 38.2% figure of the 90-day retention of new sign-ups is a mark of the strongest onboarding performance since the year 2021.
- The premium-like behavior is, however, much more resilient—Twitter Blue subscribers exhibit a remarkable 82% retention, which justifies the idea that the features of paid services play a crucial part in anchoring the committed Twitter users.
- The users who tweet every day have a very high retention rate, and users who make threads have a significantly lower turnover rate compared to those who post in single tweets. This indicates that the platform is favouring long, creative narratives.
- The interaction factors also determine the results: it is more than three times as likely that a user following 20 or more accounts will be active, and, on the other hand, Twitter notifications will improve early retention by 31%.
- Accounts with little activity and bots still play a role in the process of preventing users from staying, and the unstable political situation in some countries continues to be a factor in low retention there.
Twitter User Advertising Reach And Engagement
- These advertising metrics remind us of Twitter’s staying power as a globally appreciated, high-impact, real-time marketing channel for its users.
- The platform’s large ad reach of 545 million users indicates that it also allows advertisers to achieve broad international exposure while remaining efficient.
- The average click-through rate of 1.39% puts Twitter ahead of LinkedIn and puts it on par with Facebook, indicating that active Twitter users have strong engagement.
- Video is the clear winner in performance, putting static ads to shame by 2.6 times, especially when it happens to be on the same feed as live moments. This is further supported by the 3.4-fold increase in engagement during major sports and news events, when Twitter users are most active and emotionally involved.
- On the other hand, lowering CPC to USD 0.62 makes the cost more efficient, encouraging advertisers even more, despite premium options like Promoted Trends that require a six-figure daily investment.
- Sponsored content based on threads is also becoming popular, providing 17% more interaction than single-tweet ads, while verified business accounts are gaining significantly higher trust.
Twitter User Behavior During Major Events And News Cycles
- The significance of Twitter for the world is the real-time information nerve center during the very impactful news cycles.
- The instant response of Twitter users to breaking news causes the number to skyrocket by 27% within the first hour alone, rather than the overall daily active user count.
- Events like the January 2025 solar flare alert, which, together with the 3.1 million tweets in just six hours, are another indication of how fast the conversations can get on the platform.
- Real-time shows and events like the Super Bowl or FIFA qualifiers push the entire platform to its limits, with the entire activity consisting of sending an astonishing 2,200 tweets per second, accounting for the total user reactions on Twitter.
- The political events have the widest reach, for example, during U.S. primaries, almost 2.9 billion impressions were generated, whereas the emotional side of human behavior was the most predominant influence—crisis posts and GIFs saw a sharp rise in volume.
- Not only are the audio conversations getting louder, but the usage of Twitter Spaces has also tripled in the case of major events.
- Verified voices are the most important: journalists and emergency agencies achieve way higher engagement and response rates than others, proving that when the accuracy of information is at stake, Twitter users prioritise credibility.
Conclusion
Twitter Users Statistics: X in 2025 is at a critical point strategically, where the influence is still very strong, but at the same time, trust and monetization are both taking a toll. Twitter users remain the primary drivers of unmatched real-time conversations across politics, media, and major global events; the platform’s cultural relevance is not fading at all.
Nonetheless, declining ad revenue, safety concerns, and rising competition make it clear that an urgent structural overhaul is needed. Ultimately, X’s future depends on balancing openness with governance and converting high-impact engagement into sustainable growth without diluting what makes Twitter users uniquely influential.
Sources
FAQ.
Twitter (X) is using hundreds of million users around the world; according to advertising metrics, there will be 545 connections, historical information says that 200 million daily active users have been monetized.
Twitter advertising revenues will be highest in the year 2021, hitting USD 4.51 billion on a sharp decline after the year 2023, given advertiser pull-out and modifications to the platform.
The United States surpasses 106 million Twitter users, followed by Japan and India.
Most Twitter users were pegged as men 25-34, closely trailing men 18-24.
The median engagement rate is 0.029% for all tweets. Both sports and higher education accounts are competing much more heavily than the average.

I hold an MBA in Finance and Marketing, bringing a unique blend of business acumen and creative communication skills. With experience as a content in crafting statistical and research-backed content across multiple domains, including education, technology, product reviews, and company website analytics, I specialize in producing engaging, informative, and SEO-optimized content tailored to diverse audiences. My work bridges technical accuracy with compelling storytelling, helping brands educate, inform, and connect with their target markets.