Tableau Statistics And Facts (2025)
Updated · Apr 08, 2026

Table of Contents
- Introduction
- Editor’s Choice
- General Facts
- Tableau Market Share
- Tableau Usage By Company
- Tableau Website Traffic By Country
- Tableau Country Traffic By Device
- Tableau Marketing Channels
- Tableau Social Traffic
- Tableau Demographics
- Tableau Software Customers By Product And Services
- Tableau Usage By Industry
- Tableau Software Customers Geography
- Conclusion
Introduction
Tableau Statistics: Tableau has been hailed as one of the world’s most powerful data visualization and business intelligence tools. With an increased demand for data-driven decision-making, Tableau Statistics is legal and vital to businesses, analysts, and data scientists.
In 2024, New versions of Tableau brought even more up-to-date developments in statistics, advanced analytics, AI-driven insights, and cloud integration. This article will present and explore the scintillating features of Tableau Statistics 2024 with real figures.
Editor’s Choice
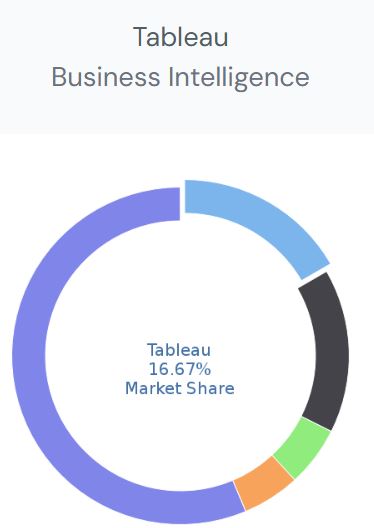
- According to Tableau Statistics, Tableau owns approximately 16.7% of the data visualisation and business intelligence market. Thus, it is one among the majority in the industry.
- In 2024, Tableau extended its improvement of all-the-more CAPABLE statistical features that could include advanced analytics, AI-driven insights, and cloud integration. Power BI, QlikView, Looker, and Google Data Studio are other comparable tools.
- However, there were also other countries with significant traffic numbers, such as Japan, the United Kingdom, India, and Canada, with the United States owning 34.20% of the traffic contributed to the platform itself, albeit with a drop of 5.96%. Usage is shown primarily through the desktop in most of those countries; in the United States, desktop usage is at 93.44%.
- Tableau Statistics show that Tableau’s marketing channels reveal that direct sources contribute 54.68% of traffic, followed by organic search at 34.90%. Social media traffic is led by YouTube, Reddit, and LinkedIn, with YouTube contributing 25.39%.
- Demographically, Tableau’s audience is almost split evenly between genders, but with a slightly larger share of females. The age group 25-34 accounts for the largest segment of the user population at 31.10%.
- Business Intelligence tools rank first in the consolidated table of popular products and uses in Europe, followed by ML solutions and Data Analytics.
General Facts
- Tableau is now being used for data visualization and analytics by over 120,000 organizations in the world, which is an 18% increase compared to 2023.
- According to Tableau Statistics, Tableau goes up against heavyweights in the field, such as Microsoft Power BI with a sizable share of 22.1%, Qlik Sense with 10.5%, Looker with 8.9%, and Domo with a 5.3% share, along with many other niche tools. Tableau is still where it is because of its user-friendly functionality and data analytics capabilities.
- Tableau 2024 has enhanced the statistical features designed for better data analysis. The accuracy of linear regression improved by 12%, whereas polynomial regression has now added support for sixth-degree models for the modeling of more complex trends. Time series provides forecast-level predictions with 95% confidence intervals and an 8% reduction in prediction error, with exponential smoothing methods being 22% more adept at handling seasonality.
- Machine learning-powered anomaly detection has been further enhanced with a 20% drop in false positives, while real-time alerts notify users of the anomalies within the 5 5-millisecond time frame.
- Tableau Statistics show that Cloud and big data platform integration have been further reinforced with Tableau 2024. Native integration with direct AWS, Google Cloud, and Microsoft Azure has improved by 30%, while cloud queries are now 40% faster than in 2023.
- The speed of queries with Tableau Hyper has improved by 25%. Now, reports can be generated faster, and it can handle datasets larger than 100 terabytes, which means an increase of 50% over earlier editions.
- Enhanced performance and usability with a speed of 35% dashboard load times, providing less time waiting.
- Cross-database joins are 28% more efficient, and query execution time has been cut down by 15%.
- Tableau has made improvements in drag-and-drop functionality by 10% to make it easier for new users to create visualisations, while other features for the customisation of themes and layouts have expanded by 50%.
- The product features of Tableau 2024 now include AI and automation as integral components. Automation of data story generation has now become 60% faster, reducing manual intervention in analysis.
- The “Ask Data” feature, which is powered by natural language processing, understands 20% more complicated queries, with NLP queries processed within just 2 seconds.
- Now, forecasting models are 35% more accurate, while the AI-driven decision tree yielded a classification result that is 18% better in reliability.
- Tableau Statistics reveal that there are now over 4 million users who have published their dashboards on Tableau Public, which is a 25% increase compared to 2023, with a 30% increase in daily active users. Engagement in the Tableau forums has also seen a 40% increase, resulting in the creation of 500,000 new discussions in 2024.
- In 2024, Tableau revamped its pricing model. Table Creator License is now priced at US$75 per user per month, up 7% from its previous listing of US$70.
- Tableau Explorer License continues to remain at US$42 per user per month, while the price of the Tableau Viewer License has been lowered by 6% to US$15 per user per month to attract more users.
- According to Tableau Statistics, the enterprise plans are custom-priced for big organisations, with discounts available for annual commitments increasing by US$500,000.
(Source: enlyft.com)
- Tableau Statistics show that about 16.70% is the market share of Tableau, which makes it a big player in the data visualisation and business intelligence sector.
- Amongst some other major contenders, Tableau’s most relevant competitors include Power BI, QlikView, Looker, and Google Data Studio.
- These tools offer similar capabilities for interactive dashboards, data analysis, and reporting functionalities targeting various enterprises looking for data-driven decision-making solutions.
Tableau Usage By Company
| Company | Website | Country | Revenue |
Company Size
|
| Grover | grovercorp.com | United States | 100M-200M | 50-200 |
| Level Set Consulting | levelsetconsulting.com | United States | 0M-1M | 1-10 |
| Mohawk Industries, Inc. | mohawkind.com | United States | >1000M | >10000 |
| Pure Storage Inc | purestorage.com | United States | >1000M |
5000-10000
|
| Further, Inc. | further.co | United States | 0M-1M | 10-50 |
(Source: enlyft.com)
- Tableau Statistics show that various companies across the world are utilising Tableau for data
visualisation and analytics purposes. Grover is based in the USA and earns between US$100M and US$200M and employs 50-200 people. - Level Set Consulting again operates from within the USA but is a relatively smaller company generating below US$1M and having 1-10 full-time employees.
- Mohawk Industries, Inc. is a large U.S. corporation with over US$1 billion in annual revenue and a workforce of more than 10,000 employees.
- Another major company in the US$1 billion revenue range, Pure Storage Inc., employs 5,000-10,000 people in the U.S. Along Inc. is a relatively small organisation with revenues below US$1 million and employee strength ranging from 10-50.
Tableau Website Traffic By Country
(Source: similarweb.com)
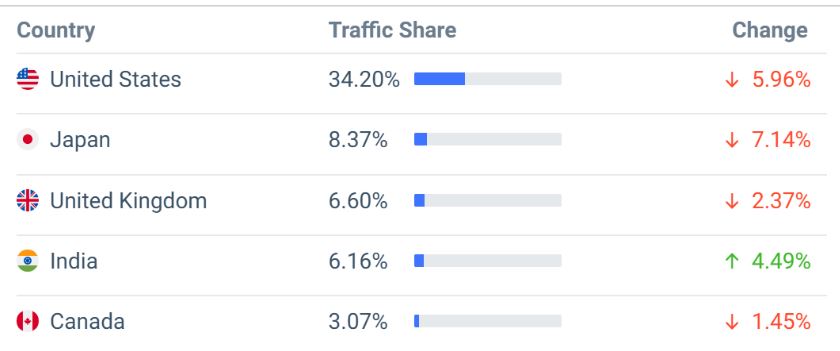
- Underneath the Tableau Statistics lies website traffic distribution related to Tableau through various locations and the percentage-wise change in the same.
- The USA tops the chart at 34.20% and shows a decline of 5.96%. Japan follows with 8.37% of traffic and a bigger fall of 7.14%.
- The UK traffic accounts for 6.60%, with a drop of 2.37%. India, accounting for 6.16% of the traffic, is the only country among the listed ones that indicates an increase at 4.49%.
- Canada occupies 3.07% of traffic and is said to have registered a minor decline of 1.45%.
Tableau Country Traffic By Device
(Reference: semrush.com)
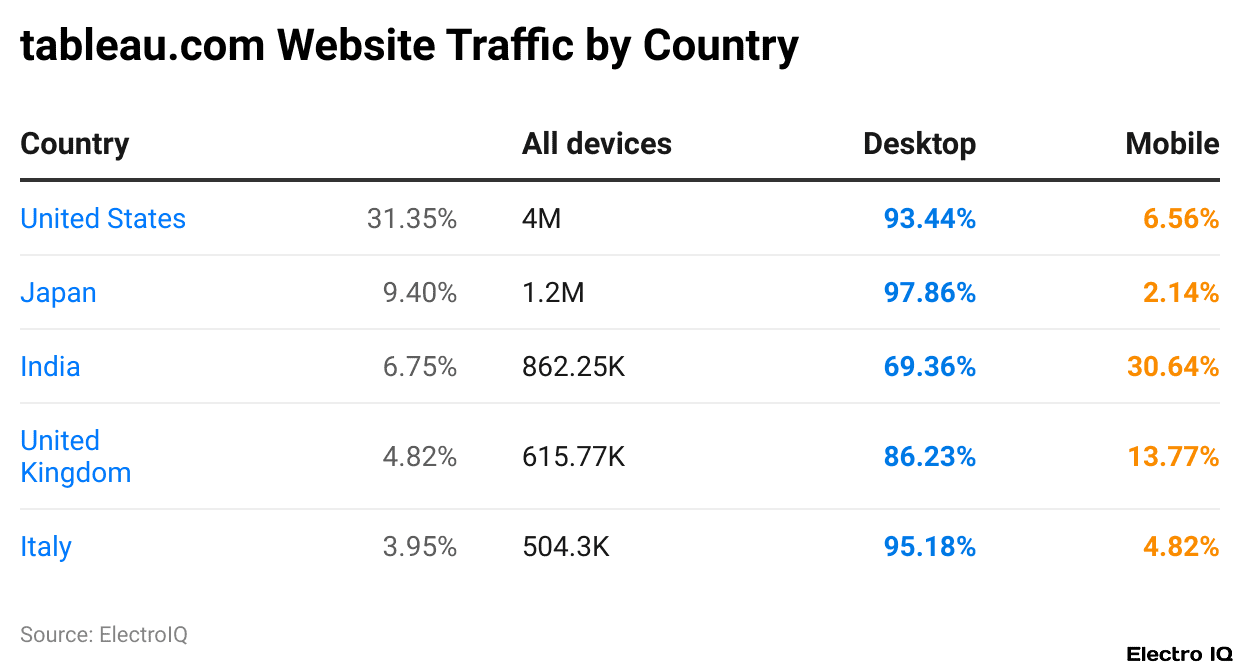
- The USA has the highest traffic share at 31.35%, giving 4 million total visits. Most users here access on desktop (93.44%), while only 6.56% use mobile.
- Following closely is Japan, with 9.4% of the total traffic, which means 1.2 million visits. Most of its users, 97.86%, use desktop only, while a mere 2.14% use mobile.
- India makes up 6.75% of the traffic, equating to 862.25K visits. The lesser part of this, at 69.36%, use desktops, while 30.64% use mobile to access it.
- The UK contributes about 4.82% to the total traffic with 615.77K visits. Desktop users here are 86.23%, while mobile users stand at 13.77%.
- Germany takes 3.95% of traffic shares with 504.3K visits. So far, a large section, at 95.18%, is accessed via desktop, whereas only 4.82% is accessed through mobile.
Tableau Marketing Channels
(Source: similarweb.com)
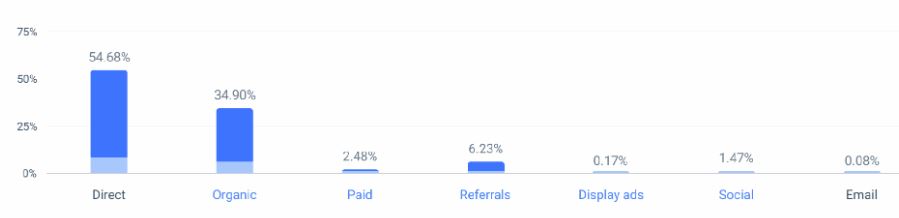
- It could be easy to say that more than half of the traffic, in percentage terms at least—54.68—comes from direct sources, which means that users reach the site without any referral links by typing the URL directly or through bookmarks.
- Organic accounts for a significant part as well, giving 34.90% from traffic, indicating high visibility in search engines for results.
- Referrals are tracked against 6.23%, showing that other sites send a moderate amount of visitors. Paid channels are parties contributing to 2.48% as an impact of advertisements placed through search engines or other platforms.
- Display ads earn a meager 0.17%, showing that the site does not rely heavily on banner or visual advertising.
- Social media generates 1.47% of the traffic, which is quite low but somehow interesting. E-mail marketing is the least awakened, at 0.08%, suggesting that it is probably used a little or that its engagement is not as dynamic.
Tableau Social Traffic
(Reference: similarweb.com)
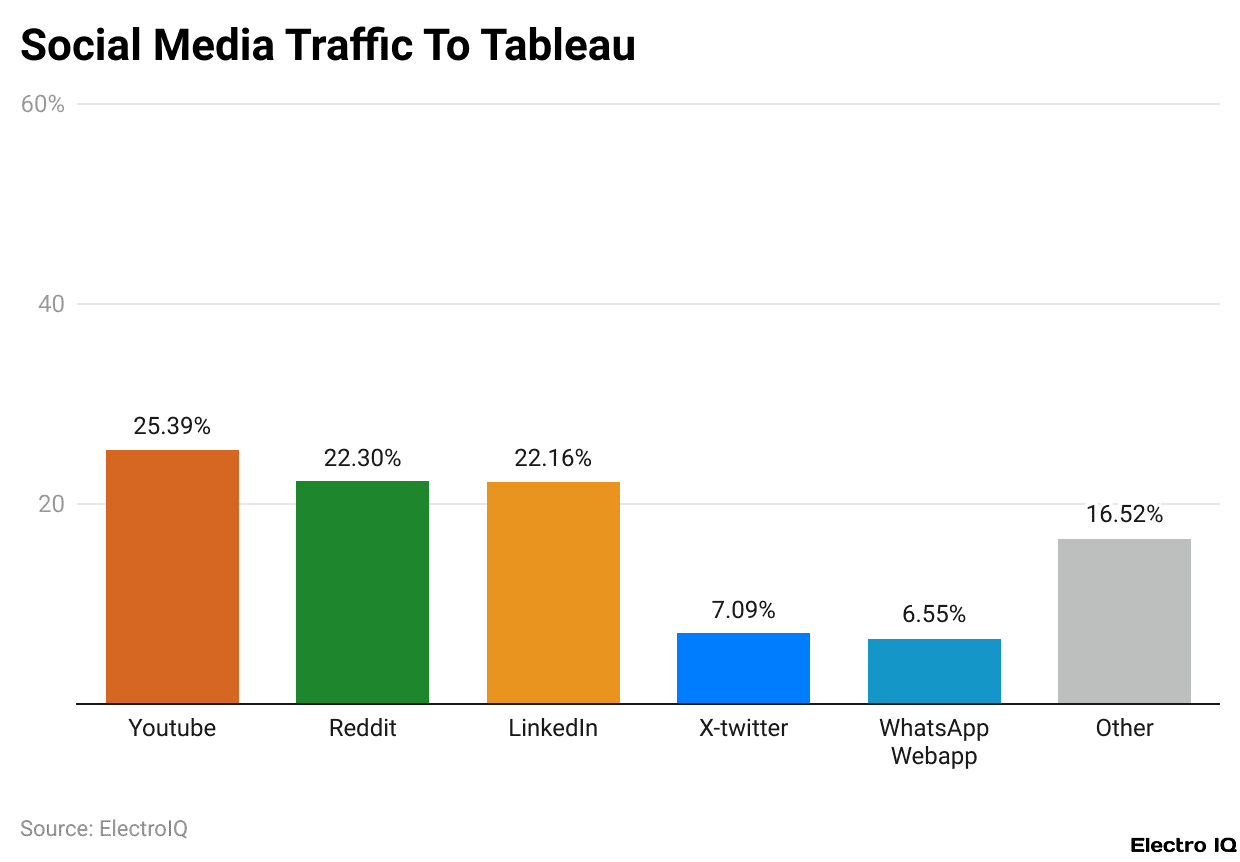
- According to Tableau Statistics, Tableau’s social traffic distribution shows that YouTube accounts for the largest share at 25.39% of, which is the highest among all sources of traffic. Next to YouTube is Reddit, with 22.30%, an indication that discussions and posts on the platform are proving effective in driving traffic.
- LinkedIn covers 22.16%, suggesting a very good professional audience interaction with Tableau content.
- The exit includes 7.09%, which is a low yet significant presence on the platform. This shows that direct sharing and private group discussions also play a role, as WhatsApp sources 6.55% of traffic.
- The rest of 16.52% falls under the category other sources, which may encompass other platforms like Facebook, Instagram, or specialised communities.
Tableau Demographics
(Source: similarweb.com)
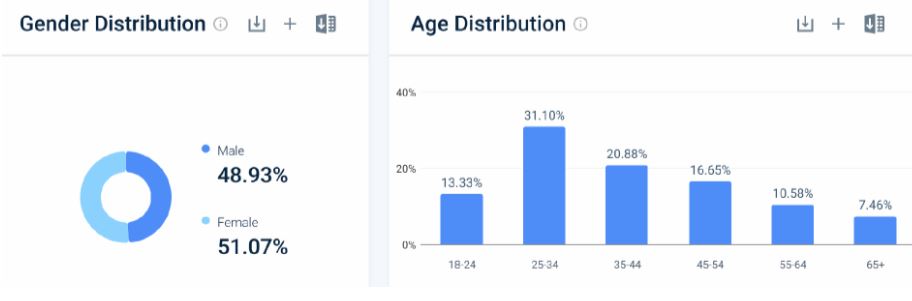
- Tableau Statistics about the demographic composition of a group in terms of gender and age. In terms of gender, the population is almost equally divided, with 48.93% identifying as male and 51.07% as female.
- For age, the largest proportion belonged to the group of 25-34 years, which accounted for 31.10% of the total. The second-largest group is people aged 35 to 44, who make up 20.88%.
- Those aged between 45-54 constitute 16.65%, and the younger age group, that is, 18-24 years old, makes up 13.33%.
- The remaining, older age groups are sharing a small percentage, with those aged 55-64 contributing 10.58% and those above 65 accounting for the rest share of 7.46%.
Tableau Software Customers By Product And Services
(Reference: 6sense.com)
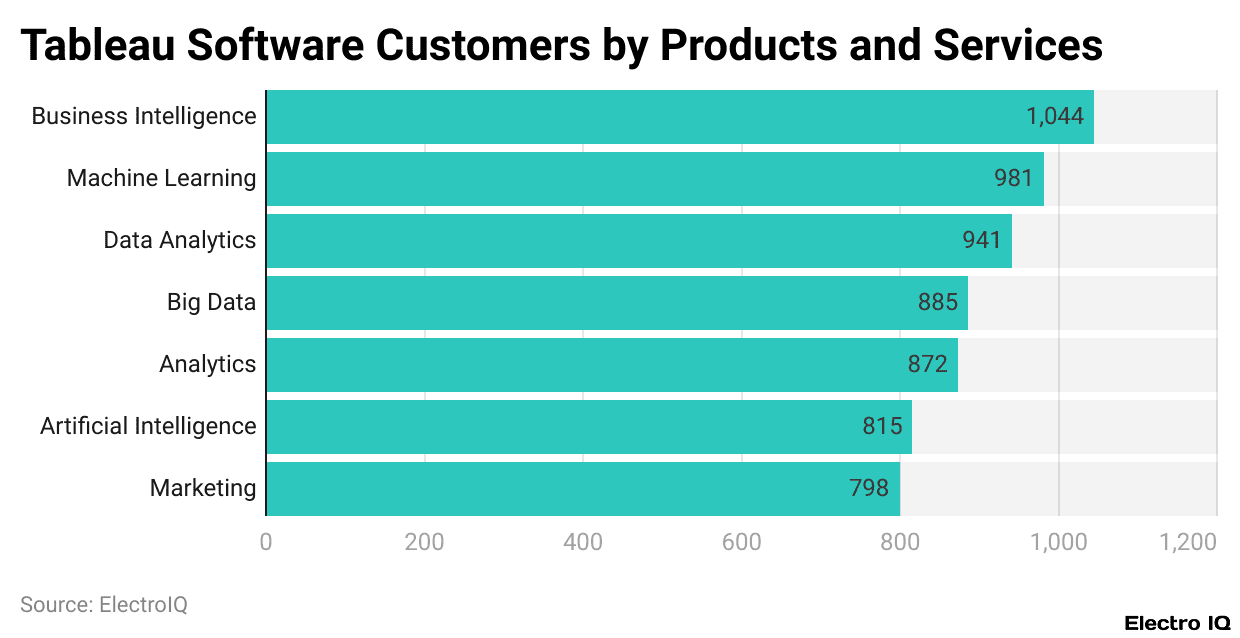
- Tableau Statistics indicate how many customers Table Software is using for the different products and services it offers. Most customers have access to Business Intelligence tools; the total would, therefore, be 1,044 customers.
- Second is 981 customers utilising Machine Learning solutions, and then the number of customers engaged in Data Analytics is 941.
- Big Data tools have 885 customers, whereas Analytics services are used by 872. On the contrary, the use of Artificial Intelligence services, according to data, is at 815 customers, and Marketing-related services are at 798 customers.
- This data is thus the customer distribution about areas of focus within all of Tableau’s products.
Tableau Usage By Industry
(Reference: enlyft.com)
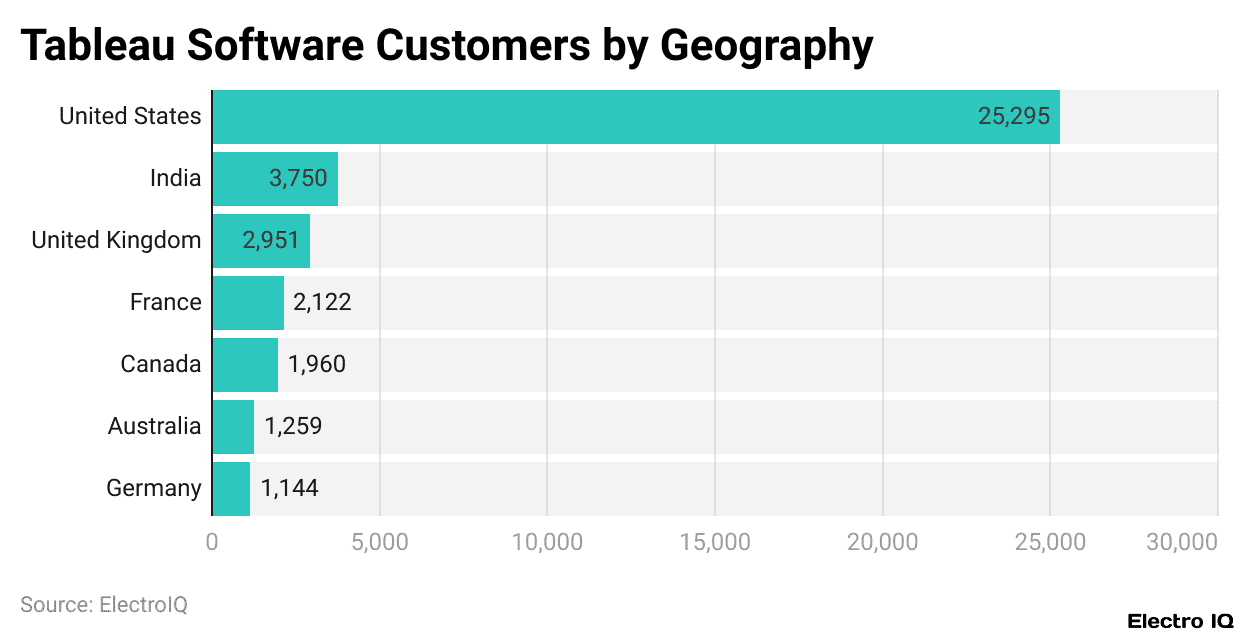
- Data show customer distribution according to nationality among Tableau Software customers.
- The United States has the largest number of customers, 25,295 users in the number. India seems to follow, with 3,750 customers, while the United Kingdom has 2,951 users.
- France has 2,122 customers, Canada has 1,960, Australia has 1,259, and Germany has 1,144.
- Tableau Statistics show that Tableau also has a significant presence in Europe and Asia.
Tableau Software Customers Geography
(Reference: 6sense.com)
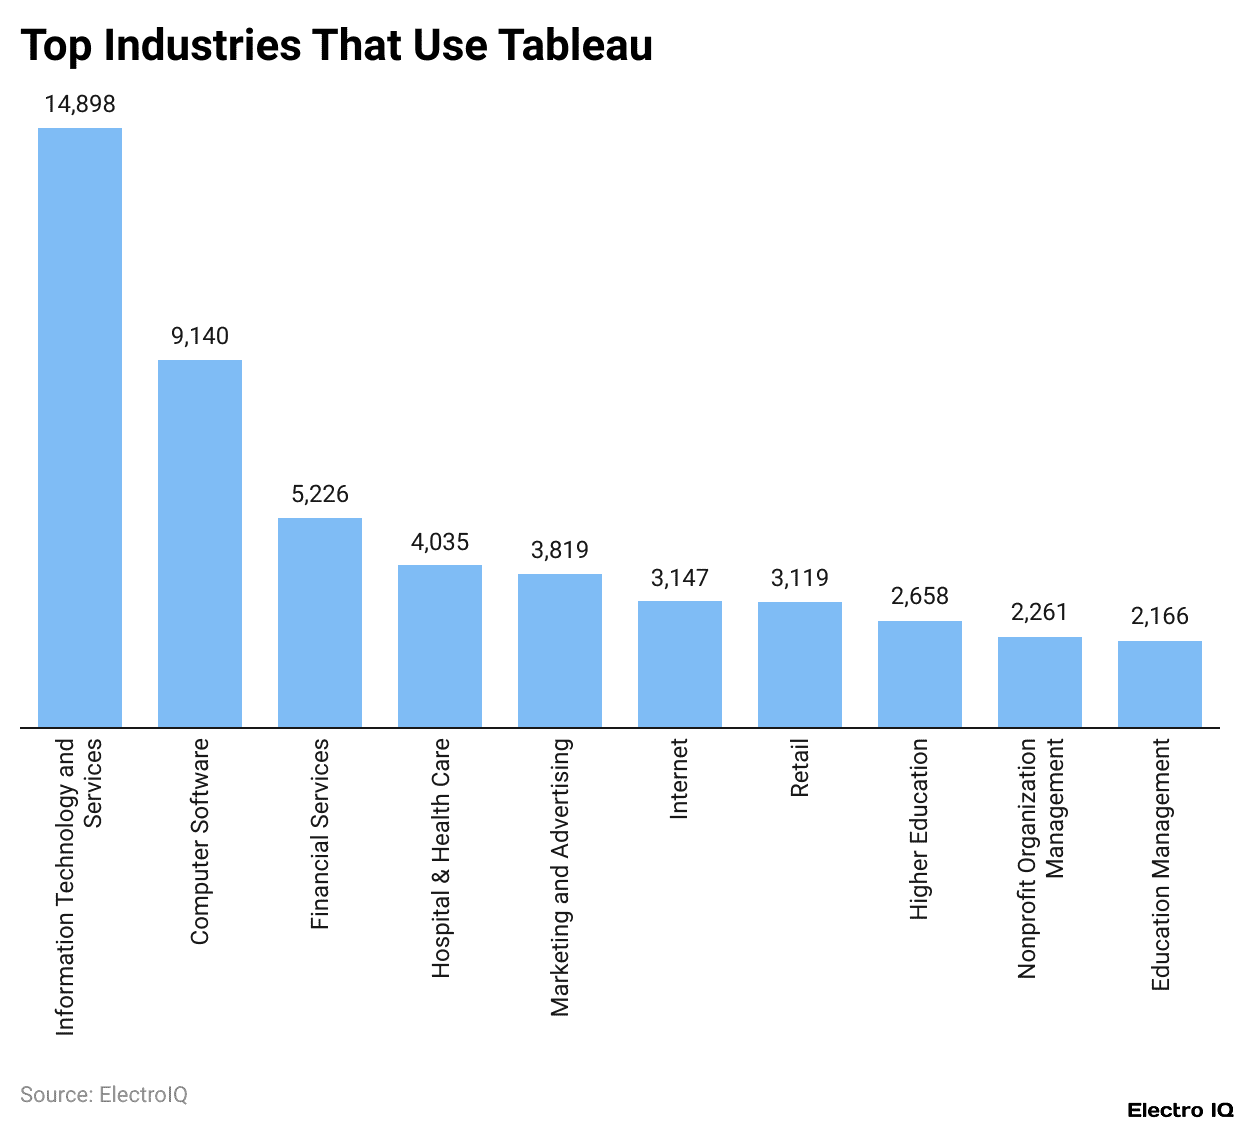
- Tableau Statistics show how many companies are using Tableau across various industries. The maximum number of companies that use Tableau belongs to Information and Technology Services, who have almost 15,000 companies.
- Next comes Computer Software, with just above 9,000. Close to 5,200 companies in Financial Services are making use of Tableau.
- The Hospital and Health Care segment has slightly more than 4,000 companies. Marketing and Advertising come next, with around 3,800 companies.
- Other sectors include the Internet industry, with around 3,150 companies, and Retail, with a similar number at just over 3,100.
- Higher Education has around 2,660 companies using Tableau. Nonprofit Organization Management and Education Management are also represented, with roughly 2,260 and 2,160 companies, respectively.
- On the whole, the data show that Tableau still appears in the types of sectors most commonly using technology-related software and services, with a few outlier sectors, such as education, healthcare, and nonprofits.
Conclusion
Tableau Statistics breaks every boundary of data visualisation and business intelligence, coming up with a lot of enhanced AI-driven analytics, forecasting, and speedier data processing. Therefore, Tableau is in the race for the top solution for enterprises and professionals dealing with data. Its user and market share continue to grow- they already surpassed the 120,000 organisations taking advantage of its functionalities, creating a competition with big players in enterprise business intelligence tools like Microsoft Power BI, Qlik Sense, Looker, and Domo, weaknesses as well as strengths alike.
From cloud integration to predictive analytics to anomaly detection, these latest enhancements will keep businesses equipped to make their decisions through data quickly. As long as organisations invest in analytics, Tableau will remain in a lead position in the BI space.
Sources
FAQ.
Tableau has a market share of about 16.7% in the data visualisation and business intelligence industry as one of the top products competing with other products such as Power BI, QlikView, Looker, and Google Data Studio.
The largest share, weighing in at 34.20% of Tableau’s website traffic, belongs to the United States, followed closely behind by Japan, the United Kingdom, India, and Canada. The other few countries showing a drop in traffic for this very term included India, which was the only nation reporting an increase in traffic at 4.49% traffic growth.
Business Intelligence tools are the most widely utilised Tableau products, as they count 1,044 customers. Other popular offerings are Machine Learning solutions (981 customers), Data Analytics (941 customers), and Big Data tools (885 customers).
There are approximately 15,000 companies in Information and Technology Services that have used Tableau, which is by far the biggest domain. Other domains are Computer Software, Financial Services, Healthcare, Marketing, and Retail.
Tableau’s clientele cuts evenly across both genders, with 48.93% male and 51.07% female. The dominant age range of users is 25-34 years, constituting 31.10% of users, and is followed by age brackets 35-44 (20.88%) and 45-54 (16.65%).

Maitrayee Dey has a background in Electrical Engineering and has worked in various technical roles before transitioning to writing. Specializing in technology and Artificial Intelligence, she has served as an Academic Research Analyst and Freelance Writer, particularly focusing on education and healthcare in Australia. Maitrayee's lifelong passions for writing and painting led her to pursue a full-time writing career. She is also the creator of a cooking YouTube channel, where she shares her culinary adventures. At Smartphone Thoughts, Maitrayee brings her expertise in technology to provide in-depth smartphone reviews and app-related statistics, making complex topics easy to understand for all readers.


