Android Statistics By Applications, Market Share, Vendors, Adoption Rates and Facts (2025)
Updated · Nov 21, 2025

Table of Contents
- Introduction
- Editor’s Choice
- What Is The Android Operating System?
- General Android Statistics
- Android Smartphone Vendor Breakdown Statistics
- How Many Android Users Are There?
- Android OS Market Share
- Android OS Applications
- Top Android OS versions
- Top Android Phone Statistics
- Mobile Android Operating System Market Share
- Market Share of Smartphone OS Systems Globally
- iOS vs Android Ratings for Leading Banking Apps Statistics
- Adoption Rates of Android Phone Versions Statistics
- Most Downloaded Android Apps Worldwide Statistics
- iPhone vs Android Statistics
- Conclusion
Introduction
Android Statistics: Android is everywhere right now, running on billions of smartphones and tablets worldwide. It is the most popular operating system, with about 4 billion active users in 190 countries. If you are looking to invest, this report provides an overview of the various parts of the Android market.
If you are curious about how big the Android market will be in 2023 and 2024, let us look at some key Android Statistics!
Editor’s Choice
- Android holds a strong position in markets such as Brazil, India, Indonesia, Vietnam, and Turkey, where its share exceeds 85%, underscoring its widespread use in these regions.
- In the United States, iOS led the market with 56.6% in Q2 2022, while Android accounted for 43%, reflecting a clear shift toward Apple devices.
- The Google Play Store listed about 2.67 million apps as of March 2023, confirming its place as one of the largest app platforms in the world.
- TikTok remained the most downloaded Android app with 24 million installs, followed closely by Instagram and WhatsApp Messenger, showing strong demand for social and communication platforms.
- Coin Master became the highest-earning Android app, generating USD 47.96 million in revenue, indicating continued consumer spending on mobile gaming.
- Free apps accounted for 97% of the Android ecosystem, while paid apps accounted for only 3.1%, highlighting that most users prefer free access.
- Android became the leading mobile operating system in 2014 and reached 1 billion users within a year, marking one of the fastest adoption cycles in technology history.
- The total number of Android users worldwide reached 3.9 billion, showing its presence as the most widely used mobile OS.
- Android captured 73.9% of the global mobile OS market, reinforcing its dominance worldwide.
- Android accounted for 42.51% of the US mobile OS market, showing a sizable but competitive position.
- Android 14 held 24.51% of the Android version market, reflecting strong adoption of the latest release.
- Samsung dominated Android device shipments with 30.8% of the vendor market share, while Xiaomi ranked second.
What Is The Android Operating System?
The Android Operating System is a smartphone and tablet operating system based on Linux.
It includes an operating system built on the Linux kernel, a user-friendly interface, a web browser, and downloadable apps. When Android first came out, it was designed to work on low-cost phones with simple numeric keypads, even though early demos showed it running on a QWERTY phone with a large VGA screen.
Android is open source, meaning anyone can modify it, and it was released under the Apache 2.0 license. This allows developers to create versions of the system for other devices, like gaming consoles or digital cameras.
General Android Statistics
- As of July 2022, Android 11 was the most popular version, with 29.63% of users, followed by Android 12 at 20.68%.
- In the United States, about 60% of smartphone owners use an Android device.
- The average cost of an Android smartphone is around $254 (about £169).
- TikTok, one of the most downloaded apps, has been downloaded 672 million times.
- The global smartphone market is expected to grow from $510 billion in 2022 to about $876 billion by 2032, with an annual growth rate of 5.7% from 2023 to 2032.
- As of 2024, about 3.3 billion people worldwide use Android devices, which has 71.74% of the global market for mobile operating systems.
- The newest version, Android 12.0.0_r46, was launched on April 10, 2023.
- Android’s share of the global smartphone market fell in 2022, continuing a decline that started in 2023.
- In 2023, 41% of people aged 18-34 used Android, while 58% used iOS.
- Among people aged 35-54, 53% preferred Android, as per Android Statistics.
- Google bought Android Inc. for USD 50 million in 2005.
Android Smartphone Vendor Breakdown Statistics
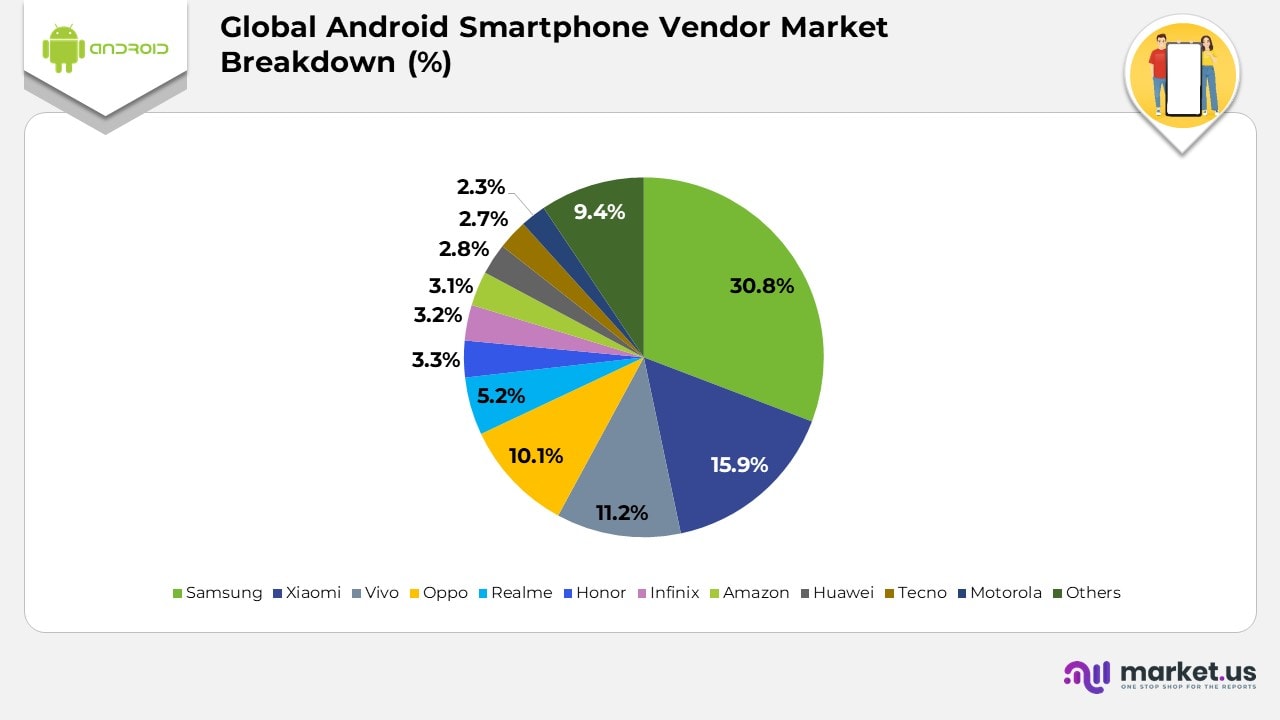
(Reference: Market.us)
- Samsung holds 30.8% of global Android shipments, making it the largest Android smartphone vendor and the strongest driver of overall Android device volume.
- Xiaomi accounts for 15.9%, supported by solid demand in Asia and Europe and a broad lineup across different price bands.
- Vivo captures 11.2%, helped by the popularity of its mid-range and camera-centric smartphones.
- Oppo maintains 10.1%, reflecting its expanding global reach and a consistent product refresh cycle.
- Realme secures 5.2%, driven by affordable models that appeal strongly to young buyers.
- Honour holds 3.3%, showing steady progress as it rebuilds its brand position in multiple regions.
- Infinix contributes 3.2% and performs well in Africa, gaining attention in select Asian countries.
- Amazon records 3.1% due to continued demand for its Fire device ecosystem.
- Huawei keeps 2.8%, even though its device availability is lower in many global markets.
- Tecno achieves 2.7%, supported by strong traction in emerging economies.
- Motorola holds 2.3%, mainly driven by its competitively priced lineup in the United States.
- Other Android vendors together represent 9.4%, adding diversity to the global Android landscape.
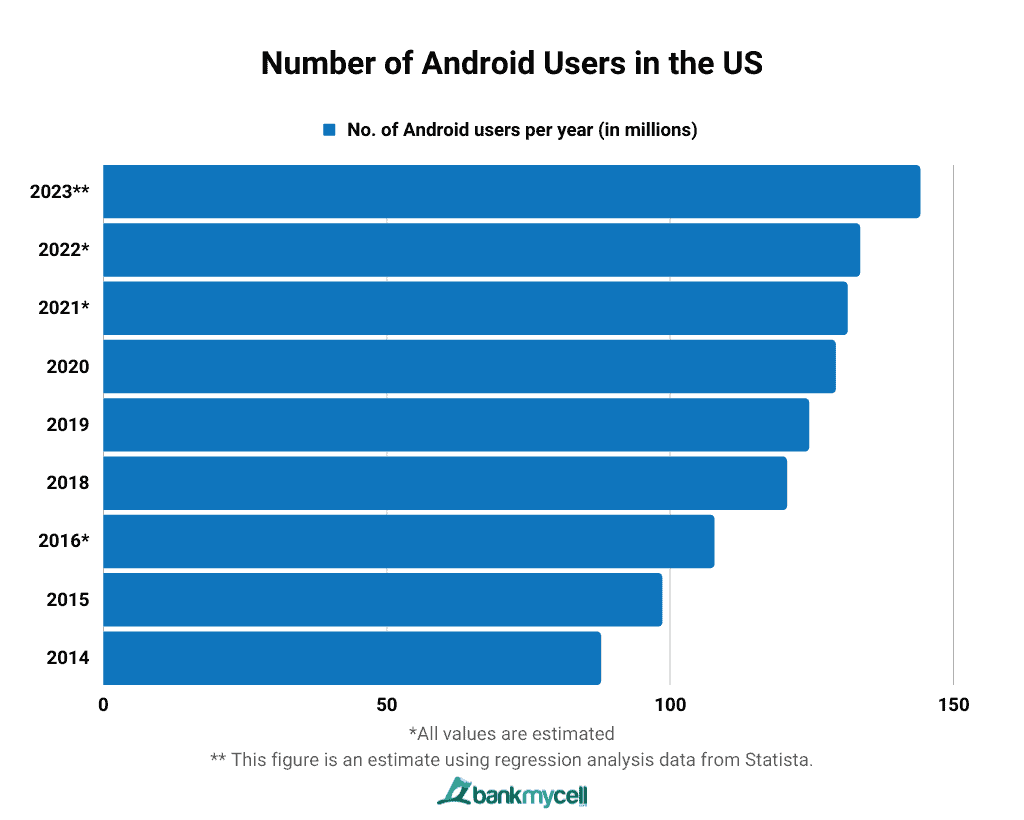
How Many Android Users Are There?
- More than 3.9 billion people are using Android in 2025, demonstrating the operating system’s widespread adoption worldwide.
- Android started in 2008 and became widely available in 2011. By 2012, the number of users reached 0.5 billion, reflecting strong early growth.
- The user base increased to 0.7 billion in 2013 as smartphones became more affordable in many regions.
- By 2023, Android usage climbed to 3.5 billion, supported by rapid expansion in Asia and strong demand for low and mid-range devices.
- In 2024, the number rose to 3.6 billion, driven by rising 5G adoption and higher upgrade cycles.
- In 2025, global Android users reached 3.9 billion, a steady 8% increase from the previous year.
The following table displays the number of Android users worldwide.
| Year | The Number Of Android Users Per Year |
|---|---|
| 2012 | 0.5 billion |
| 2013 | 0.7 billion |
| 2014 | 1 billion |
| 2015 | 1.4 billion |
| 2016 | 1.7 billion |
| 2017 | 2 billion |
| 2018 | 2.3 billion |
| 2019 | 2.5 billion |
| 2020 | 2.8 billion |
| 2021 | 3 billion |
| 2022 | 3.3 billion |
| 2023 | 3.5 billion |
| 2024 | 3.6 billion |
| 2025 | 3.9 billion |
- Android is used on 72.55% of mobile devices, indicating it remains the most common operating system worldwide. This strong usage reflects its presence across budget, mid-range, and premium smartphones.
- iOS holds 27.04% of the global device market share and continues to grow in higher-income regions and among strong Apple brand loyalists.
- Samsung’s operating system accounts for 0.22%, indicating that its older proprietary systems are now used on only a very small number of devices.
- Devices listed as unknown represent 0.14%, which usually comes from niche or unclassified operating systems.
- KaiOS has 0.03%, reflecting a limited but persistent share among feature phones in select markets.
- Windows phones make up 0.01%, confirming that the platform is almost no longer in use.
- Android holds more than 85% share in markets such as Brazil, India, Indonesia, Vietnam, and Turkey, which indicates its dominance in regions where affordable smartphones lead consumer demand.
The following table shows the % of phones using different operating systems.
| Operating System | Percentage Of Mobile Devices |
|---|---|
| Android | 72.55% |
| iOS | 27.04% |
| Samsung | 0.22% |
| Unknown | 0.14% |
| KaiOS | 0.03% |
| Windows | 0.01% |
Android OS Applications
- As of Q2 2024, almost 1.69 million applications are available on the Google Play Store.
- The table below shows the count of the applications that are available on the Google Play Store over the past years:
| Year, month | No. of Applications on Google Play Store |
| Q1 2022 | 2,591,578 |
| Q2 2022 | 2,654,747 |
| Q3 2022 | 2,683,925 |
| Q4 2022 | 2,694,114 |
| Q1 2023 | 2,673,292 |
| Q2 2023 | 2,597,819 |
| Q3 2023 | 2,593,870 |
| Q4 2023 | 2,438,553 |
| Q1 2024 | 2,000,247 |
| Q2 2024 | 1,682,635 |
- TikTok is the most downloaded app globally on the Google Play Store, with about 24 million downloads. Instagram follows it with 21.17 million downloads and WhatsApp Messenger with 20.72 million downloads.
- Here is a table showing the most popular Android apps on the Google Play Store worldwide as of September 2023.
| Application | Number Of Application Downloads |
| CapCut-Video Editor | 12.38 million |
| WhatsApp Business | 12.87 million |
| Amazon Shopping | 13.69 million |
| 14.22 million | |
| Stick War: Hero Tower Defense | 15.07 million |
| Snapchat | 15.27 million |
| Stumble Guys | 17.51 million |
| WhatsApp Messenger | 20.72 million |
| 21.17 million | |
| TikTok | 23.96 million |
Top Android OS versions
- If you are developing an app for Google Play, it is helpful to know which Android versions most people are using.
- In November 2024, Android 14 is the most widely used version, holding a 25.8% market share.
- This means that a quarter of all Android devices (phones and tablets) are running Android 14, so it is a good idea to focus on making your app compatible with this version.
- The chart below shows the most common Android versions installed on devices used by AppBrain SDK users.
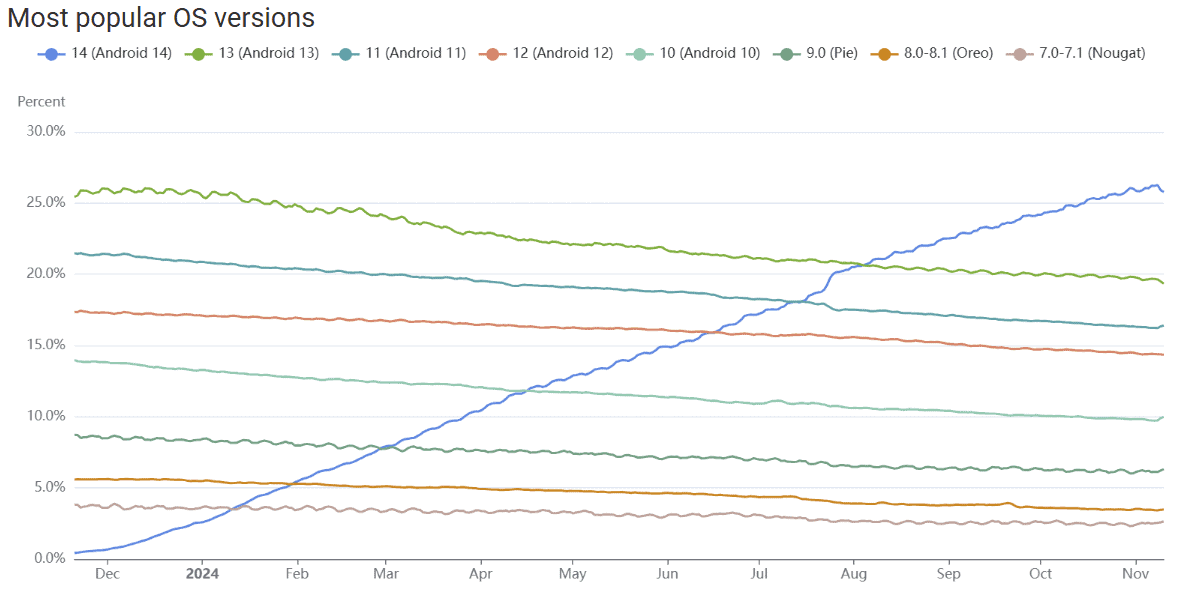
(Source: appbrain.com)
| Android OS version | Market share | Change in last 30 days |
|
6.0 (Marshmallow) |
0.7% | Less by 2.3% |
| 5.0 – 5.1 (Lollipop) | 0.7% |
No Change |
|
7.0- 7.1 (Nougat) |
2.6% | More by 8.1% |
| 8.0-8.1 (Oreo) | 3.5% |
Less by 2.6% |
|
9.0 (Pie) |
6.3% | More by 2.9% |
| 10(Android 10) | 10.0% |
No Change |
|
12 (Android 12) |
14.3% | Less by 2.4% |
| 11 (Android 11) | 16.4% |
No Change |
|
13 (Android 13) |
19.3% | Less by 3.4% |
| 14 (Android 14) | 25.8% |
More by 3.8% |
Top Android Phone Statistics
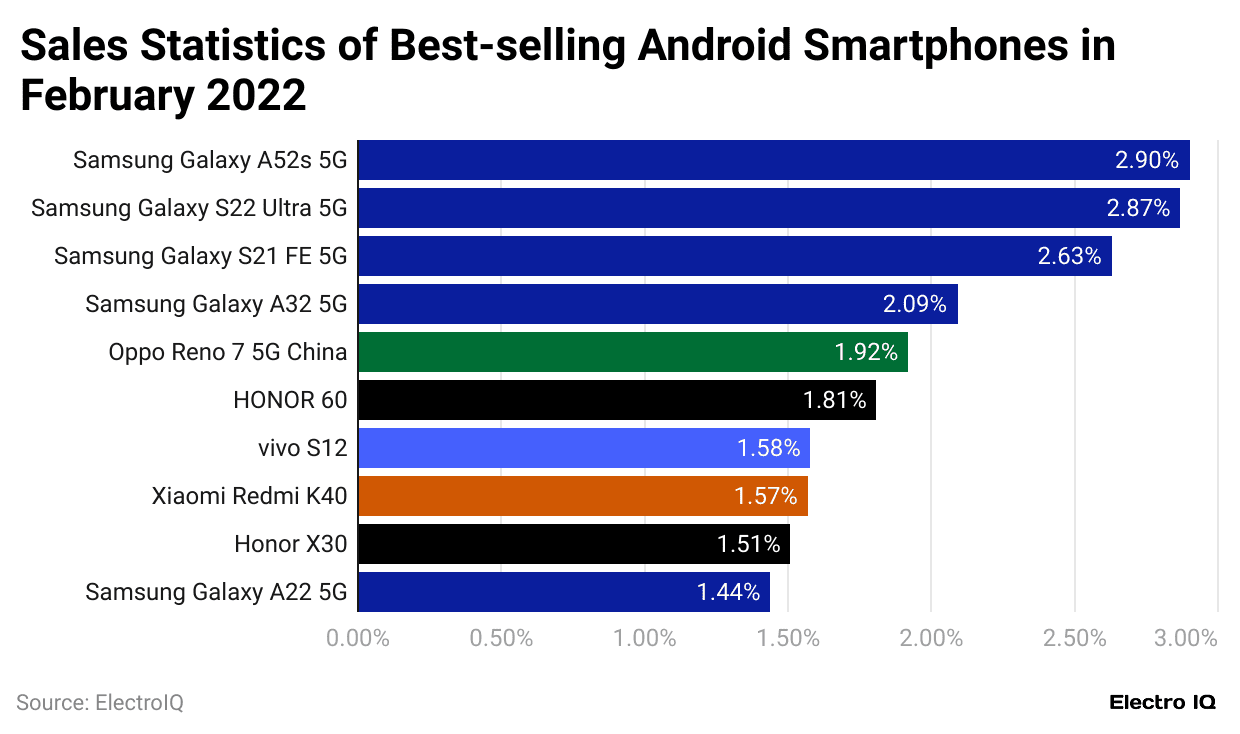
- As of November 2024, the Samsung Galaxy A12 is the most popular Android phone, with a 1.57% share of the global market.
- This means many Android users are using the Galaxy A12, so according to Android Statistics, make sure your app is compatible with it.
- The chart below shows which Android phones are currently being used most by AppBrain SDK users.
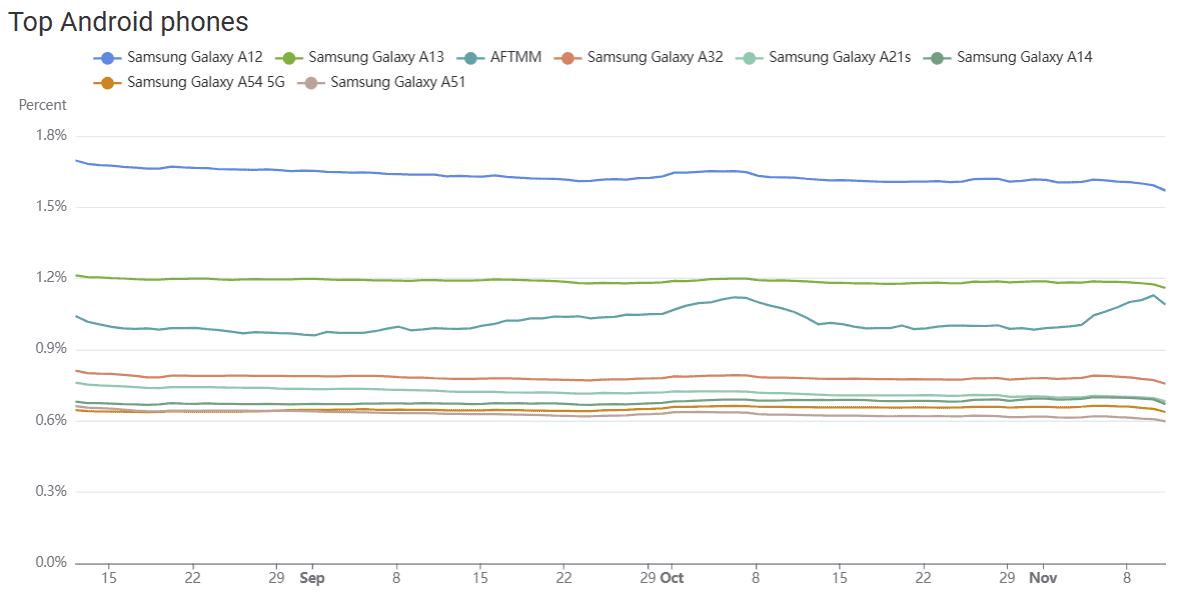
(Source: appbrain.com)
| Android phone model | Market Share | Change in the past 30 days |
|
Samsung Galaxy A53 5G |
0.5% | 4.4% |
| Samsung Galaxy A23 | 0.5% |
No change |
|
Samsung Galaxy A50 |
0.5% | 5.2% |
| AFTSSS | 0.5% |
No change |
|
Vivo VS2043 |
0.5% | No change |
| Samsung Galaxy A34 5G | 0.5% |
No change |
|
Redmi 13C |
0.5% | 5.8% |
| Redmi Note 11 | 0.5% |
No change |
|
Samsung Galaxy S23 Ultra |
0.6% | 3.3% |
| Samsung Galaxy A15 | 0.6% |
9.4% |
|
Samsung Galaxy A51 |
0.6% | 4.5% |
| Redmi 9A | 0.6% |
2.6% |
|
Samsung Galaxy A54 5G |
0.6% | 3.2% |
| Samsung Galaxy A14 | 0.7% |
2.5% |
|
Samsung Galaxy A21s |
0.7% | 4.5% |
| Samsung Galaxy A32 | 0.8% |
3.1% |
|
AFTMM |
1.1% | 2.9% |
| Samsung Galaxy A13 | 1.2% |
2.5% |
|
Samsung Galaxy A12 |
1.6% |
3.4% |
 (Source: coolest-gadgets.com)
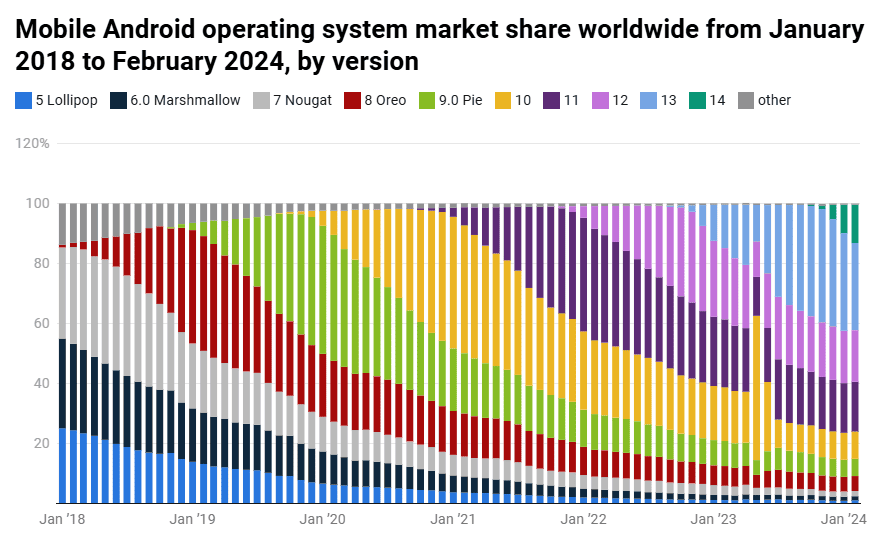
- Android 13 held 29.16% of the global market in February 2024, making it the most used version at that time. Android 12 accounted for 17.16%, while Android 11 stood at 16.6% and Android 14 at 12.8%.
- Older versions accounted for smaller portions of use in February 2024. Android 10 recorded 9.08%, Android 9.0 Pie reached 5.76%, and Android 8 Oreo held 4.98%. Android 7 Nougat marked 1.76%, Android 6.0 Marshmallow reached 1.38%, and Android 5 Lollipop accounted for 1.03%. Other versions combined made up 0.37%.
- In January 2024, Android 13 remained the leading version with 32.48%, followed by Android 12 at 17.5%, Android 11 at 16.54%, and Android 14 at 9.52%.
- Additional shares observed in January 2024 show Android 10 at 8.97%, Android 9.0 Pie at 5.73%, and Android 8 Oreo at 4.83%. Android 7 Nougat captured 1.79%, Android 6.0 Marshmallow reached 1.33%, and Android 5 Lollipop recorded 0.9%. Other versions held 0.4%.
(Source: statista.com)
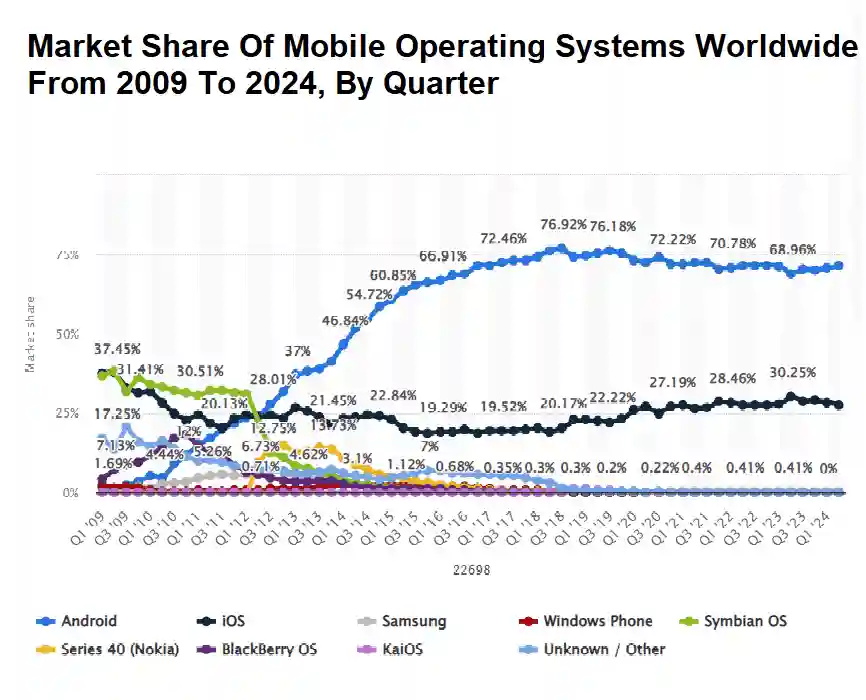
- In the second quarter of 2024, Android continued to lead the global mobile operating system market, holding 71.65% of the share.
- According to Android Statistics, its main competitor, Apple’s iOS, had around 27.62% of the market during the same period.
- Both Android and iOS were released in 2007 and have been updated over time to add new features.
- The latest version of iOS, iOS 17, came out in September 2023, while Android 14 was released in October 2023.
- A key difference between the two systems is the hardware: iOS is only available on Apple devices, whereas many manufacturers, including Samsung, Google, and OnePlus, use Android.
- Also, Apple has been better at getting users to upgrade to the latest version. As of February 2024, 66% of iOS users had updated to iOS 17, while only 13% of Android users had moved to Android 14.
(Source: Enterprise Apps Today)
- The smartphone boom started around 2010 when touchscreen smartphones became more popular. This shift led to a drop in sales of basic mobile phones.
- Smartphone sales grew from 139 million units in 2008 to 1.39 billion units in 2023.
- However, smartphone sales fell slightly in 2020 to 1.38 billion units due to the impact of the COVID-19 pandemic.
- Apple, Samsung, and Xiaomi have been the big winners in the smartphone market, while BlackBerry and Nokia struggled to keep up with the changes.
iOS vs Android Ratings for Leading Banking Apps Statistics
- Bank of America shows an iOS score of 8 and an Android score of 4.6, and it has been observed that the app runs more smoothly on iPhones while Android users face more stability issues.
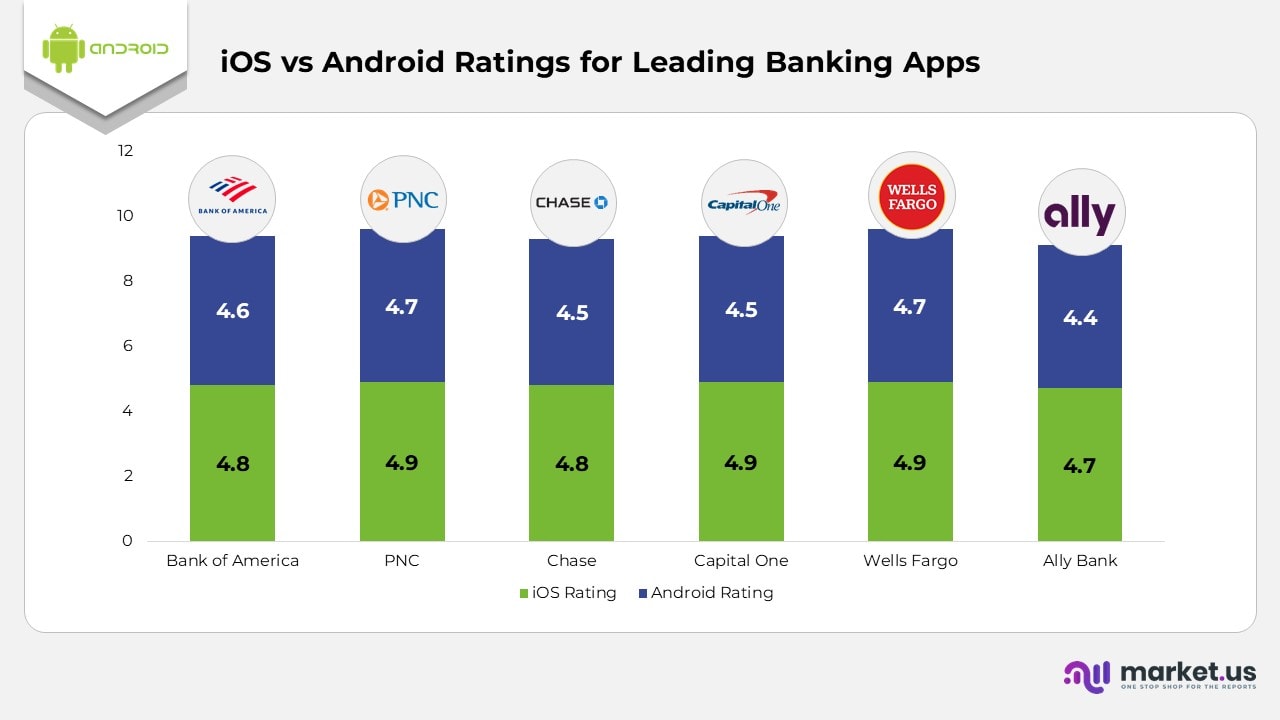
(Source: Market.us)
- PNC records an iOS score of 9 and an Android score of 4.7, and the app operates with better budgeting features on iPhones while Android updates tend to roll out more slowly.
- Chase holds iOS and Android scores of 8 and 4.5, respectively, and iPhone users report stronger overall performance, while Android users report slow loading and occasional freezing.
- Capital One scores 9 on iOS and 4.5 on Android, and transfers appear more reliable on iPhones, while recurring bugs are highlighted in Android reviews.
- Wells Fargo maintains an iOS score of 9 and an Android score of 4.7, and both platforms show good performance although minor inconsistencies are mentioned by Android users.
- Ally Bank has an iOS score of 4.7 and an Android score of 4.4, and iPhone users describe the app as easier to use while Android users feel it offers fewer useful features.
Adoption Rates of Android Phone Versions Statistics
As time passes, the distribution of Android versions on devices keeps changing as users upgrade and new versions are released. Here is a simple breakdown of how different Android versions have been used over time:
 (Reference: enterpriseappstoday.com)
July 2022:
- Android 11 was the most popular, with 29.63% of users.
- Android 12 was next, with 20.68%.
- Android 10 still had 21.8% of the market share.
- Android 13 had a tiny share of 0.01%.
- Older versions, such as 9.0 Pie, 8.1 Oreo, and 8.0 Oreo, made up 10.74%, 5.59%, and 2.62%, respectively.
- 0 Nougat, 6.0 Marshmallow, and 5.1 Lollipop had smaller shares of 2.62%, 2.32%, and 1.4%. Versions 7.1 Nougat and 4.4 KitKat held 1.42% and 0.52%, respectively.
October 2022:
- Android 12 gained ground and held 29.36%, surpassing Android 11 at 26.13%.
- Android 10 stayed at 19.12%, and Android 13 grew slightly to 0.68%.
December 2022:
- Android 12 decreased slightly to 28.22%, while Android 11 and Android 10 held 23.61% and 18.37%, respectively.
- Android 13 grew to 6.79%.
Early 2023:
- By January 2023, Android 12 was at 25.1%, while Android 11 had 23.03% and Android 10 had 17.75%.
- Android 13 grew to 11.84%.
April 2023:
- The market share remained similar, with Android 12 at 20.81%, Android 11 at 21.06%, and Android 10 at 16.65%.
- Android 13 continued to grow, reaching 19.98%.
July 2023:
- Android 12 dropped to 20.58%, and Android 11 was close behind with 19.98%.
- Android 10 fell to 9.27%, while Android 13 jumped to 30.33%.
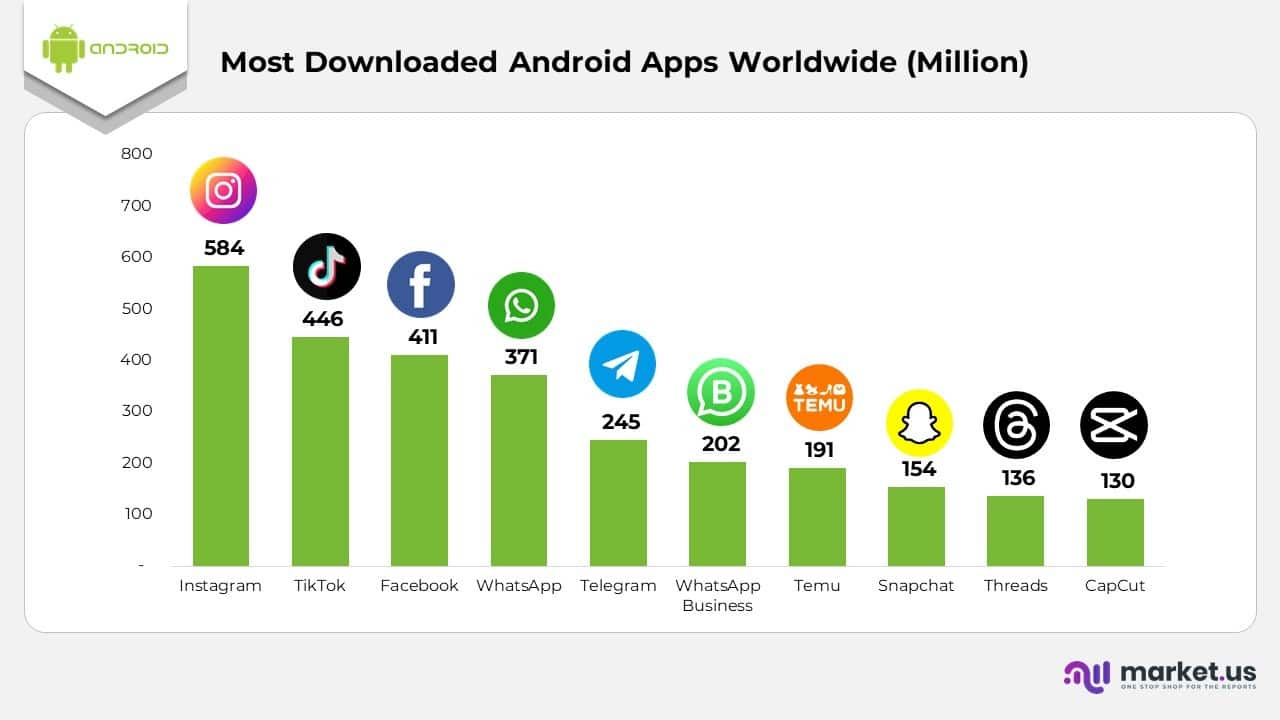
Most Downloaded Android Apps Worldwide Statistics
- Instagram recorded 584 million global Android downloads, underscoring its status as the most installed social app on Google Play.
- TikTok reached 446 million downloads, reflecting its strong pull among short-video users worldwide.
- Facebook secured 411 million installs on Android, keeping its position as one of the most widely used social platforms.
(Reference: Market.us)
- WhatsApp reached 371 million downloads, confirming its role as a leading global messaging tool.
- Telegram achieved 245 million downloads, supported by its rising demand for secure communication.
- WhatsApp Business crossed 202 million installs, with many small firms using it to handle customer interactions.
- Temu recorded 191 million downloads, showing fast adoption in low-cost online shopping.
- Snapchat reached 154 million installs, driven by its popularity among younger audiences.
- Threads recorded 136 million downloads as users looked for simple text-based conversations.
- CapCut reached 130 million installs, reflecting strong global demand for mobile video editing tools.
iPhone vs Android Statistics
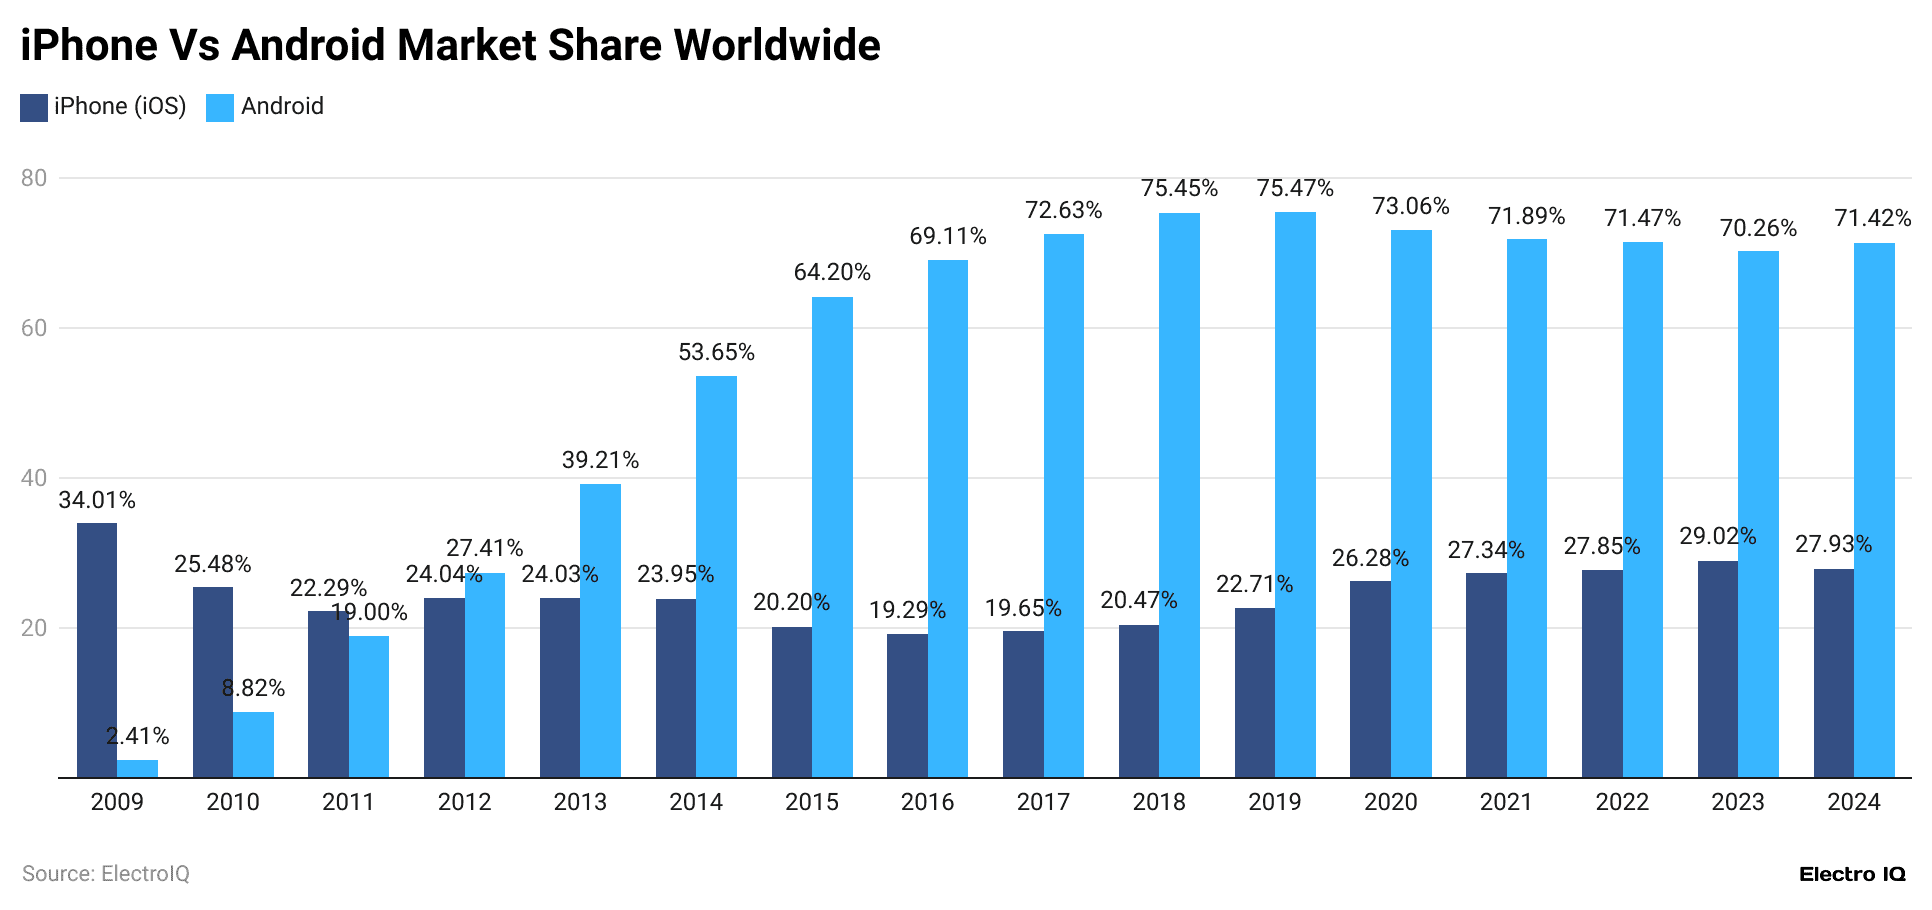
- As of early 2024, Android holds a 70.69% share of the global smartphone market. In the U.S., iPhones have a 60.77% market share.
- There are more than 1 billion active iPhones and over 3 billion active Android devices.
- In the fourth quarter of 2023, Android smartphones made up 56% of all global smartphone sales.
- Overall, Android remains the leading mobile operating system worldwide with a 70.69% market share, while iPhones (iOS) account for 28.58%.
 (Source: backlinko.com)
- As of February 2024, iPhones are the top mobile phones in the U.S., with a market share of 60.77%, while Android phones have 38.81%, as stated in Android Statistics.
- The highest Android market share was 46.42% in 2015, compared to 50.85% for iPhones/iOS that year.
 (Reference: backlinko.com)
- As of 2024, the App Store has about 1.8 million apps available for iPhone users to download. In comparison, Android users have access to 2.44 million apps on the Google Play Store.
- When it comes to spending, iPhone users are expected to spend $124 billion on apps, in-app purchases, and subscriptions in 2024, according to Android Statistics.
- Android users, on the other hand, are projected to spend $51 billion on apps in the Google Play Store.
- In total, iPhone users will account for 68.13% of global spending on mobile apps, while Android users will account for 31.87% of the total spending in 2024.
Conclusion
In summary, the latest Android Statistics provide useful insights into the changing mobile operating system market. Android 13 currently holds the largest market share at 24.2%, followed by Android 11 at 20.0%. This shows that many users are upgrading to newer versions of Android. The steady shift to newer versions highlights the importance of keeping up with updates and improvements to meet user expectations. Understanding these trends can help businesses and developers adjust their strategies to meet the needs of Android users. The data collected from more than 100 million unique users each month is crucial for making informed industry decisions.
From now on, businesses must stay adaptable to changing user preferences. By using these market insights, companies can make smart decisions and remain competitive in the fast-moving Android market.
Sources
FAQ.
In 2024, 71.85% of all mobile phones are using the Android operating system.
In 2023, Android made up 95.17% of the mobile operating system market in India, leaving Apple’s iOS far behind with only 3.98%. Android’s share grew quickly, jumping from just above 10% in 2012 to over 60% in just four years.
According to Counterpoint Research’s Global Handset Model Sales Tracker, the iPhone 15 became the world’s top-selling smartphone in the third quarter of 2024. It was followed by the iPhone 15 Pro Max and iPhone 15 Pro, which were second and third place, respectively.
In September 2024, Android controlled over 77% of the smartphone market in China, while Apple’s iOS had around 22%. Local brands make most smartphones in China, and these devices mainly use the Android operating system.

Maitrayee Dey has a background in Electrical Engineering and has worked in various technical roles before transitioning to writing. Specializing in technology and Artificial Intelligence, she has served as an Academic Research Analyst and Freelance Writer, particularly focusing on education and healthcare in Australia. Maitrayee's lifelong passions for writing and painting led her to pursue a full-time writing career. She is also the creator of a cooking YouTube channel, where she shares her culinary adventures. At Smartphone Thoughts, Maitrayee brings her expertise in technology to provide in-depth smartphone reviews and app-related statistics, making complex topics easy to understand for all readers.


