Data Breach Statistics By Industry, Cost And Facts (2025)
Updated · Jul 23, 2025


Table of Contents
- Introduction
- Editor’s Choice
- Breached Accounts Statistics
- Data Breach Statistics by Top 10 Countries
- By Industry
- By Organizations, 2024
- By Customers
- By Age Group
- Biggest Online Data Breaches Statistics (Till January,2025)
- Causes of Data Breaches Statistics
- Data Breach Cost Statistics
- By Industry
- By Country
- By Storage Location
- By AI and Automation Usage Level
- Top 5 Data Breaches Categories Statistics by Response Time
- Data Breach Statistics by Mean Time to Identify and Contain
- Insider Threats of Data Breach Statistics
- The Impact of Data Breaches Statistics
- Conclusion
Introduction
Data Breach Statistics: A data breach, also called data leakage, happens when personal information is shared or lost without permission. It includes things like names, addresses, passwords, credit card numbers, or health records. Such breaches can occur if someone inside a company shares it by mistake or on purpose, if an unprotected device is lost or stolen, if hackers break into systems using weak points, or if people are tricked through phishing to give away private data. The common causes of data breaches are human error, lost or stolen devices, cyberattacks, phishing attacks, and insider threats.
This article includes several statistical analyses taken from different sources that include breach types, global incidents of data breaches, industry-wide data breaches, regional impacts, causes, breach size, impacts, breach detection, consumer awareness, and future analysis.
Editor’s Choice
- According to Surfshark Research, in the second quarter of 2025, the total number of global breached accounts was around 93.6 million.
- On average, 22 out of every 100 people are affected each year.
- In the second quarter of 2025, the United States experienced the highest number of data breaches, with over 42.5 million accounts compromised, translating to 12,272 breaches per 100,000 people.
- Statista reports further that as of January 2025, Cam4’s March 2020 breach remains the biggest, leaking over 10 billion records.
- A report published by Zscaler also mentioned that in 2024, the average data breach cost rose to USD 4.88 million, up 10% from 2023.
- In the same period, the healthcare sector faced the most expensive data breaches, with an average cost of USD 9.77 million.
- The highest average breach cost was accounted for by the United States, at around USD 9.36 million.
- In 2024, data breaches caused by stolen or compromised credentials had the longest response time, taking an average of 229 days to identify (MTTI) and 63 days to contain (MTTC), totaling 292 days.
- According to Surfshark Research, in the first quarter of 2025, about 540 accounts were hacked every minute.
- The Forescout report shows that basic details breaches like names and addresses usually cost between USD 5 and USD 15.
- As of 2025, ransomware stands out as the most common cause of global data breaches, responsible for 252 incidents.
Breached Accounts Statistics
 (Reference: surfshark.com)
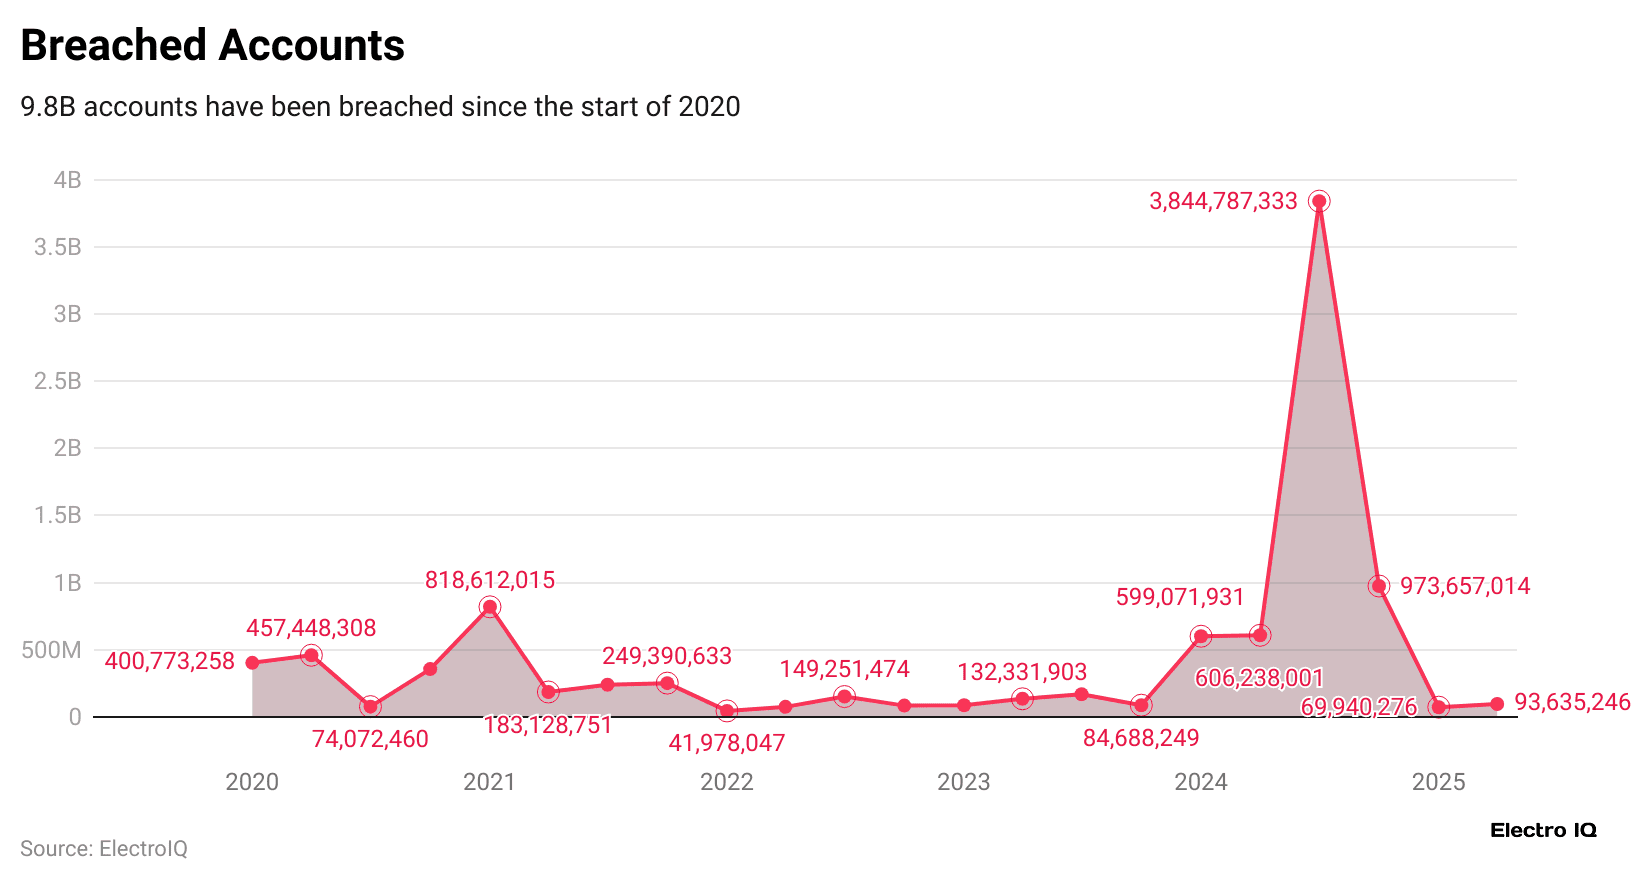
- Since 2020, 9.8 billion accounts have been breached, making up 42.4% of all global breaches since 2004.
- In the first quarter of 2025, the total number of global breached accounts was around 69.9 million, and by the end of Q2 2025, the number increased to 93.6 million.
The table below shows the total number of breached accounts in 2024
| Quarter | Number of accounts |
| Q1 |
599,071,931 |
|
Q2 |
606,238,001 |
| Q3 |
3,844,787,333 |
|
Q4 |
973,657,014 |
Data Breach Statistics by Top 10 Countries
| Country | Q1, 2025 | Breaches per 100,000 people | Country | Q2, 2025 | Breaches per 100,000 people |
| United States | 17,074,509 | 4,930 | United States | 42,507,430 | 12,272 |
| Russia | 4,364,921 | 3,022 | France | 11,438,097 | 17,174 |
| India | 4,216,527 | 289 | India | 1,692,213 | 116 |
| Germany | 3,927,283 | 4,653 | Germany | 1,288,430 | 1,526 |
| Spain | 2,450,082 | 5,114 | Israel | 1,229,360 | 13,006 |
| United Kingdom | 2,268,703 | 3,271 | Canada | 968,627 | 2,425 |
| France | 2,149,593 | 3,228 | United Kingdom | 943,956 | 1,361 |
| Canada | 899,754 | 2,252 | Thailand | 889,058 | 1,241 |
| Argentina | 790,733 | 1,727 | Brazil | 639,645 | 301 |
| South Sudan | 742,519 | 6,153 | China | 578,293 | 41 |
By Industry
- According to the HIPAA Journal, by March 19, 2025, a total of 734 major healthcare data breaches were reported to the OCR.
- The number of exposed healthcare records rose by 64.1% compared to last year, reaching 276.77 million, which is equal to about 81.38% of the U.S. population in 2024.
- That year, 14 separate breaches each affected over 1 million records.
- One of them became the largest healthcare data breach ever, exposing data of around 190 million people.
- Together, these 14 breaches compromised nearly 238 million records, impacting nearly 70% of U.S. residents.
- Help Net Security further states that around 46% of financial institutions had a data breach in 2024.
- In 2024, roughly 65% of financial organisations worldwide reported experiencing a ransomware attack, compared to 64% in 2023.
- IBM report states that on average, finance breaches take 168 days to identify and 51 days to contain, slightly faster than the global average of 194 and 64 days, respectively.
- According to Security Magazine, about 57% of small and medium businesses have faced a cybersecurity breach, and 31% were attacked in just the past year.
- Most of these breaches, around 71% started with phishing, while cloud setup mistakes caused 18% to 19% of the attacks.
- As per cybersecurity.asee.io, the average cost of a breach for SMBs in early 2025 is between USD 120,000 and USD 149,000.
By Organizations, 2024
| Name of Organization | Number of Data Breaches |
| Far Eastern Research Centre for Space Hydrometeorology | 2,000,000,000,000,000 |
| Baidu, Inc., Honour, Huawei, iFlytek, OPPO, Samsung Electronics, Tencent, Vivo, and Xiaomi Technology | Up to 1,000,000,000 |
| MOAB (mother of all breaches) | >26,000,000,000 |
| Discord (via Spy. pet) | 4,186,879,104 |
| Unknown Brazilian Organisation | >223,000,000 |
| Indian Mobile Network Consumer Database | 750,000,000 |
| 916 Google Firebase websites | 124,605,664 |
| Zenlayer | 384,658,212 |
| Pure Incubation | 183,754,481 |
By Customers
- According to Bluefin reports of 2024, the MOVEit service reported a data breach that affected around 77 million users.
- Ticketmaster faced one of the biggest breaches, exposing data of nearly 560 million customers, while Dell had 49 million users impacted.
- Smaller breaches also occurred, such as Tile with 450,000 users and Bank of America affecting about 57,000 customers.
By Age Group
| Age (Years) | Financial Loss Per Victim (USD) | Data Breach Victim Share |
| 40 to 59 | 2,000 | 40% |
| 20 to 39 | 1,500 | 35% |
| 60 & above | 2,500 | 20% |
| 20 & below | 1,000 | 5% |
Biggest Online Data Breaches Statistics (Till January,2025)
| Characteristic | Number of impacted users and breached records |
| Alibaba Data Breach (Jul 2022) | 1.1bn users |
| LinkedIn Data Breach (Jun 2021) | 700m users |
| Sociallarks Data Breach (Jan 2021) | 200m records |
| Cam4 Data Breach (Mar 2020) | 10.88bn records |
| First American Financial Corporation Data Breach (May 2019) | 885m users |
| Verifications.io Data Breach (Feb 2019) | 763m users |
| Facebook Data Breach (Apr 2019) | 533m users |
| Aadhaar Data Breach (Mar 2018) | 1.1bn people |
| Starwood (Marriott) Data Breach (Nov 2018) | 500m guests |
| Exactis Data Breach (Jun 2018) | 340m people |
| Twitter Data Breach (May 2018) | 330m users |
| Dubsmash Data Breach (Dec 2018) | 162m users |
| Yahoo Data Breach (2017) | 3bn accounts |
| Deep Root Analytics Data Breach (Jun 2017) | 200m U.S. voters |
| NetEase Data Breach (Oct 2015) | 234m users |
| Yahoo Data Breach (2014) | 500m accounts |
| MySpace Data Breach (Jun 2013) | 360m accounts |
| Court Ventures Data Breach (2013) | 200m personal records |
Causes of Data Breaches Statistics
 (Reference: forescout.com)
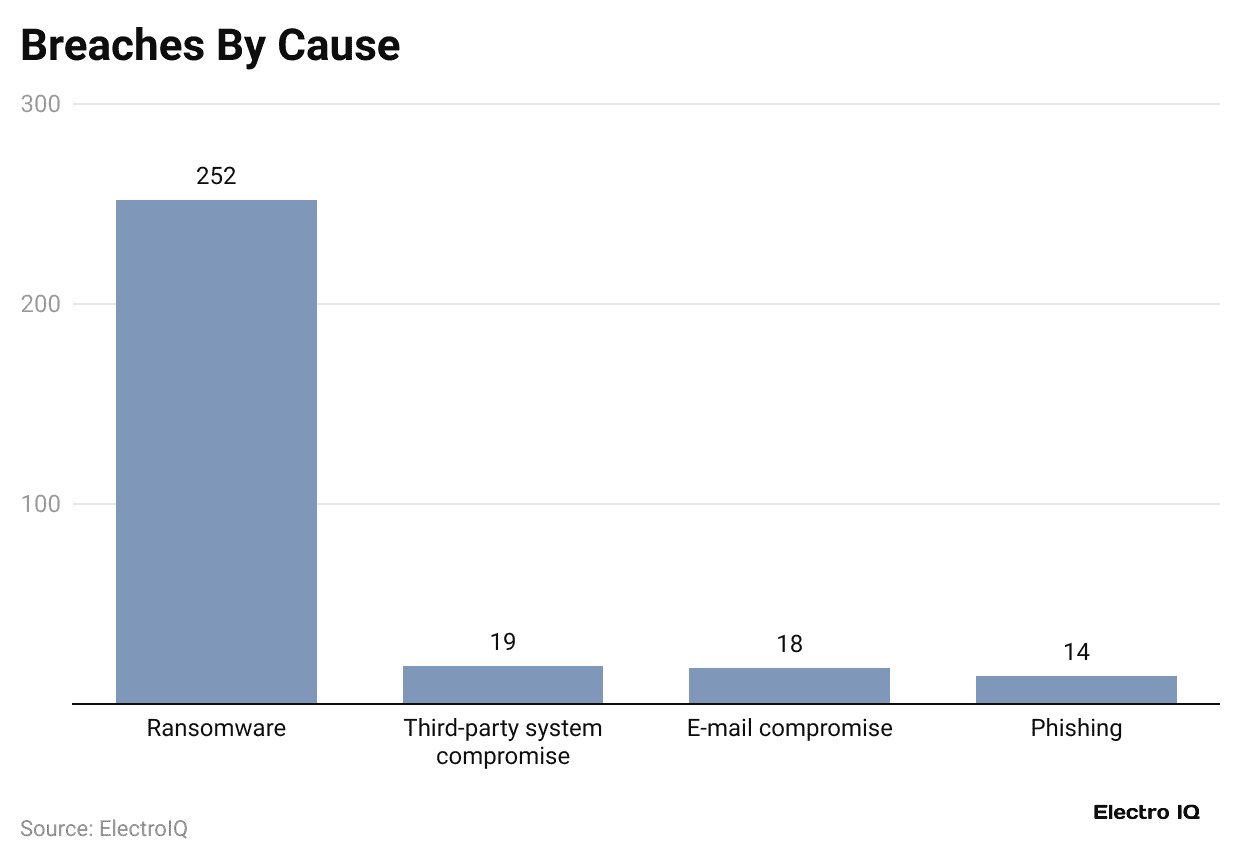
- As of 2025, ransomware stands out as the most common cause of global data breaches, responsible for 252 incidents.
- In comparison, third-party system compromises caused 19 breaches, while e-mail compromises were close behind with 18 incidents.
- In contrast, phishing attacks were linked to 14 breaches.
Data Breach Cost Statistics
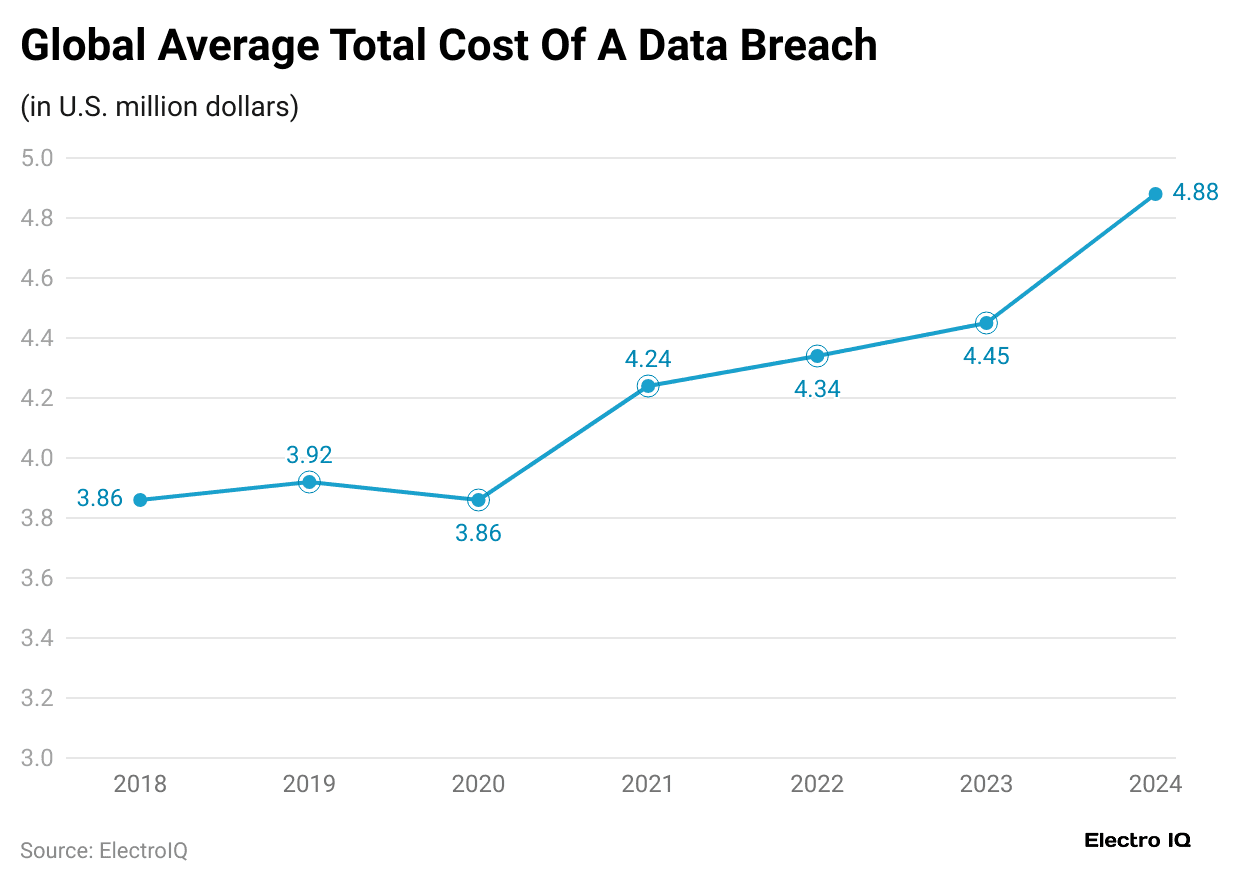
- In 2024, the average data breach cost rose to USD 4.88 million, up 10% from 2023, resulting in USD 4.45 million.
- CFO further states that about 35% of breaches involve “shadow data,” which is hidden or unmanaged information outside official IT control.
- Involving law enforcement in ransomware cases can save around USD 1 million.
- Breaches from stolen credentials take about 292 days to detect and fix.
- Security staff shortages rose by 26.2% in 2024, and the industrial sector faced the biggest cost increase, up to USDD 830,000 on average.
- According to Up Guard report analyses, the average cost of a data breach in 2023 was USD 4.45 million, a 2.3% increase from 2022’s cost of USD 4.35 million.
- Data breaches in public cloud systems caused the highest average loss, around USD 5.17 million, as per IBM.
- The Up Guard report also states that malware attacks caused losses of USD 5.24 million, and destructive attacks cost USD 5.13 million.
- Breaches fixed within 200 days cost around USD 3.93 million, but longer ones cost more than USD 4.95 million.
By Industry
 (Reference: cfo.com)
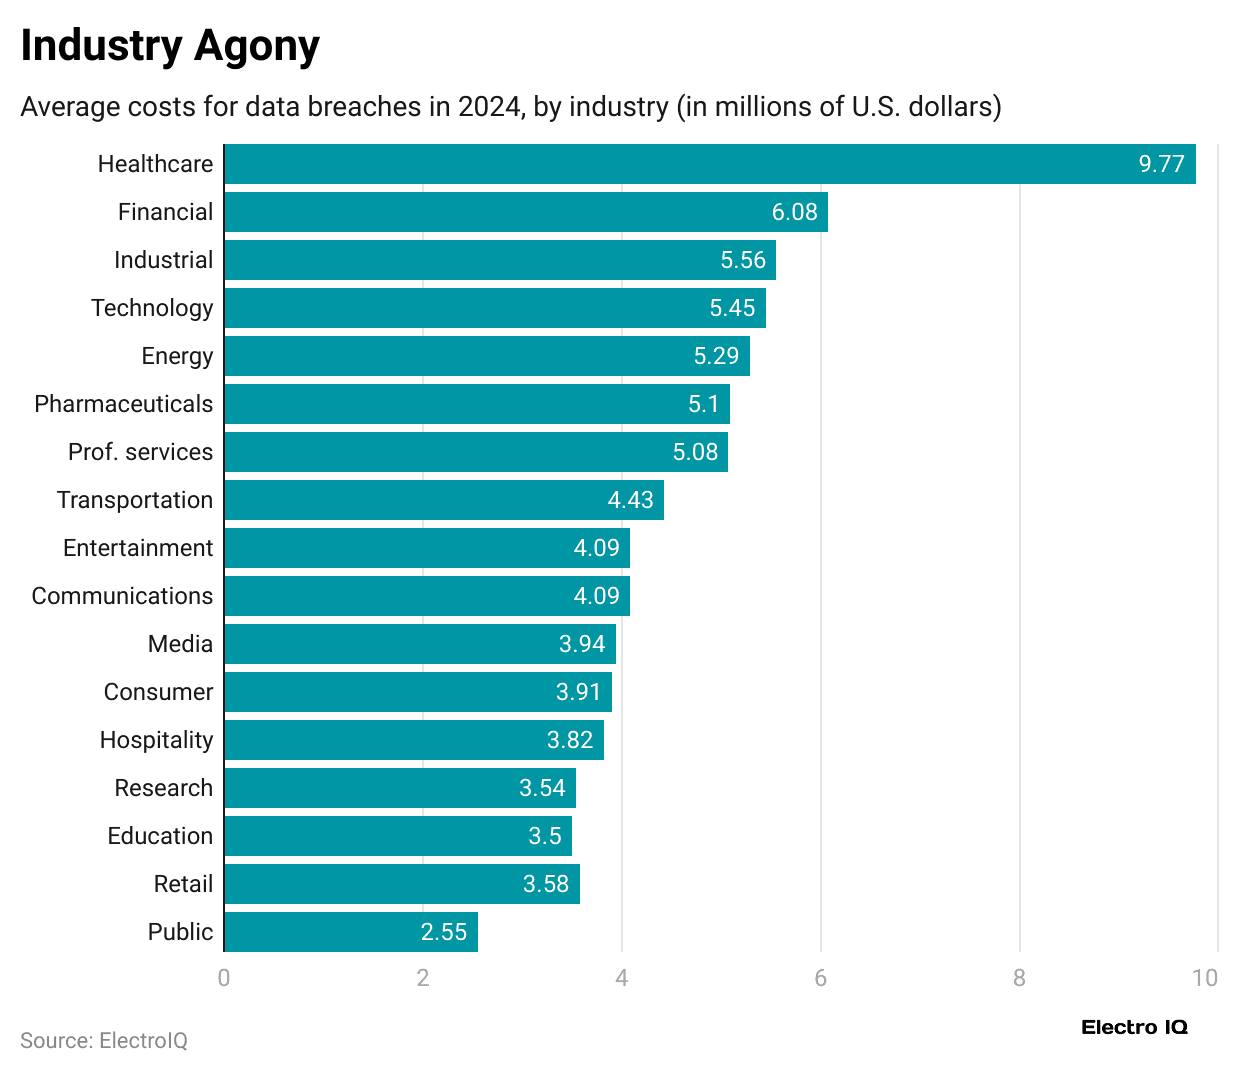
- As of 2024, the healthcare sector faced the most expensive data breaches, with an average cost of USD 9.77 million.
- The next two industries’ average data breach costs were the Financial sector (USD 6.08 million) and Industry (USD 5.56 million).
- Other industries with high breach costs included technology (USD 5.45 million), energy (USD 5.29 million), pharmaceuticals (USD 5.1 million), Prof. services (USD 5.08 million), Transportation (USD 4.43 million), Entertainment (USD 4.09 million), Communications (USD 4.09 million), Media (USD 3.94 million), Consumer (USD 3.91 million), Hospitality (USD 3.82 million), research (USD 3.82 million), education (3.5 million), retail (USD 3.58 million), and public (USD 2.55 million).
By Country
- According to a report published by zscaler.com, the highest average breach cost was accounted for by the United States, at around USD 9.36 million.
- Meanwhile, the Middle East region’s average cost per breach was USD 8.75 million, followed by Benelux (Belgium, the Netherlands, Luxembourg) with around USD 5.9 million.
- Other countries’ costs per data breach were Germany (USD 5.31 million), Italy (USD 4.73 million), and India (USD 2.35 million).
By Storage Location
 (Reference: zscaler.com)
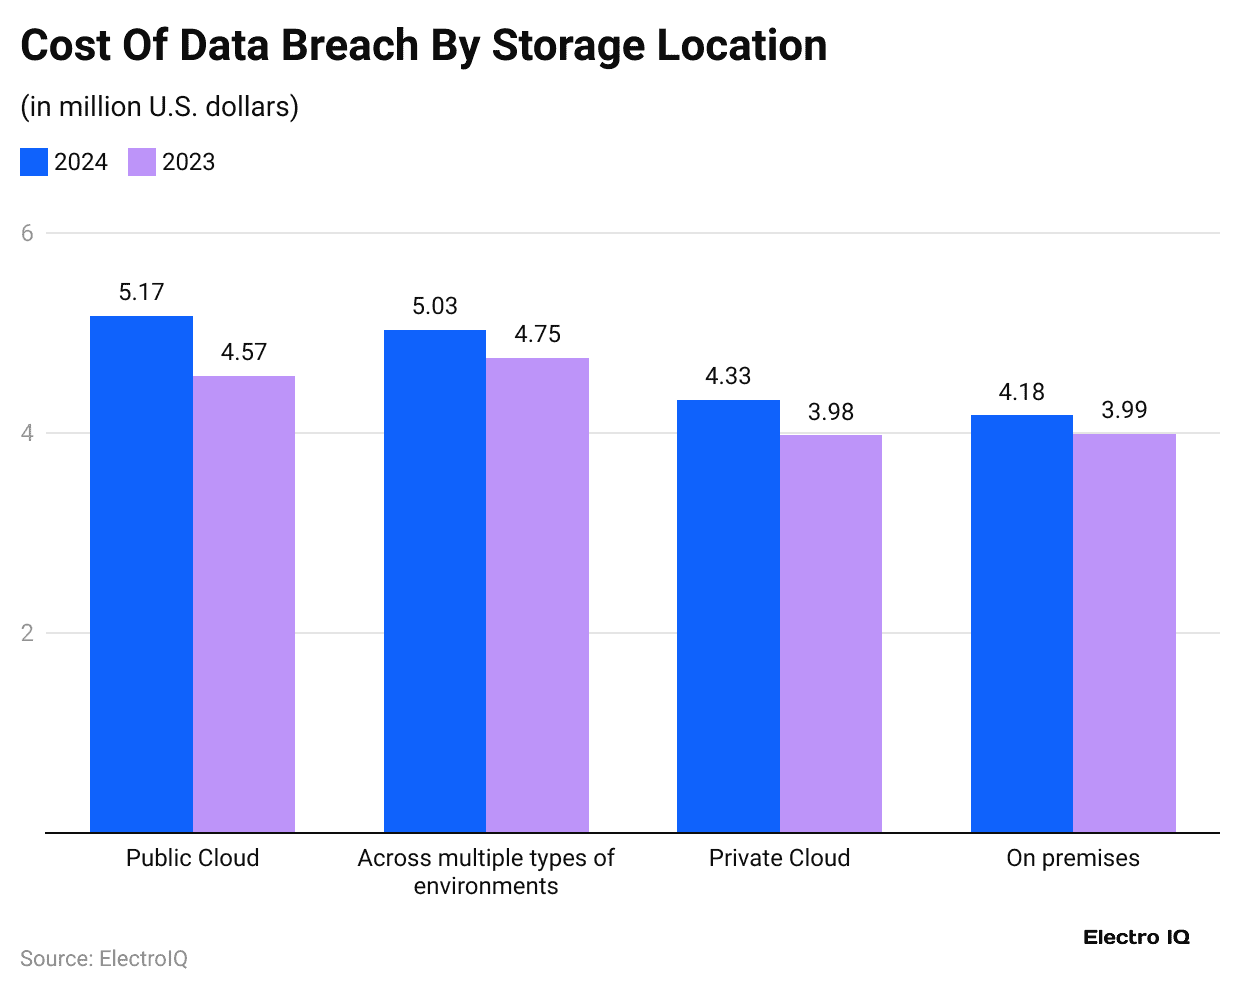
- The above graph also mentioned that in 2024, the most expensive breaches in public cloud environments resulted in USD 5.17 million, up from USD 4.57 million in 2023.
Furthermore, the cost of a data breach by other storage locations is stated in the table below:
| Storage location | 2024 (USD million) | 2023 (USD million) |
| Across multiple types of environments | 5.03 | 4.75 |
| Private cloud | 4.33 | 3.98 |
| On-premises | 4.18 | 3.99 |
By AI and Automation Usage Level
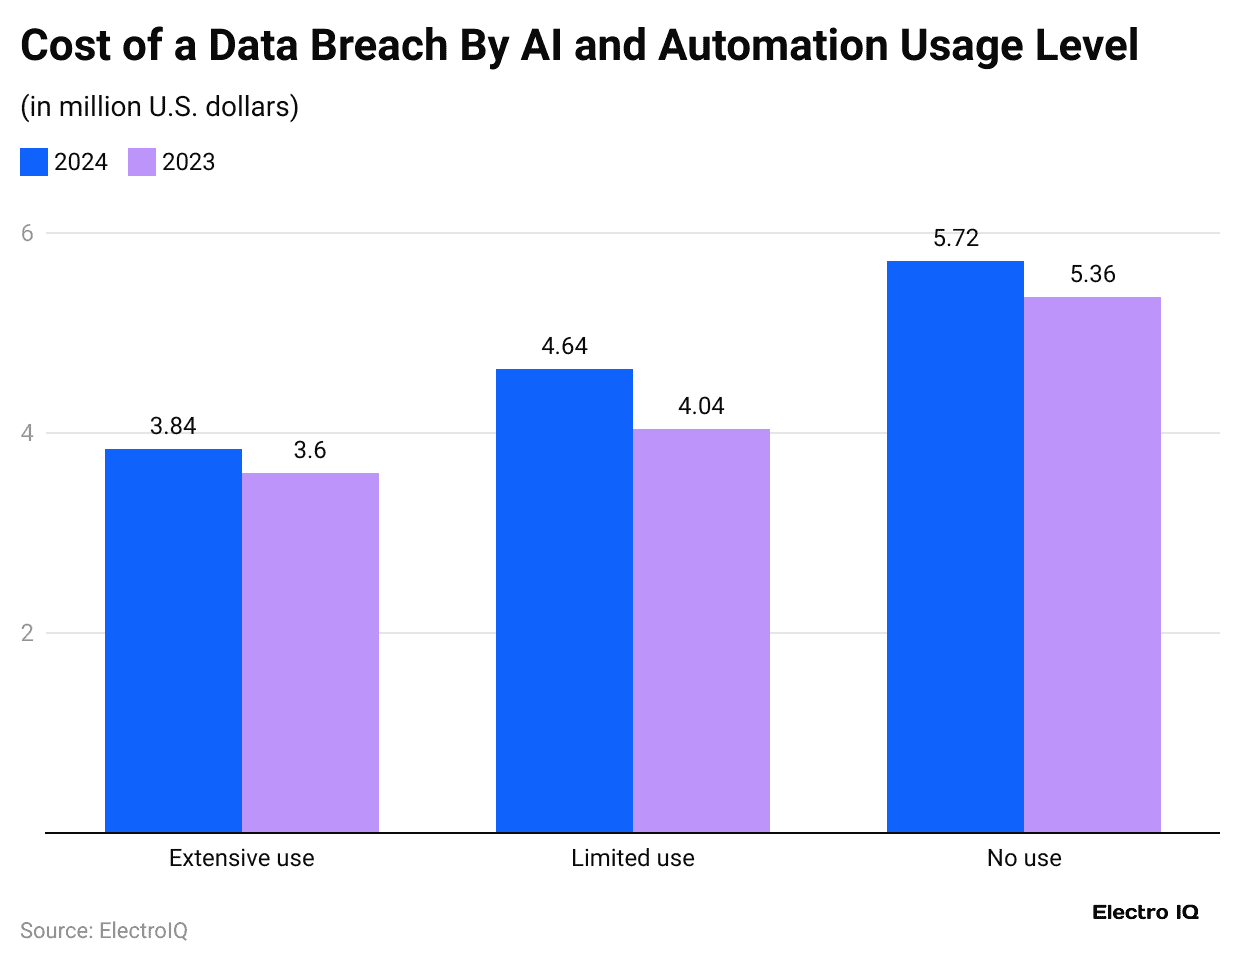
- As of 2024, organisations that made extensive use of AI and automation had the lowest average breach cost at USD 3.84 million, down from USD 3.60 million in 2023.
| AI and automation usage | 2023 (USD million) | 2024 (USD million) |
| Limited AI use | 4.04 | 4.64 |
| Never use AI or automation | 5.36 | 5.72 |
Top 5 Data Breaches Categories Statistics by Response Time
- As of 2024, data breaches from stolen or leaked login details took the most time to handle.
- On average, it took 229 days to discover and another 63 days to fix them, for a total of 292 days.
- Attacks from insiders came next, taking 219 days to detect and 68 days to stop.
- Phishing cases needed 195 days to find and 66 days to contain, adding up to 261 days.
- For social engineering attacks, the total response time was 257 days, with 197 days for detection and 60 days for containment.
- The fastest response was seen in breaches involving unknown zero-day vulnerabilities, taking 183 days to identify and 69 days to contain, totaling 252 days.
Data Breach Statistics by Mean Time to Identify and Contain
 (Reference: statista.com)
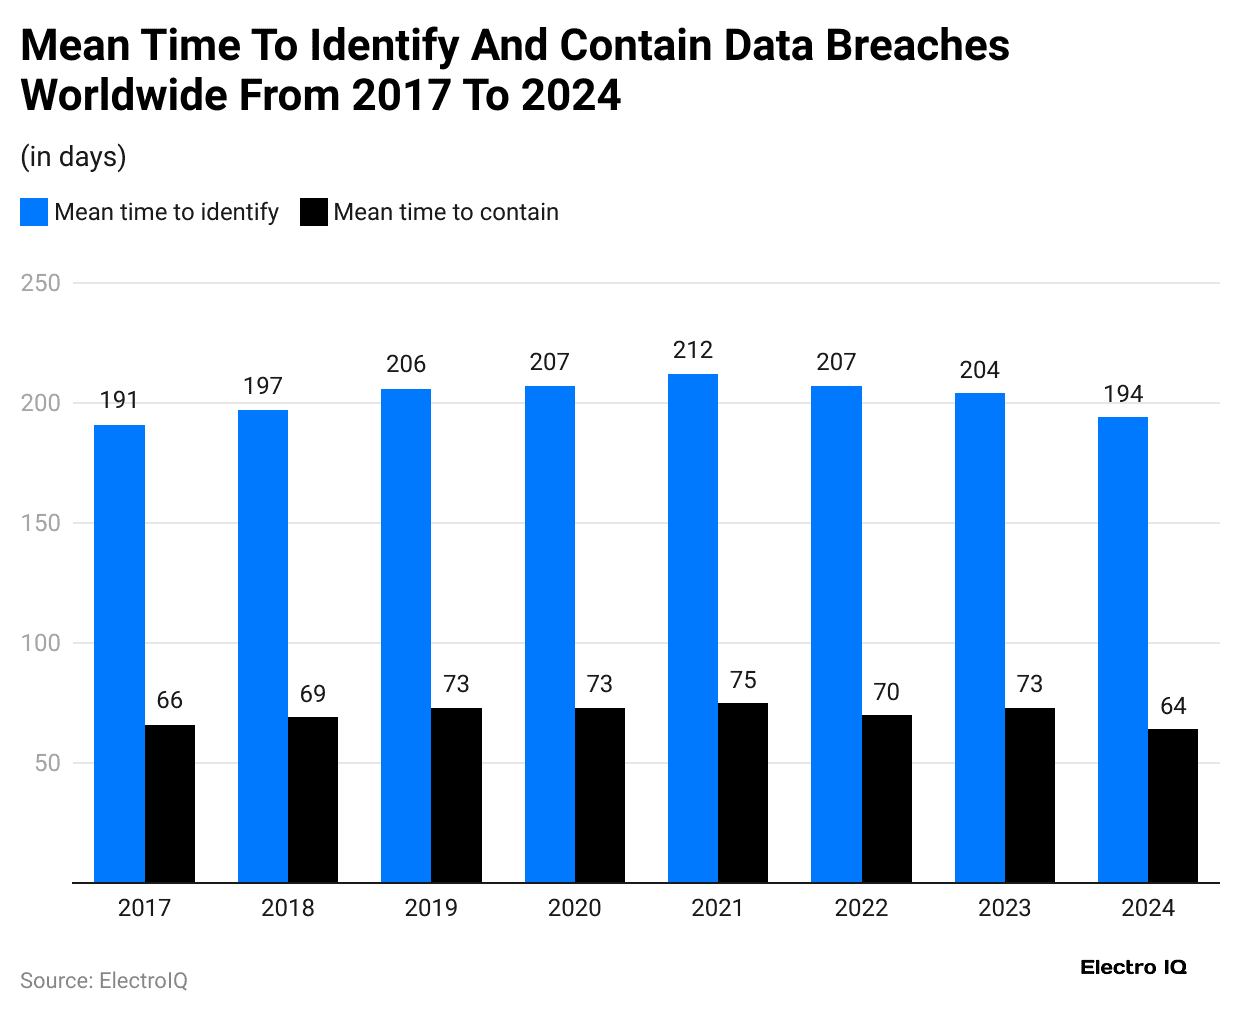
- A 2024 report by Statista shows that, on average, it took companies 194 days to find a data breach 4% faster than the year before.
- Once detected, they needed about 64 days to stop it.
Insider Threats of Data Breach Statistics
- According to Space Lift report analyses, dealing with a malicious insider attack costs around USD 4.99 million.
- These insider-driven incidents cost companies about USD 16.2 million every year and usually take 85 days to contain.
- Around 75% of data breach cases are caused by employees who make mistakes or are tricked by outsiders.
- As of 2024, in over 64% of financial firms, more than 1,000 sensitive files are open to all staff.
- Also, 59% have over 500 passwords that never expire, and nearly 40% have over 10,000 inactive accounts.
- About 12% of employees leave with private data like customer details, employee info, health records, or business contracts.
The Impact of Data Breaches Statistics
- The Forescout report shows that basic details breaches like names and addresses usually cost between USD 5 and USD 15.
- Complete identity sets with Social Security numbers and birth dates, known as “Fullz,” range from USD 20 to USD 100.
- Scanned passports sell for USD 100, and U.S. driver’s licenses go for around USD 150.
- Stolen credit card info costs anywhere from USD 15 to USD 120, while cloned cards with PINs are priced at USD 20 to USD 25.
- Hacked PayPal and Facebook accounts are sold for as low as USD 3.
Conclusion
After completing the article on Data Breach Statistics, it can be concluded that data breaches are currently termed as a growing threat in today’s digital world. In contrast, not all data breaches can be stopped, but if users remain alert and take smart steps, they can help protect both individuals and organizations from serious harm.
Staying informed and cautious is key to keeping your information safe. Go through the overall article, and all the above data analyses will provide you with an effective understanding of data breaches.
Sources
FAQ.
The three main types of data breaches are physical breaches, electronic breaches, and human error incidents.
The main source of data breaches is human error, especially through phishing attacks and weak passwords.
Data breaches are handled through a series of key steps such as Detection and Containment, Assessment and Investigation, Notification, Response and Recovery, and Prevention Measures.

Tajammul Pangarkar is the co-founder of a PR firm and the Chief Technology Officer at Prudour Research Firm. With a Bachelor of Engineering in Information Technology from Shivaji University, Tajammul brings over ten years of expertise in digital marketing to his roles. He excels at gathering and analyzing data, producing detailed statistics on various trending topics that help shape industry perspectives. Tajammul's deep-seated experience in mobile technology and industry research often shines through in his insightful analyses. He is keen on decoding tech trends, examining mobile applications, and enhancing general tech awareness. His writings frequently appear in numerous industry-specific magazines and forums, where he shares his knowledge and insights. When he's not immersed in technology, Tajammul enjoys playing table tennis. This hobby provides him with a refreshing break and allows him to engage in something he loves outside of his professional life. Whether he's analyzing data or serving a fast ball, Tajammul demonstrates dedication and passion in every endeavor.