DataOps Statistics By Market, Application, Country, Insights And Facts (2025)
Updated · Sep 13, 2025

Table of Contents
- Introduction
- Editor’s Choice
- DataOps Market Statistics
- By Component Analysis
- By Enterprise Size
- By Application
- United States DataOps Statistics
- DataOps Market Types Statistics
- Country-Wise Analysis in the Agile Development Segment (2025)
- In the DevOps Segment
- In the Lean Manufacturing Segment
- DataOps Market Statistics by Regional Analysis
- By Country Analysis, 2025
- DataOps Market Growth Statistics
- Top Use Cases of DataOps
- Benefits of DataOps
- Conclusion
Introduction
DataOps Statistics: DataOps is a working method that connects processes, tools, and practices to manage data in a better way. It takes ideas from agile software development and uses automation to make data analysis faster, more reliable, and easier to collaborate on. The key purpose is to improve quality, speed up delivery, and keep improving how organisations manage and use their data.
By using automation and agile thinking, teams can provide insights quickly and with more accuracy. As companies depend more on data for decision-making, DataOps adoption is spreading across many industries. Checking the latest statistics helps show how quickly it is growing, the areas where it is being used, and the benefits it brings to efficiency and innovation.
Editor’s Choice
- A report published by Industry Research states that the Global market size of DataOps Platform will reach around USD 953.56 million by 2025.
- About 68.5% of companies said automated data workflows helped them make decisions more quickly.
- Moreover, almost 65.2% of enterprise organisations deployed DataOps solutions across their data pipeline infrastructure.
- Around 54.9% of recent DataOps setups included AI-based tools for orchestration and monitoring.
- Nearly 41.2% of data teams found it difficult to manage
- The Asia-Pacific region made up 34.8% of global DataOps platform installations.
- In 2025, the top five providers together controlled 36.3% of the worldwide market.
- Meanwhile, Agile-focused platforms held the largest share at 39.2%, while DevOps-aligned solutions followed at 34.7%.
- From 2023 to 2025, about 46.1% of platforms added no-code or low-code features.
DataOps Market Statistics
- A report published by Industry Research states that the Global market size of DataOps Platform will reach around USD 953.56 million by 2025.
- The market is expected to hit USD 5992.97 million by 2034 with a CAGR of 22.66% from 2025 to 2034.
- Moreover, almost 65.2% of enterprise organisations deployed DataOps solutions across their data pipeline infrastructure.
- 4% of usage was for data integration and orchestration tasks.
- 6% of platform usage focused on real-time data processing.
- 1% of enterprises used cloud-native DataOps platforms for automation in hybrid environments.
- 7% of global data governance frameworks were enhanced with DataOps for compliance and security optimisation.
- In 2025, the highest number of DataOps deployments came from the Asia-Pacific region with 34.8%.
- Meanwhile, North America accounted for 28.3%, and Europe contributed 24.6% of the total share.
By Component Analysis
 (Reference: mordorintelligence.com)
- In 2024, DataOps platforms led the market share of 6%.
- Besides, services held 41.5% of revenue, emphasising demand for supporting tools alongside core platforms.
By Enterprise Size
- Mordor Intelligence report also shows that in 2024, large organisations captured 60.41% of revenue, investing heavily in comprehensive DataOps across units.
- SMEs are expected to grow at a 33.10% CAGR due to consumption-based pricing removing capital investment barriers.
By Application
 (Reference: mordorintelligence.com)
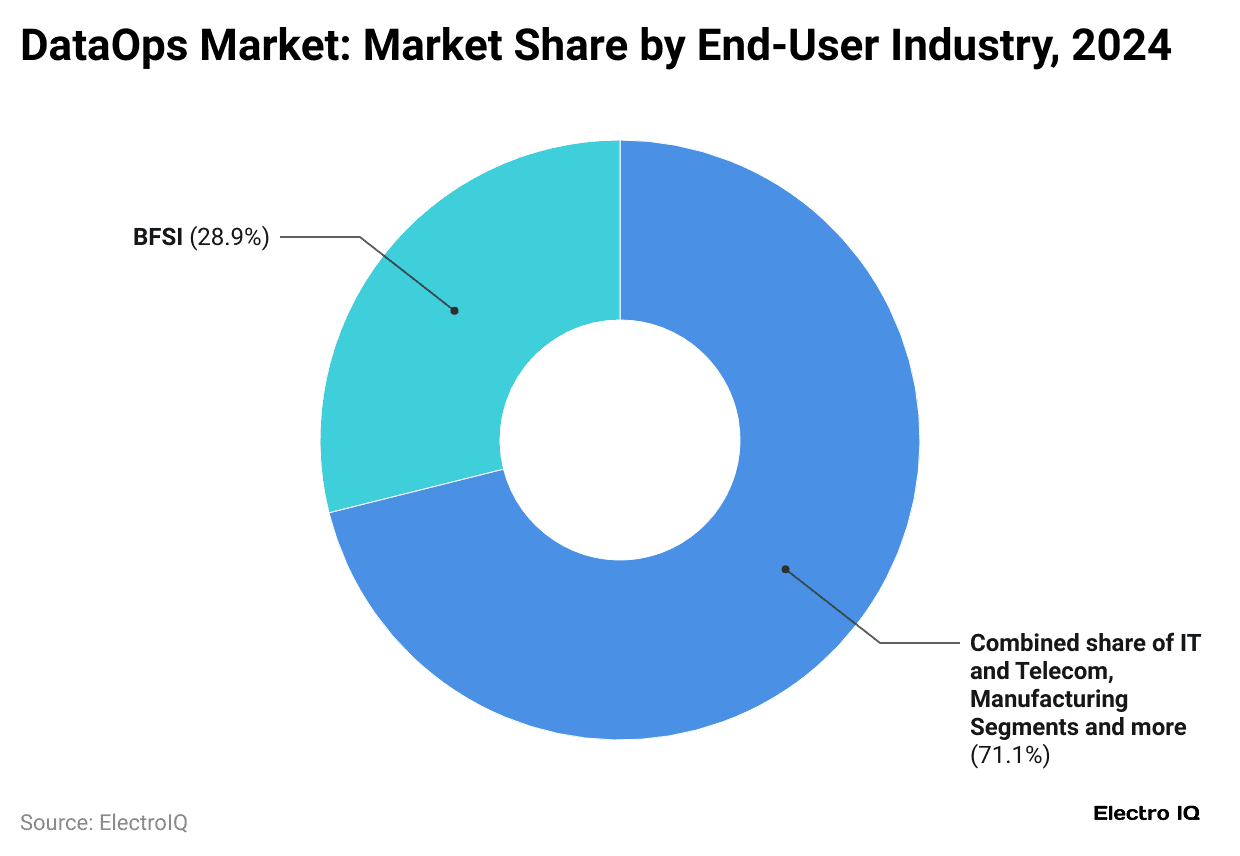
- As of 2024, the DataOps market was largely dominated by the combined IT, telecom, and manufacturing sectors, which together held 71.1% of the market share.
- The BFSI (Banking, Financial Services, and Insurance) sector accounted for the remaining 28.9%.
United States DataOps Statistics
- As mentioned in industryresearch.biz, DataOps adoption reached 71.4% of Fortune 1000 companies by the end of 2025.
- Meanwhile, almost 62.2% of U.S. DataOps platforms included data cataloguing capabilities for compliance with privacy laws.
- 6% of organisations used DataOps for cloud migration and hybrid architecture management.
- 9% of national demand came from financial services and healthcare industries.
- CI/CD pipelines improved data release frequency by 39.4% across major enterprises.
- AI integration within DataOps platforms increased by 28.7%, improving automated anomaly detection.
DataOps Market Types Statistics
| Platform Type | Market Share | Industry Adoption | Features |
| Agile Development | 39.2% | 61.5% in the software and service industries |
● Sprint-based data release cycles improved velocity by 27.1%. ● User story-driven pipeline changes are used by 42.6% of teams for faster iteration. |
|
DevOps-aligned |
34.7% | 58.9% of enterprises use CI/CD automation | ● Integrated GitOps workflows in 36.4% of installations.
● Rollback times reduced by 24.8%. ● Deployment success improved by 32.5%. |
| Lean Manufacturing | 26.1% | Widely used in manufacturing and healthcare |
● 48.3% installations emphasised data flow standardisation. ● 33.7% included automated quality checkpoints. |
Country-Wise Analysis in the Agile Development Segment (2025)
| Country | Market Size (USD million) | Market share | CAGR (2025 to 2034) |
| United States | 152.44 | 37.3% |
22.8% |
|
Germany |
78.33 | 19.2% | 22.6% |
| India | 63.36 | 15.5% |
23.1% |
|
United Kingdom |
57.84 | 14.1% | 22.7% |
| Canada | 56.86 | 13.9% |
22.5% |
In the DevOps Segment
| Country | Market Size (USD million) | Market share | CAGR (2025 to 2034) |
| United States | 131.70 | 38.7% | 22.6% |
| China | 67.38 | 19.8% | 22.8% |
| France | 51.08 | 15% | 22.4% |
| Japan | 46.98 | 13.8% | 22.2% |
| Australia | 43.38 | 12.7% | 22.3% |
In the Lean Manufacturing Segment
| Country | Market Size (USD million) | Market share | CAGR (2025 to 2034) |
| Germany | 67.18 | 32.9% | 22.1% |
| United States | 59.50 | 29.1% | 22.5% |
| Japan | 34.71 | 17% | 22.2% |
| South Korea | 25.73 | 12.6% | 22.4% |
| India | 17.09 | 8.4% | 22.6% |
DataOps Market Statistics by Regional Analysis
#1. North America
- As mentioned in Iindustryresearch.biz as of 2025, North America held 28.3% of the global DataOps Platform Market, led by the United States with 87.6% of regional installations.
- The region generated USD 396.98 million, representing 41.6% of the global market, with a growth rate of 22.5% CAGR driven by cloud-native and AI/ML automation.
- Financial services, healthcare, and e-commerce together accounted for 61.2% of DataOps platform usage.
- Meanwhile, real-time analytics pipelines grew 34.5%, hybrid architecture adoption rose 29.6%, AI-integrated platforms were deployed by 41.9% of enterprises, and 52.7% used metadata-driven orchestration tools.
#2. Europe
- In 2025, the European market generated USD 276.33 million, representing 29% of the global market and is projected to grow at a CAGR of 22.4% from 2025 to 2034.
- This region accounted for 24.6% of the DataOps market, with Germany, the UK, and France driving 68.4% of regional platform deployments.
- DataOps adoption in compliance-heavy sectors increased by 33.5%, while GDPR-compliant platforms made up 57.6% of installations.
- Integration with open-source ecosystems grew 21.9%, and DevOps-aligned frameworks were used in 38.3% of deployments.
#3. Asia Pacific
- This year, the Asia DataOps market will generate USD 211.78 million, holding 22.2% market share and an expected CAGR of 22.8%.
- This region’s market is supposed to dominate with a share of 34.8%, led by China, India, and Japan, which accounted for 73.2% of regional adoption.
- Manufacturing use cases grew 29.1%, cloud-native platform usage rose 36.8%, and AI-driven anomaly detection was implemented in 42.5% of workflows.
- Low-code adoption reached 24.6%, with SME integration up 31.3%.
#4. Middle East and Africa
- By the end of 2025, the Middle East and African market will generate USD 68.47 million, capturing 7.2% of the global market, with a projected CAGR of 22.4%.
- Meanwhile, it held 12.3% of the global DataOps market, led by the UAE, Saudi Arabia, and South Africa.
- Telecom and logistics sectors accounted for 45.7% of platform usage.
- On-premises to hybrid cloud transitions rose 27.4%, regulatory-driven deployments increased 18.2%, and government digitalisation initiatives drove 22.8% growth in projects.
By Country Analysis, 2025
| Country | Market Size (USD million) | Market share | CAGR (2025 to 2034) |
| United States | 310.74 | 78.3% | 22.6% |
| Germany | 97.61 | 35.3% | 22.4% |
| China | 74.89 | 35.4% | 22.9% |
| France | 66.44 | 24% | 22.3% |
| India | 59.98 | 28.3% | 23.0% |
| United Kingdom | 54.17 | 19.6% | 22.5% |
| Japan | 38.23 | 18% | 22.1% |
| Netherlands | 31.93 | 11.6% | 22.2% |
| Spain | 26.18 | 9.5% | 22.4% |
| South Korea | 25.37 | 12% | 22.6% |
| United Arab Emirates | 20.17 | 29.5% | 22.6% |
| Saudi Arabia | 16.84 | 24.6% | 22.7% |
| Canada | 43.25 | 10.9% | 22.4% |
| Mexico | 22.57 | 5.7% | 22.7% |
| Singapore | 13.31 | 6.3% | 22.5% |
| South Africa | 12.59 | 18.4% | 22.5% |
| Cuba | 10.28 | 2.6% | 22.3% |
| Nigeria | 10.21 | 14.9% | 22.3% |
| Dominican Republic | 10.14 | 2.5% | 22.4% |
| Egypt | 8.66 | 12.6% | 22.2% |
DataOps Market Growth Statistics
By Drivers
- By 2025, 67.1% of enterprises will have adopted DataOps for live dashboards, cutting analytics latency by 43.2%.
- E-commerce, logistics, and fintech increased real-time decisions by 31.9%.
- Cloud-native platforms rose 52.7% for hybrid orchestration, while 36.4% integrated DataOps for observability, enabling a 45.6% boost in overall data cycle efficiency.
By Restraint
- In 2024, 41.2% of data teams reported environment inconsistencies, while dual-cloud setups caused 24.7% more pipeline configuration errors.
- About 33.9% of deployments faced challenges with data lineage synchronisation.
- Meanwhile, 39.5% of organisations delayed production due to cross-platform orchestration.
- Security enforcement across diverse layers triggered a 29.6% rise in governance exceptions.
By Opportunity
- Almost 7.2% of platforms implemented data masking or encryption for GDPR, HIPAA, and SOC 2 compliance in 2024, while 51.9% used data classification systems.
- Automated audit logging and version tracking boosted accountability by 34.6%.
- Financial services and healthcare drove 38.4% of governance-focused DataOps, and zero-trust access grew 27.5% for secure collaboration.
By Challenge
- In the same duration, around 44.1% of companies struggled to hire DataOps-skilled engineers, while platform-specific training time rose 31.8%.
- Low-code/no-code adoption reached 28.6%, easing coding demands.
- Meanwhile, 36.7% of teams faced challenges with dynamic pipelines and event triggers, and integrating legacy systems led to 22.9% more manual intervention during failures.
Top Use Cases of DataOps
- Whenever there is a continuous flow of unstructured or semi-structured data, they rely on streaming pipelines to process it in real time.
- Core processes like ETL, ELT, and reverse ETL must scale efficiently to handle large amounts of data without delays.
- They monitor the health of data pipelines for enterprise analytics, AI, and ML projects to spot and fix problems quickly.
- Running several AI projects or LLM models can make cloud costs rise rapidly.
- Creating AI/ML models and training LLMs for generative AI depends entirely on a consistent supply of high-quality, trustworthy data.
Benefits of DataOps
- DataOps automates tasks such as cleaning, transforming, and checking data, reducing mistakes and improving reliability.
- It uses automation and continuous integration to save time and resources in data preparation, integration, and analysis.
- Encourages collaboration by connecting different data teams and improving communication.
- Applies agile methods to quickly adapt to changing business and data needs.
- Supports faster, data-driven decision-making.
- Helps drive innovation and gain a competitive edge.
- Simplifies data pipelines and adds context for easier insights.
Conclusion
After covering up the article, DataOps is changing the process of doing business and how companies are handling, managing, and making sense of their data. By the end of 2025, more businesses across different industries are likely to adopt it as they see the clear advantages it offers. This growth comes from the need for faster analytics, real-time insights, and smoother operations.
By using cloud-based platforms, automation, and AI, businesses can make quicker and smarter decisions. These trends show that DataOps will remain an essential approach for organisations that want to stay competitive and succeed in a world where data plays a key role.
FAQ.
DataOps was coined by Lenny Liebmann in 2014, inspired by Agile and DevOps principles for data management.
Implement DataOps by automating pipelines, ensuring data quality, monitoring workflows, fostering collaboration, integrating CI/CD, and enabling continuous improvement.
Collaboration, automation, continuous integration, monitoring, quality, and agility ensure efficient, reliable, and scalable data operations.
The four primary components of DataOps are data integration, data quality, pipeline automation, and monitoring.
The lifecycle involves planning, building, testing, deploying, monitoring, and continuously improving data pipelines for efficiency.

Maitrayee Dey has a background in Electrical Engineering and has worked in various technical roles before transitioning to writing. Specializing in technology and Artificial Intelligence, she has served as an Academic Research Analyst and Freelance Writer, particularly focusing on education and healthcare in Australia. Maitrayee's lifelong passions for writing and painting led her to pursue a full-time writing career. She is also the creator of a cooking YouTube channel, where she shares her culinary adventures. At Smartphone Thoughts, Maitrayee brings her expertise in technology to provide in-depth smartphone reviews and app-related statistics, making complex topics easy to understand for all readers.