Table of Contents
- Introduction
- Editor’s Choice
- General DeFi Statistics
- DeFi Growth Statistics
- DeFi Market Statistics
- Blockchain Market Volume
- Defi Adoption By Country
- The Technology Used By Defi Companies
- Acceptance of Cryptocurrencies as Payment
- Biggest DeFi Cryptocurrency Exchanges
- Ethereum Desktop Traffic By Country
- Most Used Crypto Hedge Fund
- Market Cap of Defi
- Popular Defi Coins
- Conclusion
Introduction
Defi Statistics: Decentralized Finance (DeFi) represents a transformative approach in the financial sector, leveraging blockchain technology and cryptocurrencies to facilitate peer-to-peer transactions without intermediaries. This financial model system is increasingly gaining popularity across various entities, driving direct interactions and eliminating traditional third-party roles in financial operations.
As of 2022, the DeFi ecosystem is not uniformly developed across all services; it predominantly thrives in the domains of money exchange and crypto lending. The Total Value Locked (TVL), which indicates the overall value maintained within these services, is significantly higher for these sectors, amounting to billions of United States Dollars. In contrast, decentralized payment and insurance services command a smaller market share, reflecting their nascent stage and limited practical applications for most consumers.
However, the landscape may evolve with advancements in the metaverse and increased integration of real-world items through asset tokenization. Currently, the DeFi sector only represents a few percent of the total cryptocurrency market, but its potential for growth remains robust as it aligns with broader Web3 developments.
Editor’s Choice
- Bitcoin has a market capitalization of approximately USD 800 billion.
- The DeFi market cap reached its peak at USD 3,082.4 million in July 2021.
- Chainlink holds the highest market cap among DeFi coins at USD 11.34 billion.
- The global blockchain market is expected to grow to over USD 65 billion by 2026.
- Global blockchain spending is forecasted to reach USD 19 billion by 2024.
- Ethereum dominates the blockchain market with a 56.2% market share.
- Tron holds a 9.2% share of the blockchain market.
- Solana maintains a 6% market share in decentralized platforms.
- Uniswap leads cryptocurrency exchanges with a 7-day trading volume of USD 11,630.61 million.
- There is approximately USD 52 billion of value locked in DeFi.
- The United States leads global DeFi adoption with an index score of 1.0.
- The United States accounts for 26.52% of Ethereum desktop traffic.
- Big Data is utilized by 87% of fintech companies in technology implementation.
- AI is employed by 82% of fintech companies.
- Knowledge graphs are used by 50% of fintech companies.
- Uniswap is the most used platform by crypto hedge funds at 75%.
- dYdX is utilized by 40% of crypto hedge funds.
- Retail and luxury goods sectors show an 80% acceptance rate for cryptocurrency payments.
General DeFi Statistics
- DeFi’s Total Value Locked (TVL) is approximately USD 42 billion, which represents a sharp decline of 76% from USD 177 billion at the beginning of 2022.
- Ethereum maintains a dominant position in the DeFi ecosystem, accounting for over 58% of the total liquidity.
- The largest DeFi exploit of 2022 was the Ronin bridge hack in March, which resulted in the loss of 173,600 ETH and $25.5 million in USDC, valued at over $600 million at that time.
- The global blockchain venture market is projected to reach USD 67.4 billion by 2026, fueled by increased venture capital funding and greater adoption of blockchain technology in payments, banking, and cybersecurity solutions.
- MetaMask, the most popular non-custodial DeFi wallet, has over 30 million users and 21 million monthly active users, representing an astounding growth of 3,800% since 2020.
- In 2022, for the first time, an institution, JPMorgan, conducted its first cross-border transaction using DeFi on a public blockchain.
DeFi Growth Statistics
- As of January 2024, USD 55.95 billion is locked in DeFi platforms, reflecting significant growth compared to USD 9.1 billion in July 2020 and USD 25.2 billion in December 2020.
- DeFi’s Total Value Locked (TVL) increased over 5x between July 2020 and January 2024, despite fluctuations in cryptocurrency investments.
- Global blockchain spending has grown 7x over four years, reaching USD 19 billion in 2024, up from USD 1 billion in 2018.
- The blockchain technology market is expected to grow to USD 67.4 billion by 2026, up from USD 1.2 billion in 2018 and USD 12.7 billion in 2022.
- As of January 2024, there are 8,992 cryptocurrencies available for trade, a significant increase from 5,840 in September 2021 and only 66 in 2013.
- Blockchain wallet users worldwide have surpassed 85 million, up from 45 million in January 2020, marking an increase of nearly 40 million in three years.
| Milestone (Blockchain wallet users) | Achieved (Month, Year) |
| 1 million | January 2014 |
| 5 million | December 2015 |
| 10 million | December 2016 |
| 20 million | December 2017 |
| 30 million | November 2018 |
| 40 million | June 2019 |
| 50 million | June 2020 |
| 60 million | November 2020 |
| 70 million | March 2021 |
| 80 million | December 2021 |
- Cryptocurrency theft increased by more than 9x between 2020 and 2021, with one incident in August 2021 resulting in a USD 610 million loss.
- Global blockchain spending nearly doubled from USD 1.5 billion in 2018 to USD 2.7 billion in 2019, showcasing rapid adoption and investment.
- The blockchain market value was estimated at USD 23.3 billion in 2023, USD 7 billion in 2021, and USD 3 billion in 2020, illustrating exponential growth year-over-year.
- Cryptocurrency investment, while down from its peak in late 2021, remains significantly higher than in 2020, highlighting ongoing interest and market resilience.
DeFi Market Statistics
- Bitcoin remains the most valuable cryptocurrency, with a market cap of approximately USD 892 billion and a price of USD 45,505.81 as of January 2024.
- Ethereum is the second most valuable cryptocurrency, with a market cap of USD 288 billion, making Bitcoin’s market cap over 3 times larger than Ethereum’s.
- Tether (USDT) is the most traded cryptocurrency by 24-hour trade volume, with a value of USD 51.69 billion, representing almost 50% more volume than any other cryptocurrency.
- Bitcoin follows as the second-most traded cryptocurrency, with a 24-hour trade volume of USD 32.73 billion, while Ethereum ranks third with nearly USD 11 billion in trade volume.
- The overall cryptocurrency market cap peaked at USD 2.91 quadrillion in November 2021, marking a significant increase from USD 20 trillion in January 2017 and surpassing USD 1 quadrillion in February 2021.
- Bitcoin’s market share was 66% in 2020, and as of January 2024, it continues to hold a dominant position over other cryptocurrencies, with its market cap more than 3 times that of Ethereum.
Here is a breakdown of the top 20 coins by market cap (to the nearest billion):
| Rank | Coin | Market Cap (January 2024) |
| #1 | Bitcoin | $890 billion |
| #2 | Ethereum | $288 billion |
| #3 | Tether | $92 billion |
| #4 | Solana | $49 billion |
| #5 | BNB | $49 billion |
| #6 | XRP | $34 billion |
| #7 | USDC | $25 billion |
| #8 | Cardano | $22 billion |
| #9 | Avalanche | $15 billion |
| #10 | Dogecoin | $13 billion |
| #11 | Polkadot | $11 billion |
| #12 | Tron | $10 billion |
| #13 | Polygon | $10 billion |
| #14 | Chainlink | $9 billion |
| #15 | Toncoin | $8 billion |
| #16 | Shiba Inu | $6 billion |
| #17 | Internet Computer | $6 billion |
| #18 | Litecoin | $6 billion |
| #19 | Dai | $5 billion |
| #20 | Bitcoin Cash | $5 billion |
- Five cryptocurrencies process over 100,000 transactions daily, including Stellar (XLM), which peaked at over 7.1 million trades per day, and Ethereum (ETH) and Ripple (XRP), each involved in over 1 million daily trades. Bitcoin (BTC) and Litecoin (LTC) also recorded over 100,000 transactions daily as of December 2021.
Blockchain Market Volume
(Reference: statista.com)
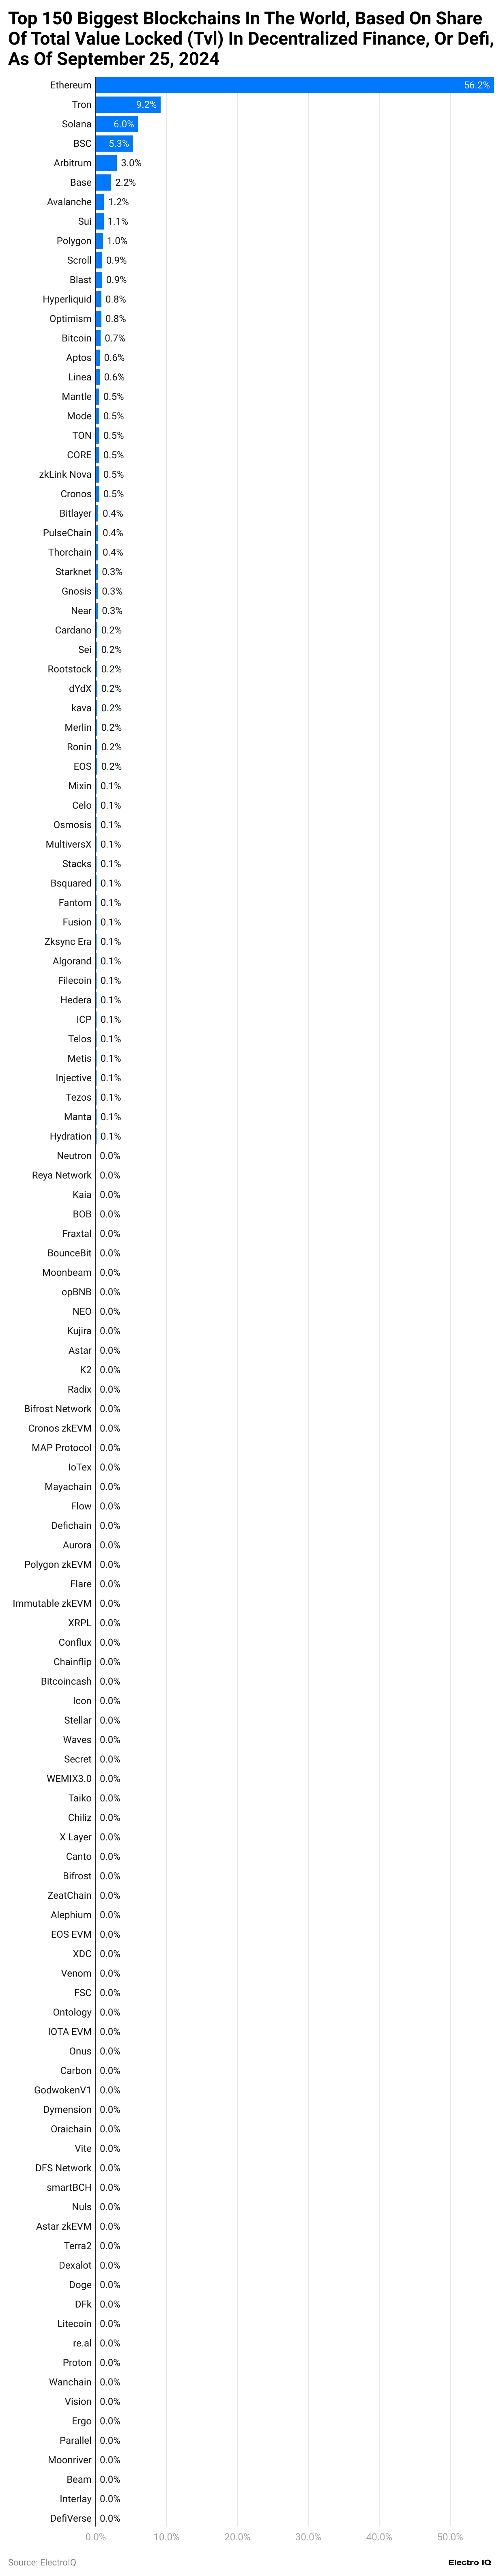
Top 150 Biggest Blockchains in Decentralized Finance (DeFi) Based on Total Value Locked (TVL) as of September 25, 2024:
- Ethereum: Holds the highest market share among decentralized platforms with 56.2%.
- Tron Accounts for 9.2% of the market share in decentralized platforms.
- Solana: Contributes 6% to the total market share.
- Binance Smart Chain (BSC): Represents 5.3% of the decentralized platforms’ market share.
- Arbitrum: Has a market share of 3%.
- Base: Comprises 2.2% of the market.
- Avalanche: Accounts for 1.2% of the total market share.
- Sui: Holds 1.1% of the decentralized platforms’ market.
- Polygon: Makes up 1% of the market share.
- Scroll: Represents 0.9% of the total market share.
- Blast: Also holds 0.9% of the market share.
- Hyperliquid: Commands 0.8% of the market share.
- Optimism: Holds 0.8% of the decentralized platforms’ market share.
- Bitcoin: Accounts for 0.7% of the market share.
- Aptos: Represents 0.6% of the market share.
- Linea: Has a 0.6% market share.
- Manta: Accounts for 0.5% of the decentralized platforms’ market.
- Mode: Holds 0.5% of the market share.
- TON: Contributes 0.5% to the total market share.
- CORE: Also represents 0.5% of the market share.
- Klink Nova: Holds 0.5% of the market share.
- Cronos: Accounts for 0.5% of the decentralized platforms’ market.
- Bitpay: Represents 0.5% of the market share.
- PulseChain: Contributes 0.4% to the total market.
- Thorchain: Holds 0.4% of the market share.
- Starknet: Accounts for 0.3% of the decentralized platforms’ market.
This list highlights the dominance of Ethereum in the DeFi space, alongside significant contributions from other platforms. The data reflects the current distribution of market activity in decentralized finance as of 2024.
Defi Adoption By Country
(Reference: statista.com)
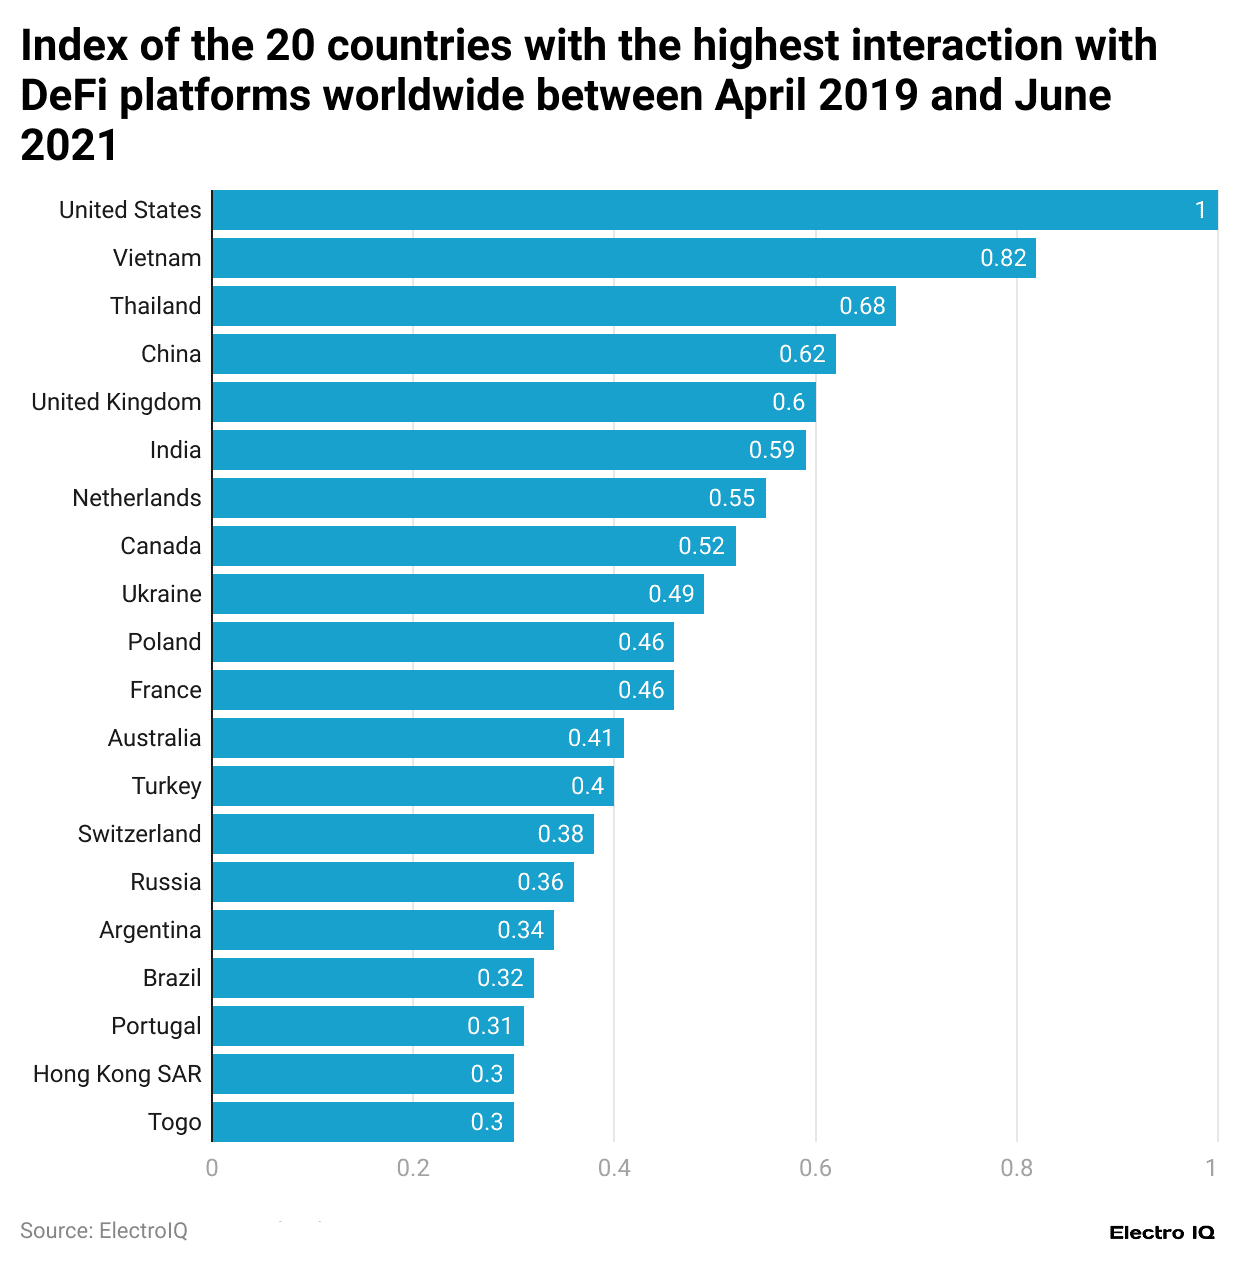
- United States: The United States leads DeFi adoption globally with an index score of 1.0, the highest among all countries.
- Vietnam: Vietnam follows with an index value of 0.82, showcasing significant DeFi adoption.
- Thailand: Thailand records a DeFi adoption index of 0.68, indicating a strong interest in decentralized finance.
- China: China’s DeFi adoption rate stands at 0.62 by index value.
- United Kingdom: The United Kingdom exhibits an adoption index value of 0.60.
- India: India shows a DeFi adoption index of 0.59.
- Netherlands: The Netherlands reports an adoption index value of 0.55.
- Canada: Canada has a DeFi adoption rate of 0.52 by index value.
- Ukraine: Ukraine’s DeFi adoption index stands at 0.49.
- Poland: Poland reports an index value of 0.46, reflecting moderate adoption.
- France: France also records a DeFi adoption rate of 0.46, similar to Poland.
- Australia: Australia’s DeFi adoption index value is 0.41.
- Turkey: Turkey’s DeFi adoption rate stands at 0.40.
These values reflect the varying levels of engagement with decentralized finance across different countries, with the United States leading the way and other nations showing notable participation.
The Technology Used By Defi Companies
(Reference: statista.com)
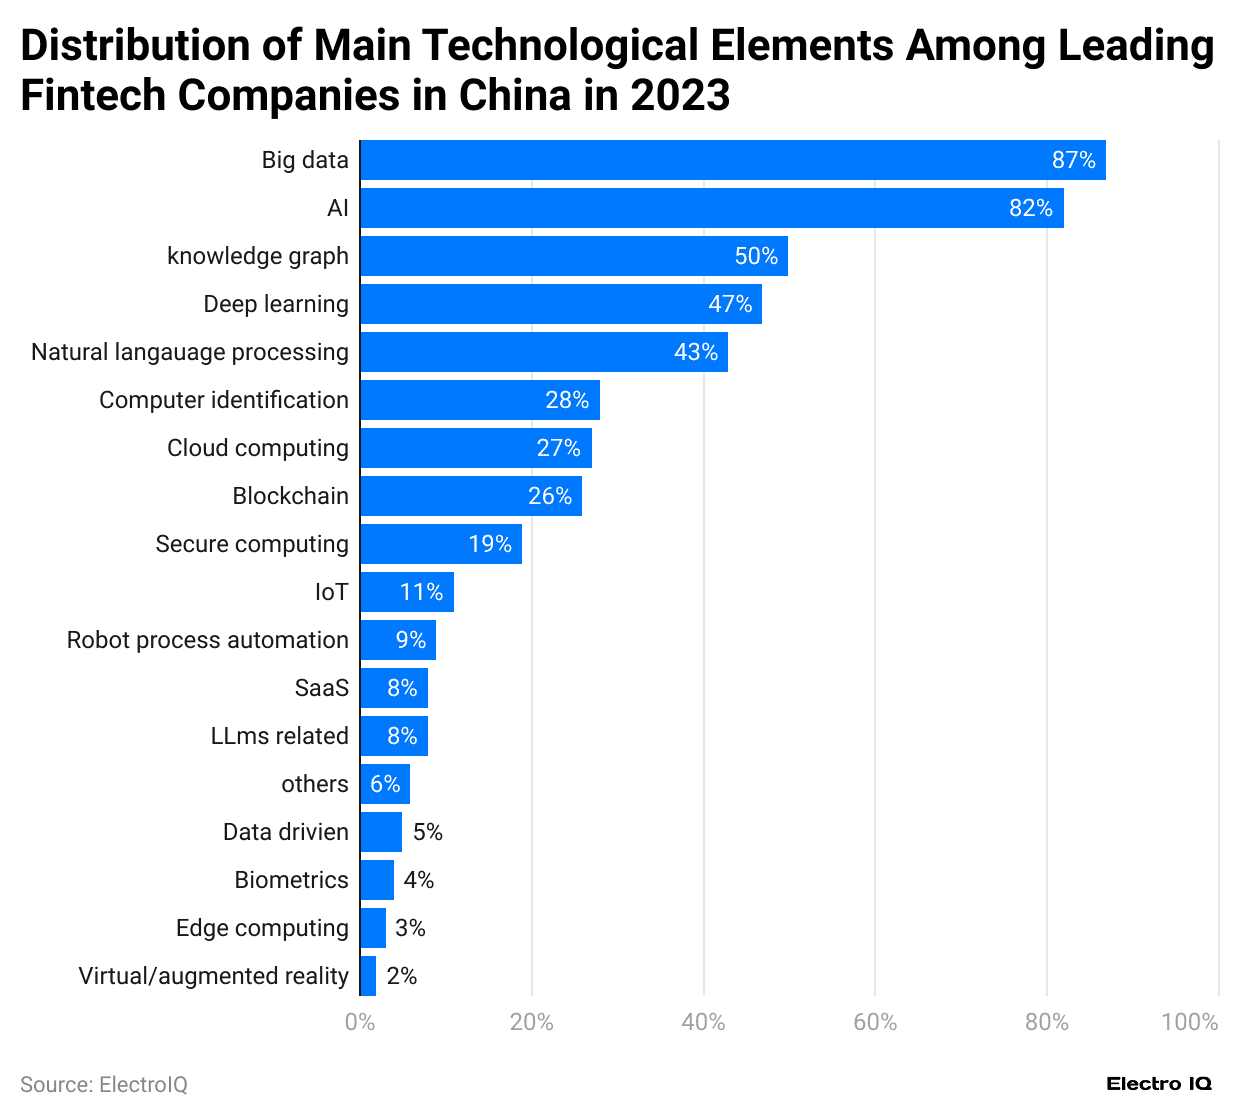
- Big Data: Utilized by 87% of fintech companies in China, making it the most widely adopted technology.
- Artificial Intelligence (AI): Used by 82% of fintech companies.
- Knowledge Graphs: Adopted by 50% of fintech companies.
- Deep Learning: Implemented by 47% of fintech companies.
- Natural Language Processing (NLP): Used by 43% of fintech companies.
- Computer Vision: Applied by 28% of fintech companies.
- Cloud Computing: Utilized by 27% of fintech companies.
- Blockchain: Employed by 26% of fintech companies.
- Secure Computing: Adopted by 19% of fintech companies.
- Internet of Things (IoT): Used by 11% of fintech companies.
- Robotic Process Automation (RPA): Implemented by 9% of fintech companies.
- Software as a Service (SaaS): Utilized by 8% of fintech companies.
- Large Language Models (LLMs): Related technologies used by 8% of fintech companies.
- Other Technologies: Adopted by 6% of fintech companies.
- Data-Driven Technologies: Implemented by 5% of fintech companies.
- Biometrics: Used by 4% of fintech companies.
- Edge Computing: Employed by 3% of fintech companies.
- Virtual and Augmented Reality (VR/AR): Utilized by 2% of fintech companies.
Acceptance of Cryptocurrencies as Payment
(Reference: statista.com)
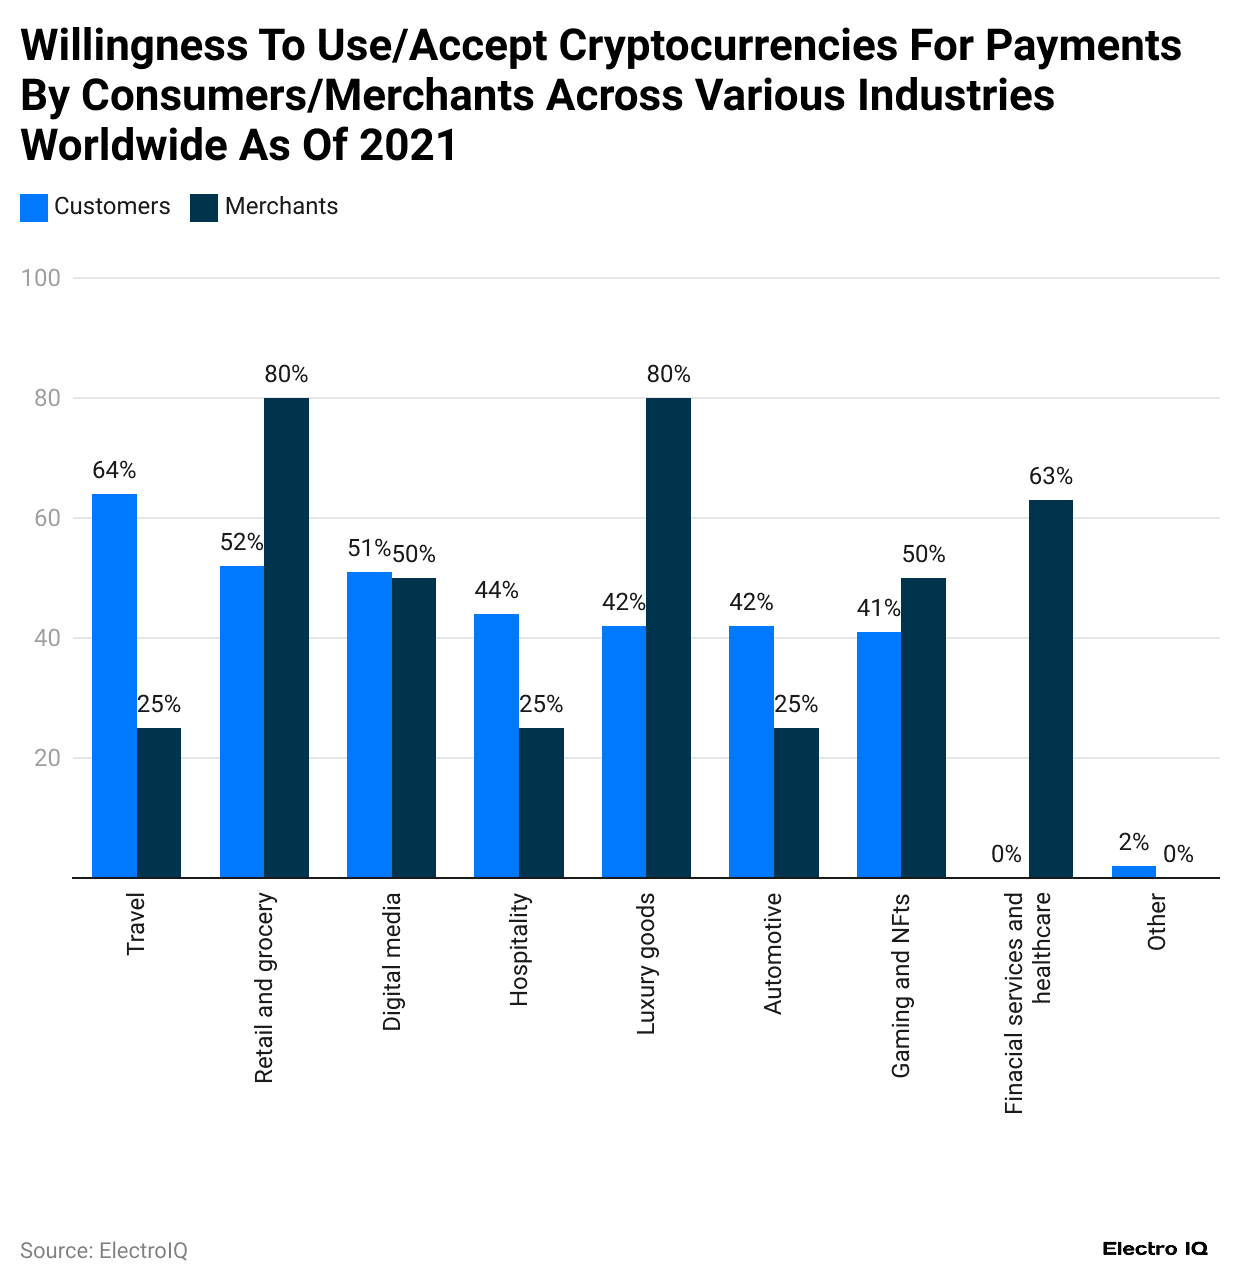
- Defi Statistics show that willingness to accept cryptocurrencies has varied across sectors.
- Among merchants, the highest acceptance rate is 80%, with retail grocery and luxury goods.
- Travel is the most accepted sector for cryptocurrency exchange among customers.
Biggest DeFi Cryptocurrency Exchanges
(Reference: statista.com)
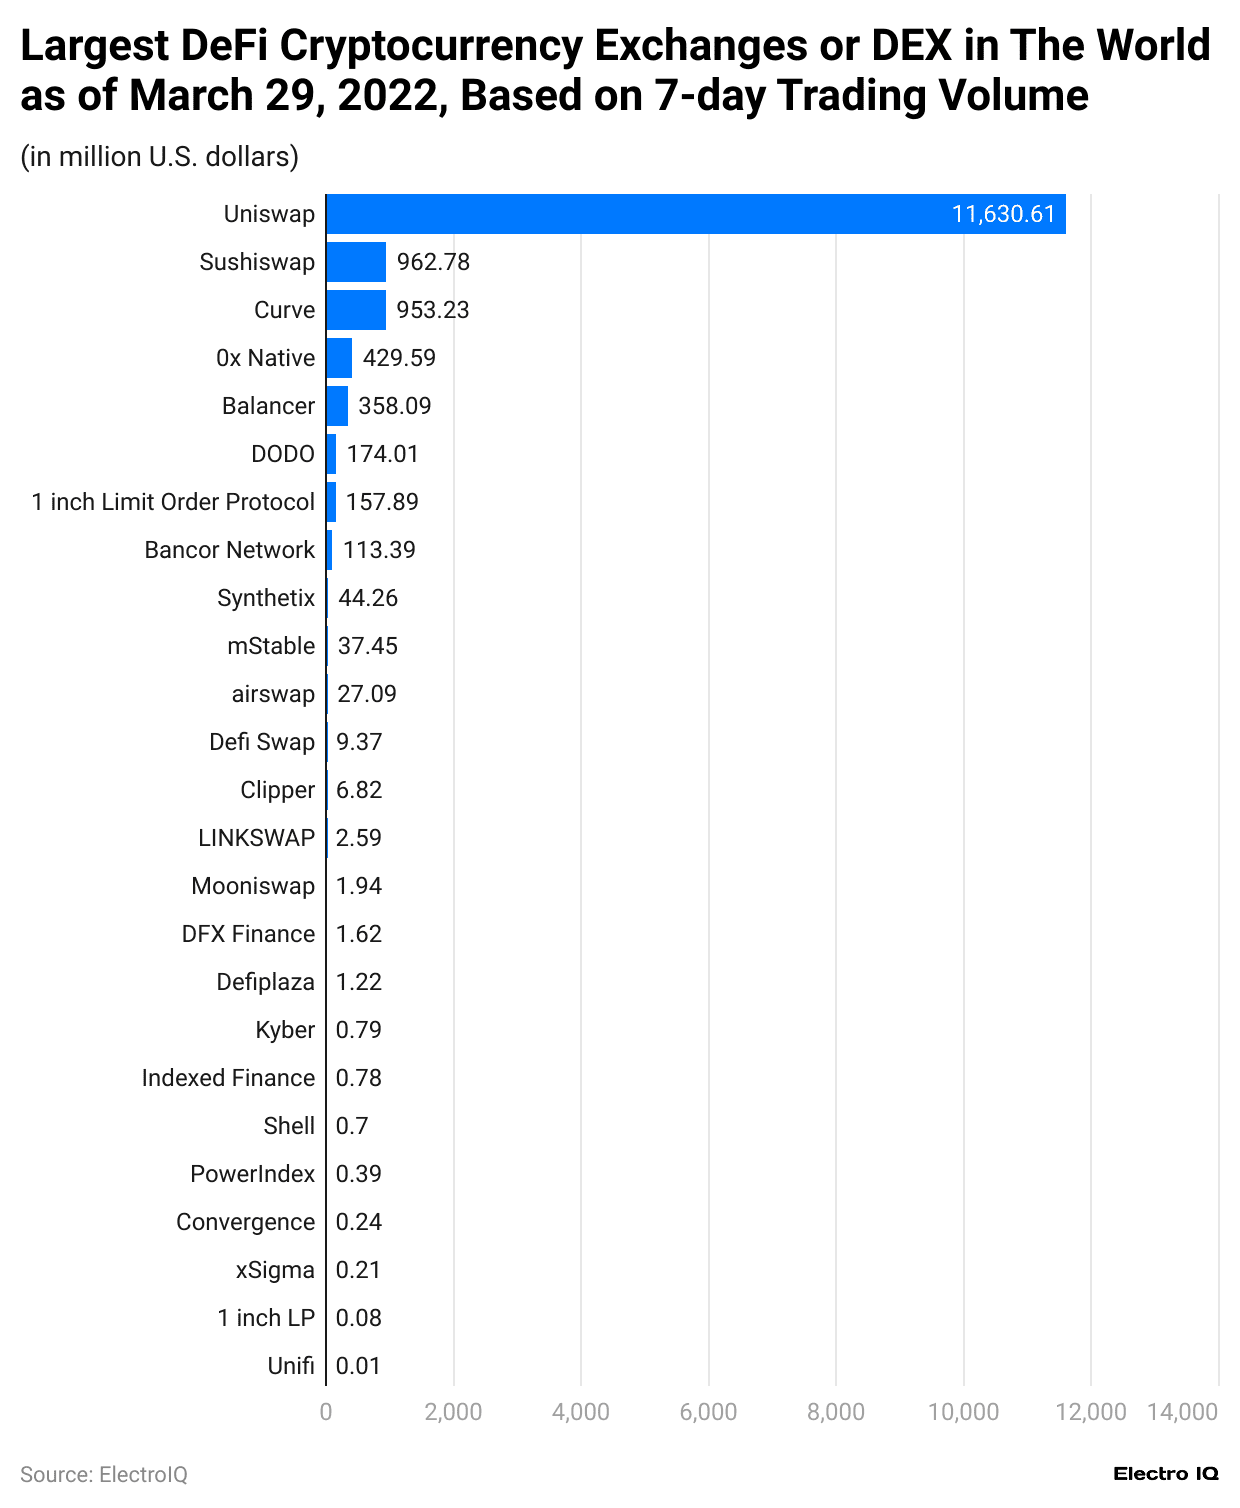
- Uniswap: Recorded the highest 7-day trading volume at 11,630.61 million USD.
- SushiSwap: Achieved a 7-day trading volume of 962.78 million USD, ranking second.
- Curve: Reported a 7-day trading volume of 953.23 million USD, closely following SushiSwap.
- 0x Native: Recorded a 7-day trading volume of 429.59 million USD.
- Balancer: Reported a trading volume of 358.09 million USD over seven days.
- DODO: Achieved a 7-day trading volume of 174.01 million USD.
- 1inch Limit Order Protocol: Recorded a trading volume of 157.89 million USD for the same period.
- Bancor Network: Reported a 7-day trading volume of 113.39 million USD.
- Synthetix: Achieved a 7-day trading volume of 44.26 million USD.
- mStable: Reported a 7-day trading volume of 37.45 million USD.
- AirSwap: Recorded a 7-day trading volume of 27.09 million USD.
- DeFi Swap: Reported a trading volume of 9.37 million USD over seven days.
- Clipper: Achieved a 7-day trading volume of 6.82 million USD.
- LINKSWAP: Recorded a 7-day trading volume of 2.59 million USD.
- Mooniswap: Reported a trading volume of 1.94 million USD in the same period.
- DFX Finance: Recorded a 7-day trading volume of 1.62 million USD.
- DeFiPlaza: Achieved a 7-day trading volume of 1.22 million USD.
- Kyber: Reported a 7-day trading volume of 0.79 million USD.
- Indexed Finance: Recorded a 7-day trading volume of 0.78 million USD.
- Smoothy Finance: Reported a trading volume of 0.7 million USD over seven days.
- Shell: Achieved a 7-day trading volume of 0.39 million USD.
- PowerIndex: Reported a trading volume of 0.24 million USD in the same period.
- Convergence: Recorded a 7-day trading volume of 0.21 million USD.
- xSigma: Achieved a trading volume of 0.08 million USD over seven days.
- 1inch LP: Reported the lowest trading volume at 0.04 million USD.
Ethereum Desktop Traffic By Country
(Reference: statista.com)
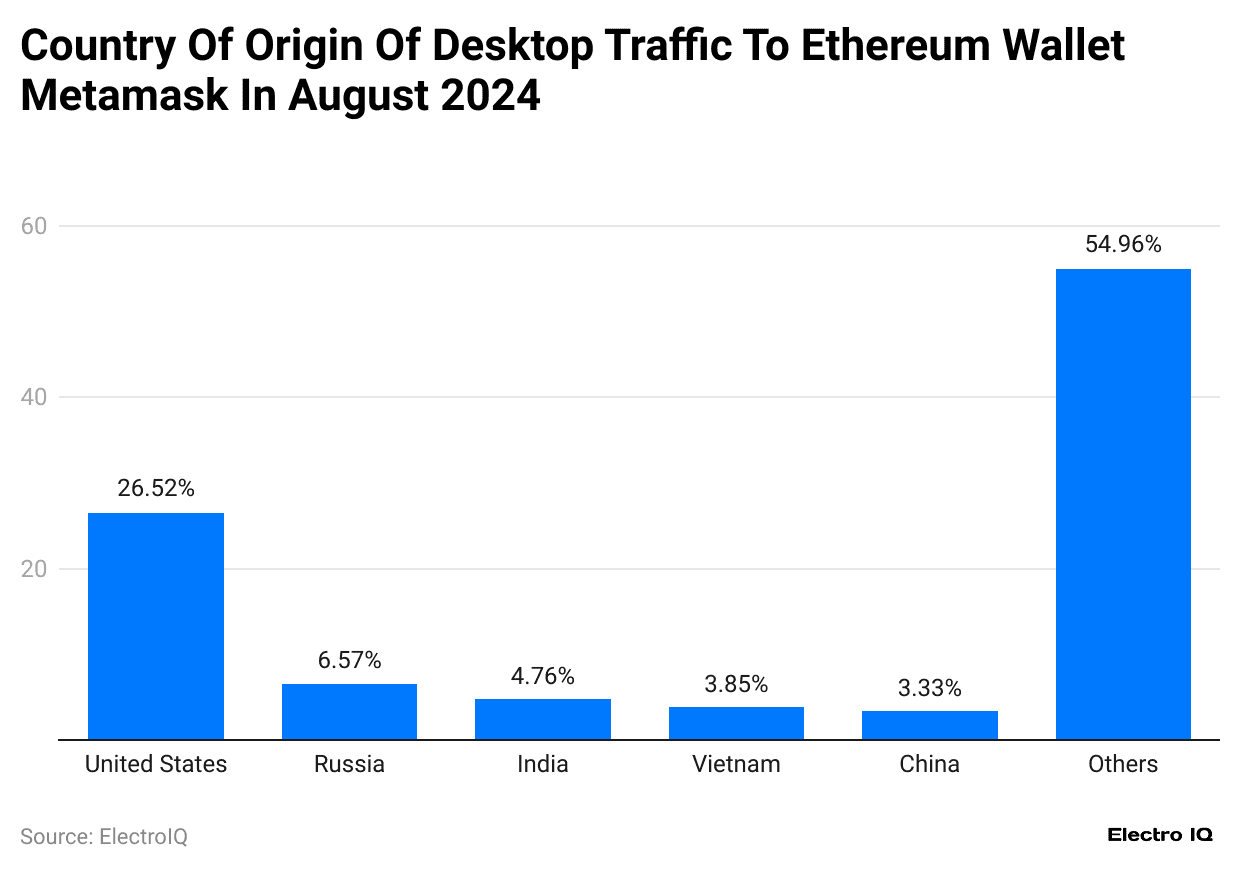
- Defi Statistics show the United States has the highest share of Ethereum desktop traffic at 26.52%.
- Russia’s desktop traffic of Ethereum is 6.57%.
- India’s desktop traffic of Ethereum is 4.76%.
- Vietnam’s desktop traffic of Ethereum is 3.85%.
- China’s desktop traffic of Ethereum is 3.33%.
Most Used Crypto Hedge Fund
(Reference: statista.com)
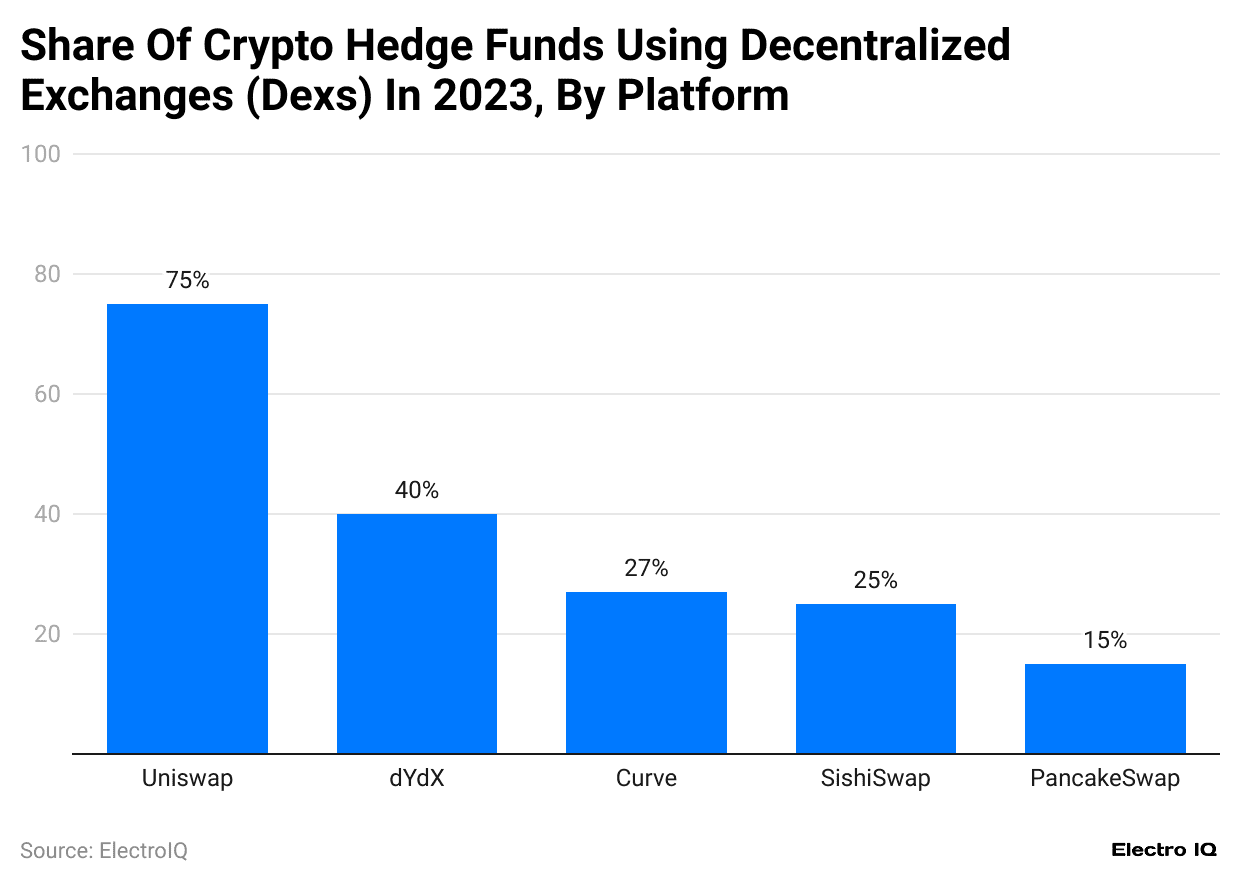
- Defi Statistics show that Uniswap is the most used crypto hedge fund using a decentralized exchange with 75%.
- dYdX is a popular crypto hedge fund used by 40% of respondents.
- Curve is a popular crypto hedge fund used by 27% of respondents.
- SushiSwap is a popular crypto hedge fund used by 25% of respondents.
- PancakeSwap is a popular crypto hedge fund used by 15% of respondents.
Market Cap of Defi
(Reference: statista.com)
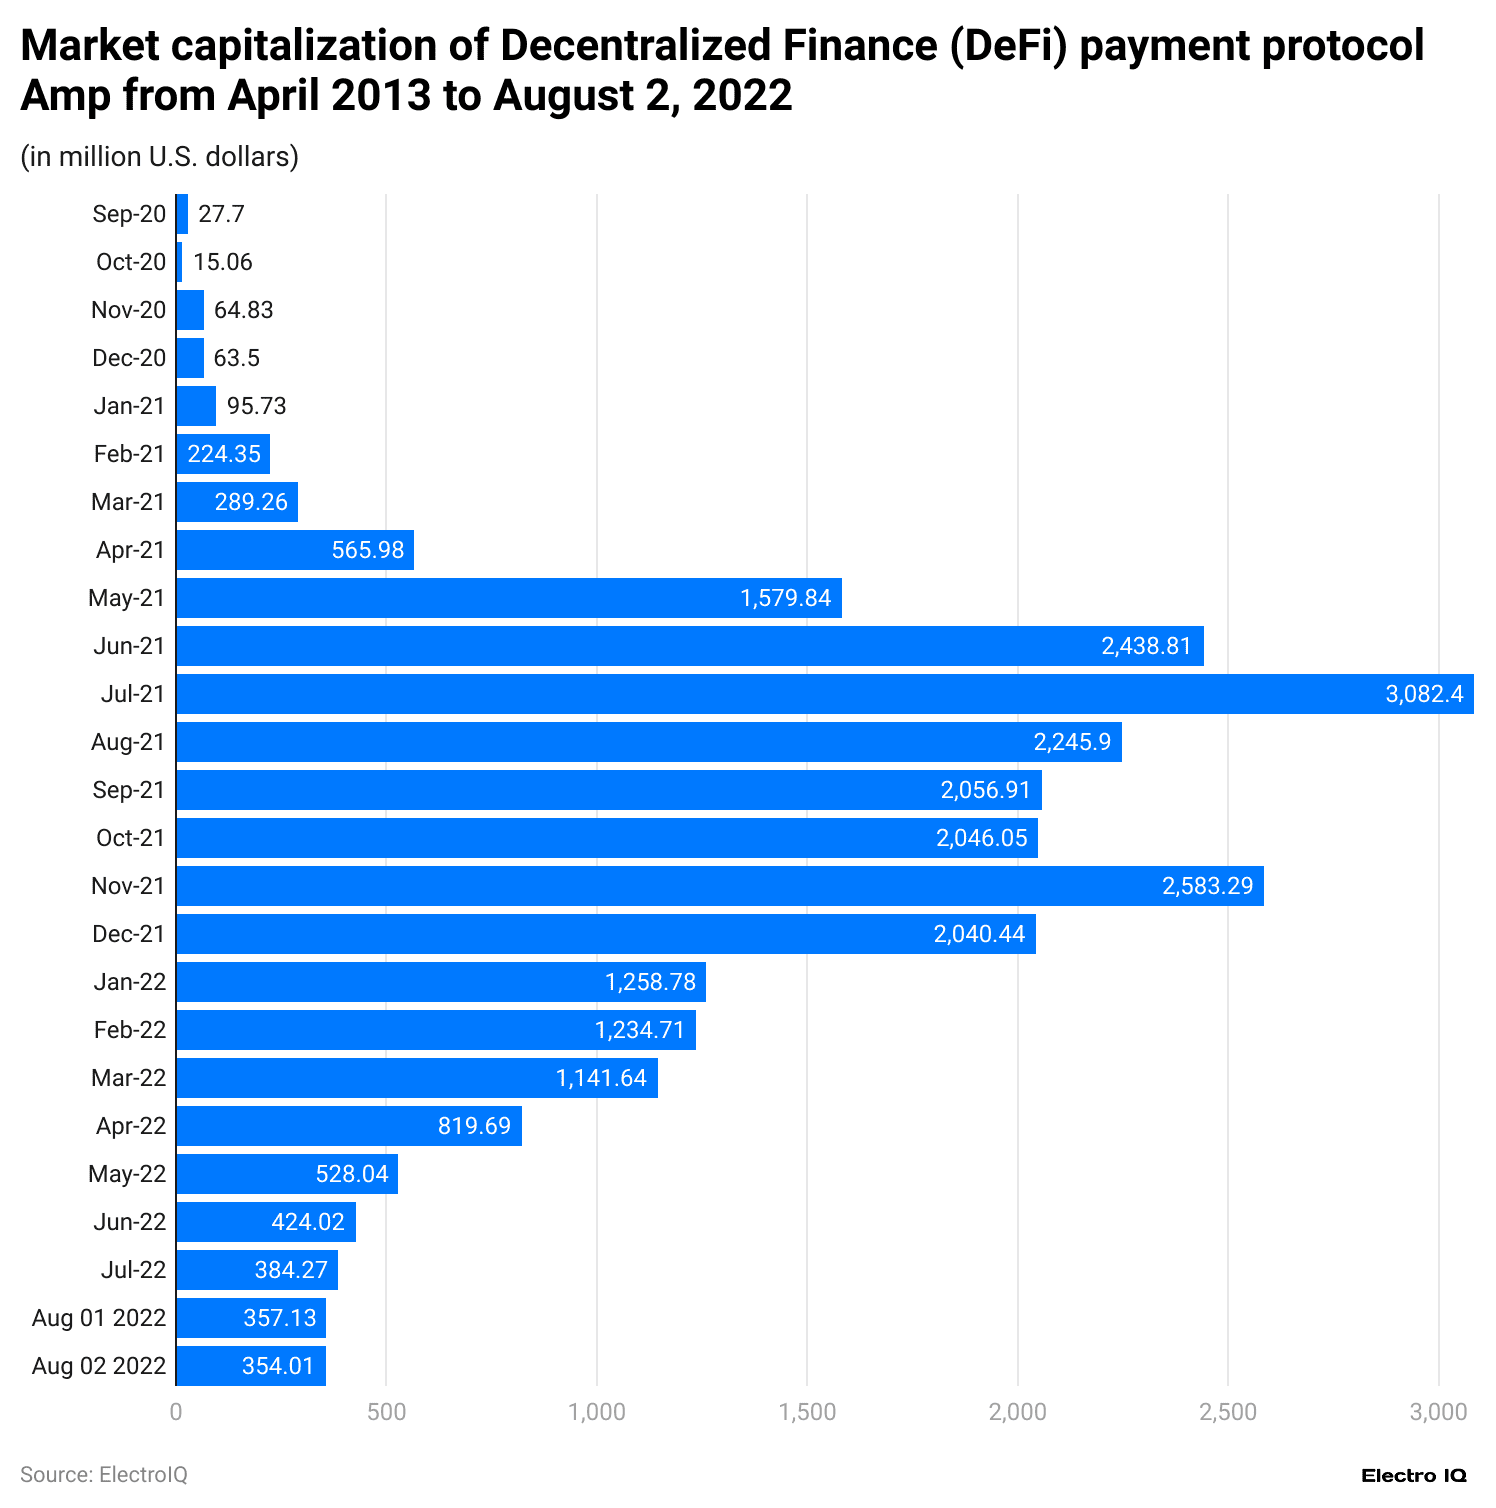
- Defi Statistics show that the market cap of DeFi platforms has been inconsistent over time.
- In September 2020, the market cap of the Defi platform was 27.7 million USD.
- As of August 2022, the market cap of the deFi platform was 354.01 million USD.
- Between September 2020 and August 2022, the highest market capitalization was recorded in July 2021, with 3082.4 million USD.
Popular Defi Coins
- Lido Staked Ether (STETH): Priced at USD 3,420, with a market cap of USD 33.43 billion.
- Uniswap (UNI): Priced at USD 11.65, with a market cap of USD 7.00 billion.
- Chainlink (LINK): Priced at USD 18.12, with a market cap of USD 11.34 billion.
- THORChain (RUNE): Priced at USD 5.45, with a market cap of USD 1.85 billion.
- Raydium (RAY): Priced at USD 5.61, with a market cap of USD 1.63 billion.
- Maker (MKR): Priced at USD 1,780, with a market cap of USD 1.57 billion.
- Pyth Network (PYTH): Priced at USD 0.43, with a market cap of USD 1.55 billion.
- Lido DAO (LDO): Priced at USD 1.68, with a market cap of USD 1.50 billion.
- Jupiter (JUP): Priced at USD 1.05, with a market cap of USD 1.42 billion.
- Marinade Staked SOL (MSOL): Priced at USD 288.66, with a market cap of USD 1.23 billion.
- Aave (AAVE): Priced at USD 191.30, with a market cap of USD 2.86 billion.
- Binance Staked SOL (BNSOL): Priced at USD 237.60, with a market cap of USD 871.34 million.
- PancakeSwap (CAKE): Priced at USD 2.75, with a market cap of USD 782.80 million.
- Synthetix Network (SNX): Priced at USD 2.37, with a market cap of USD 772.24 million.
- dYdX (ETHDYDX): Priced at USD 1.52, with a market cap of USD 685.60 million.
- Gnosis (GNO): Priced at USD 268.20, with a market cap of USD 689.47 million.
- Compound (COMP): Priced at USD 67.94, with a market cap of USD 598.46 million.
- Curve DAO (CRV): Priced at USD 0.49, with a market cap of USD 603.94 million.
- Super OETH (SUPEROETHB): Priced at USD 3,410, with a market cap of USD 571.57 million.
- Frax Ether (FRXETH): Priced at USD 3,330, with a market cap of USD 507.35 million.
- Reserve Rights (RSR): Priced at USD 0.01, with a market cap of USD 449.78 million.
- 0x Protocol (ZRX): Priced at USD 0.54, with a market cap of USD 454.86 million.
- fi (ETHFI): Priced at USD 2.22, with a market cap of USD 458.31 million.
- Jito (JTO): Priced at USD 3.57, with a market cap of USD 465.34 million.
- WOO (WOO): Priced at USD 0.26, with a market cap of USD 474.14 million.
- tBTC (TBTC): Priced at USD 92,960, with a market cap of USD 491.09 million.
- Amp (AMP): Priced at USD 0.01, with a market cap of USD 416.02 million.
- Aevo (AEVO): Priced at USD 0.44, with a market cap of USD 390.68 million.
- Osmosis (OSMO): Priced at USD 0.57, with a market cap of USD 394.96 million.
- Telcoin (TEL): Priced at USD 0.00, with a market cap of USD 367.39 million.
- Frax Share (FXS): Priced at USD 3.21, with a market cap of USD 272.19 million.
- Loopring (LRC): Priced at USD 0.22, with a market cap of USD 271.92 million.
- Rocket Pool (RPL): Priced at USD 14.02, with a market cap of USD 289.74 million.
(Source: forbes.com)
Conclusion
The DeFi landscape represents a dynamic and rapidly evolving financial ecosystem characterized by innovation, technological advancement, and increasing global adoption. As blockchain technologies mature and decentralized platforms gain sophistication, the potential for transformative financial services becomes increasingly apparent.
Defi Statistics highlights the significant role of platforms like Ethereum in driving blockchain innovation, with its dominant 56.2% market share underscoring its pivotal position. The technological foundations of DeFi, powered by Big Data, AI, and advanced computational techniques, demonstrate the sector’s commitment to creating robust, efficient financial solutions.