ERP Software Statistics By Market, Region, Consumers, Adoption, Usage, Companies, Implementation (2025)
Updated · Sep 10, 2025

Table of Contents
- Introduction
- Editor’s Choice
- ERP Software Market
- By Region
- By Country Revenue Comparison
- By Region-Wise Revenue Comparison
- Top Consumers of ERP Software
- ERP Software Adoption Statistics by Industry
- Company Expectations on ERP Software Statistics
- ERP Usage Statistics
- ERP Software Features Preferred by Buyers
- ERP Software Pricing Statistics by Business
- Top Companies
- ERP Software Implementation Statistics
- Conclusion
Introduction
ERP Software Statistics: Enterprise Resource Planning (ERP) software is widely recognized as an essential business tool. This is mainly used to simplify operations, boost efficiency, and unify key functions like finance, supply chain, human resources, and customer management. Previously, ERP was primarily deployed on-premise, but in recent years, the industry has shifted toward cloud-based platforms, which are easier to manage and suitable for businesses of all sizes.
In 2024, organizations have invested several billion USD in ERP solutions to automate processes and gain deeper insights, helping them maintain a competitive edge in a rapidly changing business environment. The following statistics outline how ERP has expanded, its importance in modern business, and the reasons driving its wider adoption.
Editor’s Choice
- A report published by Statista states that the global Enterprise Resource Planning software market will generate around USD 55.88 billion in revenue by the end of
- From 2025 to 2030, it is expected to grow at a steady annual rate of 3.30%, reaching an estimated market size of USD 65.74 billion by 2030.
- On average, total spending per employee on ERP software is forecast to be about USD 14.90 in 2025.
- The United States is predicted to lead the market, bringing in roughly USD 27.82 billion in revenue.
- According to a report from precedenceresearch.com, North America accounted for over 36% of the total revenue in 2024.
- Looking at business functions, finance contributed the largest share, around 26.4%.
- In terms of deployment type, on-premises solutions dominated the global market with a 72% share.
- Among companies of different sizes, large enterprises held the biggest portion, representing 41.2% of the market.
- In 2024, the services sector earned the highest revenue, 27.1% total.
- Manufacturing leads in ERP usage, accounting for 33.66% of all implementations.
- Similarly, manufacturing companies use ERP software the most, making up 21% of its users.
- Around 85% of organizations say they urgently need a new ERP system, recognizing its importance.
- As of 2024, accounting was termed the top feature for 89% of ERP buyers.
ERP Software Market
 (Source: market.us)
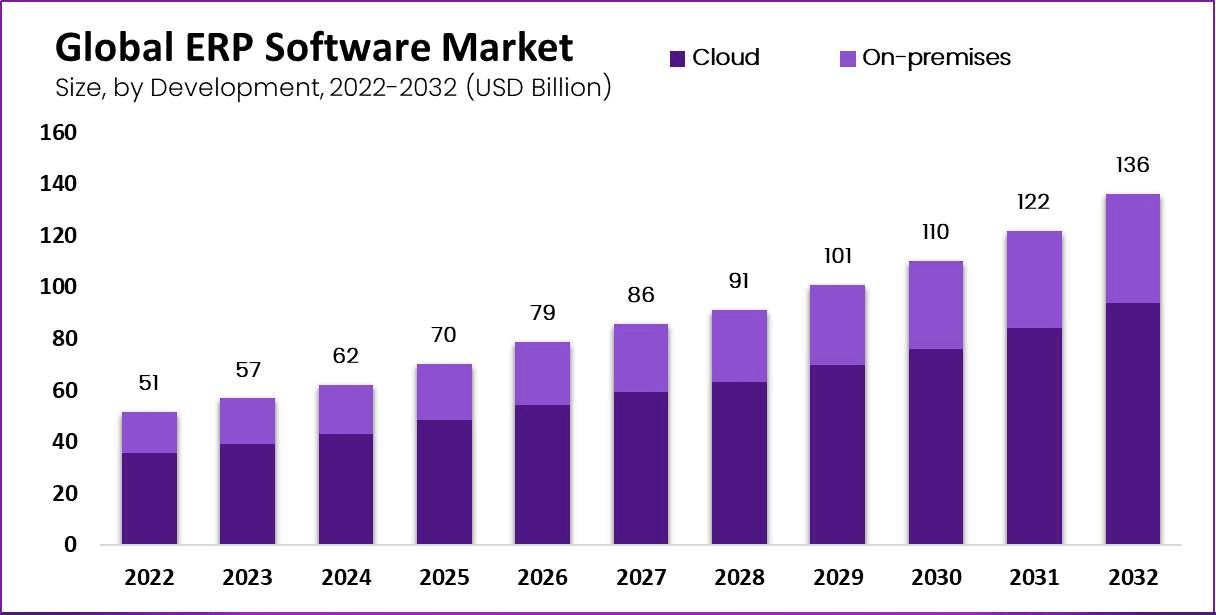
- In 2024, ERP software earned USD 62 billion globally and is expected to reach USD 70 billion by the end of 2025.
- This upward trend is expected to continue, with the market reaching USD 79 billion in 2026, USD 86 billion in 2027, and USD 91 billion in 2028, USD 101 billion in 2029, USD 110 billion in 2030, USD 122 billion in 2031, and USD 136 billion in 2032.
By Region
 (Source: precedenceresearch.com)
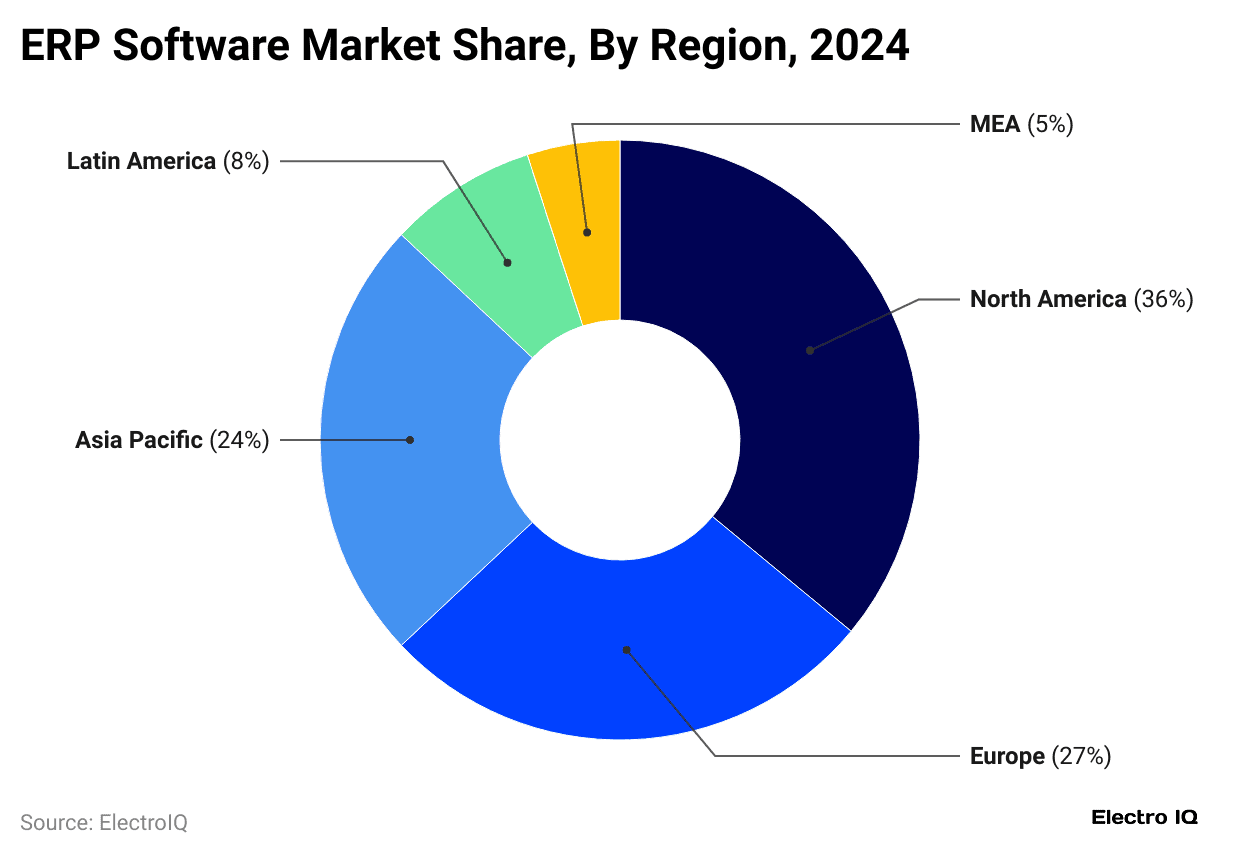
- In the market of ERP Software, the North American region held the largest revenue share 36% in 2024.
- Furthermore, other regions’ market shares were followed as Europe (27%), Asia Pacific (24%), Latin America (8%), and MEA (5%).
By Country Revenue Comparison
- In 2025, the Enterprise Resource Planning (ERP) software market in the United States is expected to generate about USD 27.82 billion in revenue, as mentioned in a report published by Statista.
- The market is forecast to expand with a compound annual growth rate of 2.46% between 2025 and 2030.
- The market size could reach around USD 31.41 billion by 2030.
- Another key figure is the average spend per employee, which in 2025 is estimated to be USD 159.94.
Furthermore, other countries’ revenue analysis is stated in the table below:
| Country | Revenue (USD) | CAGR | Spend per Employee, 2025 (USD) | |
| 2025 | 2030 | |||
|
China |
3.42 billion | 4.89 billion | 7.45% | 4.36 |
| United Kingdom | 2.96 billion | 3.61 billion | 4.09% |
82.17 |
|
Germany |
2.41 billion | 2.71 billion | 2.36% | 52.94 |
| Japan | 2.01 billion | 2.18 billion | 1.69% |
28.77 |
By Region-Wise Revenue Comparison
| Region | Revenue (USD) | CAGR | Spend per Employee, 2025 (USD) | |
| 2025 | 2030 | |||
| Africa | 706.63 million | 882.42 million | 4.54% | 1.34 |
| Americas | 31.32 billion | 35.45 billion | 2.51% | 61.35 |
| Asia | 10.05 billion | 12.86 billion | 5.06% | 4.43 |
| Australia & Oceania | 1.13 billion | 1.30 billion | 2.90% | 50.76 |
| Caribbean | 98.37 million | 112.02 million | 2.63% | 5.15 |
| Central & Western Europe | 9.23 billion | 10.71 billion | 3.02% | 52.81 |
| Central Africa | 53.20 million | 63.15 million | 3.49% | 1.37 |
| Central America | 78.02 million | 93.85 million | 3.76% | 3.30 |
| Central Asia | 123.97 million | 159.16 million | 5.12% | 3.80 |
| Eastern Africa | 120.69 million | 160.62 million | 5.88% | 0.53 |
| Eastern Asia | 3.24 billion | 3.61 billion | 2.20% | 3.55 |
| Eastern Europe | 871.77 million | 1.65 billion | 13.57% | 7.41 |
| Europe | 12.67 billion | 15.24 billion | 3.76% | 30.24 |
| North America | 29.91 billion | 33.77 billion | 2.46% | 115.68 |
| Northern Africa | 151.76 million | 184.26 million | 3.96% | 1.92 |
| Northern Europe | 1.33 billion | 1.48 billion | 2.20% | 70.65 |
| South America | 1.24 billion | 1.47 billion | 3.58% | 5.91 |
| Southeast Asia | 713.76 million | 888.83 million | 4.48% | 2.02 |
| Southern Africa | 222.37 million | 252.89 million | 2.61% | 7.39 |
| Southern Asia | 1.06 billion | 1.53 billion | 7.57% | 1.20 |
| Southern Europe | 1.24 billion | 1.40 billion | 2.50% | 11.49 |
| Western Africa | 158.61 million | 221.50 million | 6.91% | 1.05 |
| Western Asia | 1.49 billion | 1.78 billion | 3.54% | 17.61 |
Top Consumers of ERP Software
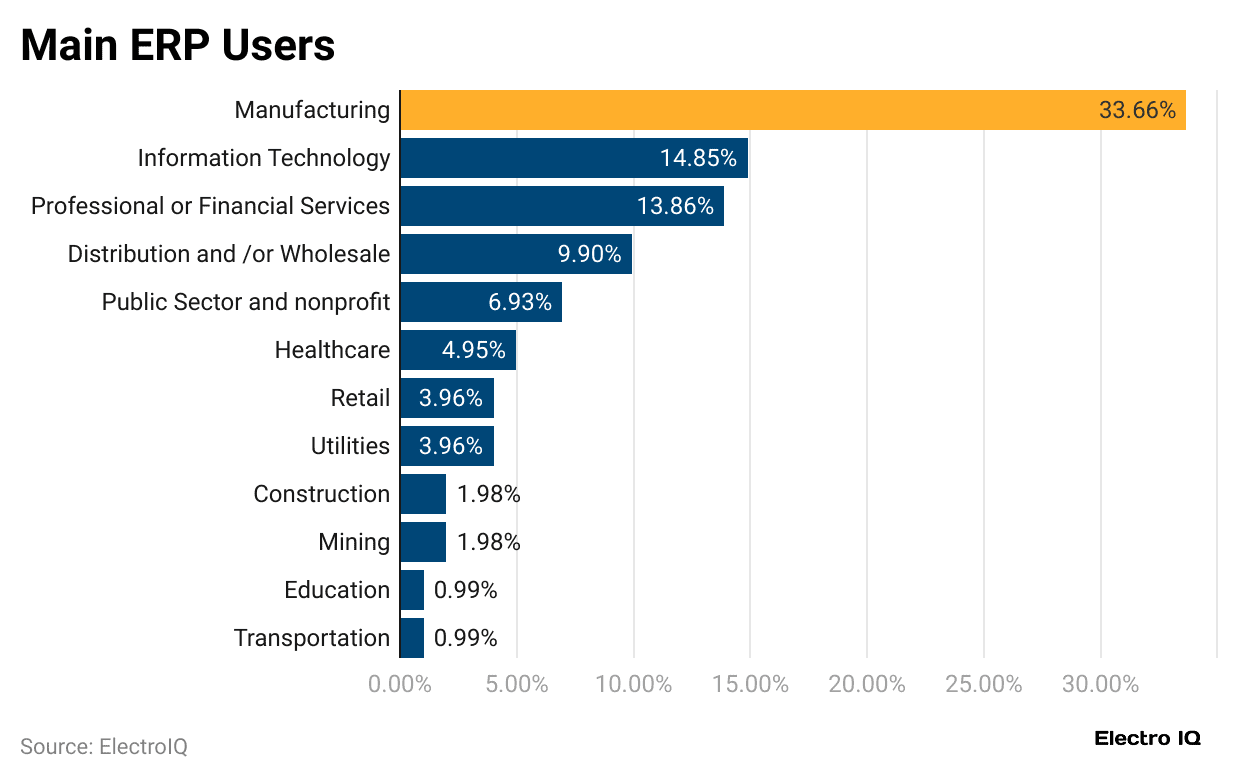
- Manufacturing leads in ERP usage, accounting for 33.66% of all implementations.
- Other major industries using ERP include information technology at 14.85%, professional and financial services at 13.86%, and distribution or wholesale at 9.90%.
- The public sector and nonprofit organizations make up 6.93% of total usage, while healthcare accounts for 4.95%.
- Both retail and utilities share 3.96% each, and construction and mining each represent 1.98% of ERP adoption.
- Education and transportation make up the smallest shares, both at 0.99%.
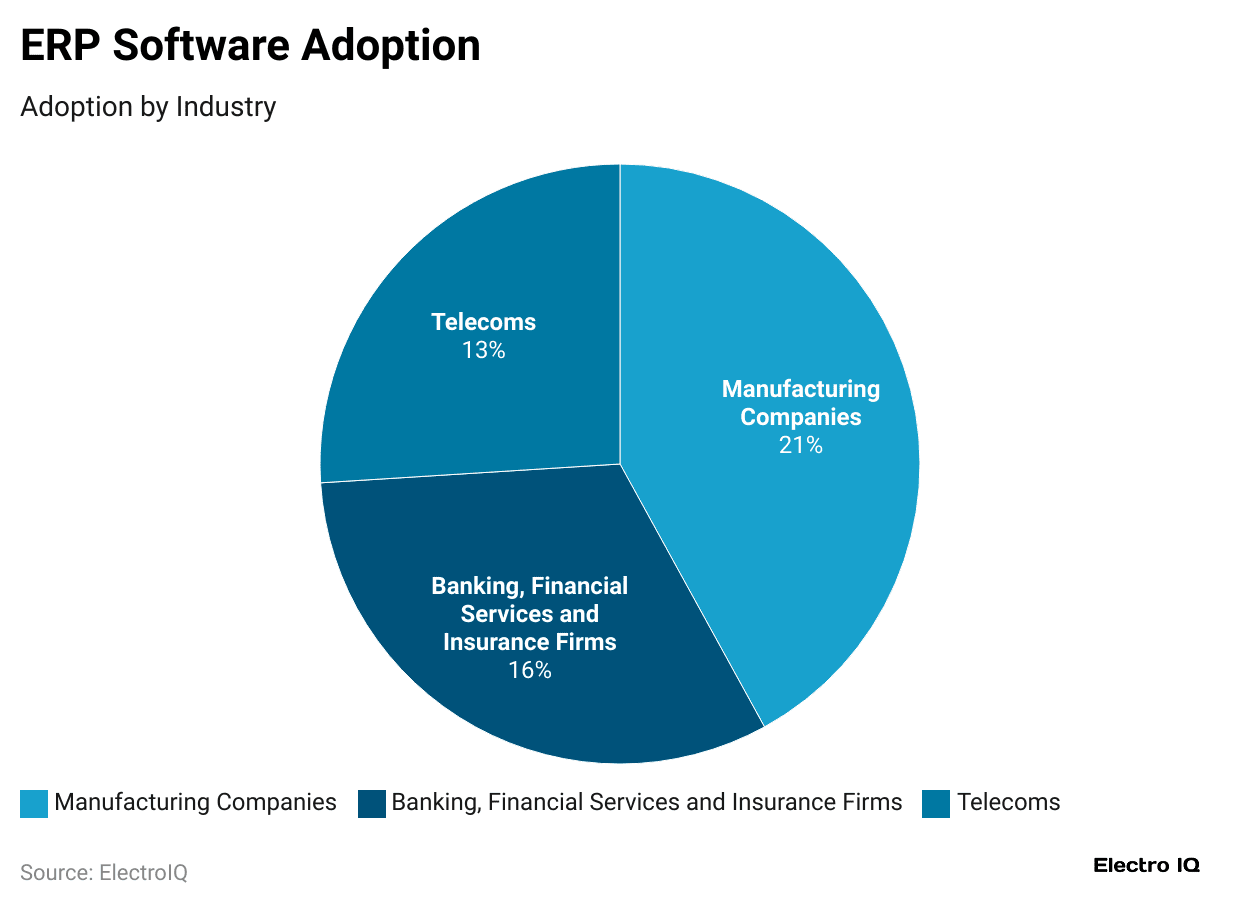
ERP Software Adoption Statistics by Industry
 (Reference: market.us)
- Manufacturing companies use ERP software the most, making up 21% of its users.
- Other major users include banks, financial services, and insurance firms at 16%, followed by telecom companies at 13%.
Company Expectations on ERP Software Statistics
- Around 85% of organizations say they urgently need a new ERP system, recognizing its importance.
- However, 40% of companies mistakenly believe that moving to cloud ERP will automatically improve financial reporting.
- Some of the main benefits businesses expect from ERP include automated reporting (30%), less reliance on IT (25%), and more accurate reports (21%).
- As SAP ECC approaches its end-of-life in 2027, around 53% of companies are getting ready for the switch.
- 82% organizations believe their ERP initiatives will lead to better quality.
- At present, 48% are actively working on cloud ERP projects, while 33% are in the process of moving from on-premise systems.
- Meanwhile, 44% of stakeholders are still uncertain about their cloud ERP plans, and 25% say their companies do not have any such plans in place.
ERP Usage Statistics
- As of 2025, manufacturing companies are the top users of ERP software, representing 47% of businesses planning to adopt it.
- Following them, distributors make up 18%, service companies 12%, and construction firms 4% of potential ERP users.
- In a survey by Oracle NetSuite, 89% of companies said accounting was the most important ERP feature.
- Meanwhile, inventory and distribution ranked 67%, CRM and sales 33%, technology 21% and 40% chose ERP for better functionality.
- Finance and accounting teams and IT staff each influenced purchases at 23%.
- On average, 26% of employees use ERP software.
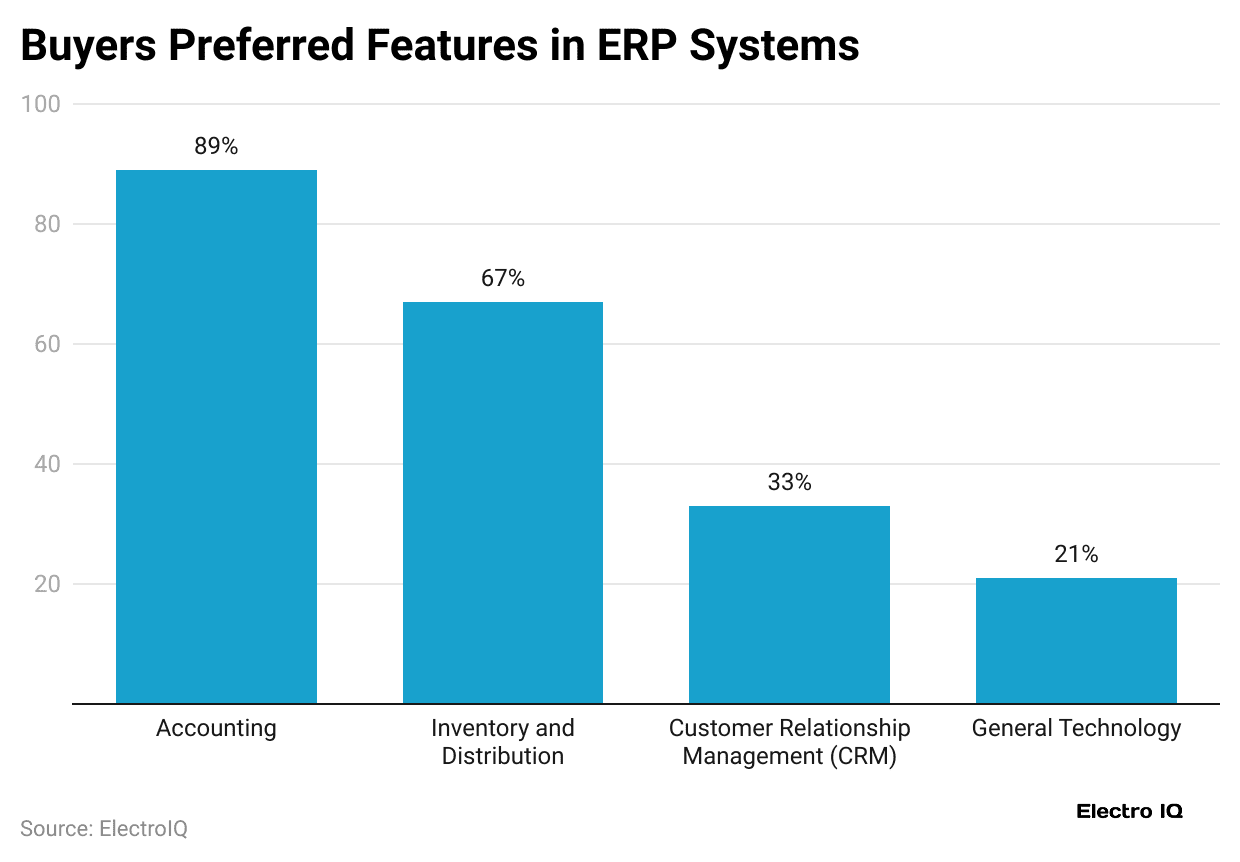
ERP Software Features Preferred by Buyers
 (Reference: scoop.market.us)
- Accounting is the top feature for 89% of ERP buyers.
- Other popular modules include inventory and distribution (67%), customer relationship management (CRM) (33%), and general technology functions (21%).9
- Only 3% of companies rely on standard, out-of-the-box ERP systems.
- The majority prefer some degree of customisation. Of these, 33% to 48% request moderate adjustments.
- Meanwhile, 10% to 19% specifically look for fully personalised ERP solutions.
ERP Software Pricing Statistics by Business
- Small businesses usually spend between USD 1,740 and USD 4,620 each month on ERP software, which totals USD 20,880 to USD 55,440 per year.
- In contrast, mid-sized companies pay around USD 4,620 to 5,160 per month, adding up to USD 55,440 to USD 61,920 annually.
- For large enterprises, the average monthly cost is about USD 9,330, leading to a yearly expense of USD 111,960.
Top Companies
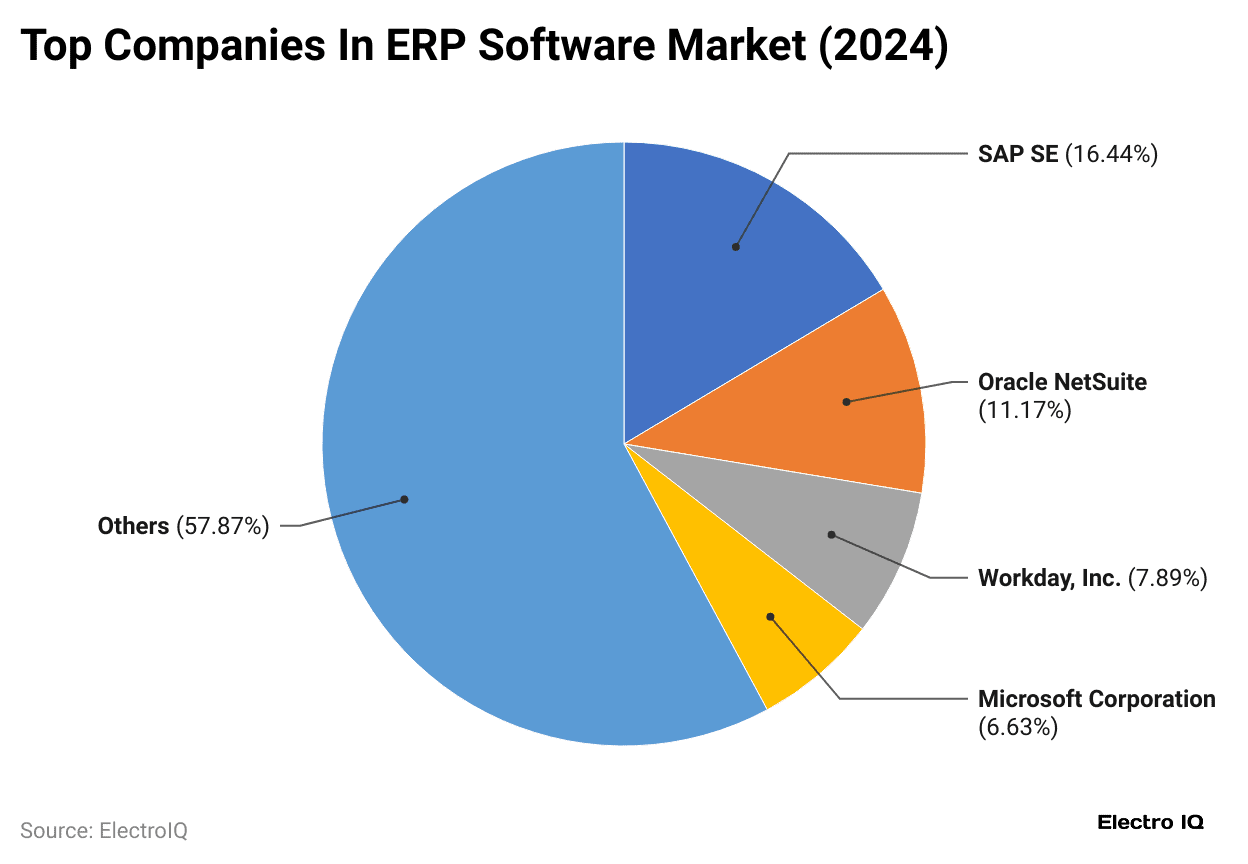
- SAP SE secured the largest market share of ERP software, with 16.44% of overall sales, followed by Oracle NetSuite at 11.17% and Workday, Inc. at 7.89%.
- Microsoft Corporation held a 6.63% share, while various other ERP providers captured the remaining 57.87%.
- In April 2025, SAP SE announced its Q1 FY 2025 results, reporting total revenue of USD 9.01 billion, marking a 12% increase year over year.
- Cloud revenue climbed 27% to USD 4.99 billion, while the cloud backlog grew 28%, reaching USD 18.2 billion.
- The Cloud ERP Suite saw the strongest growth, rising 34% compared with the same period last year.
ERP Software Implementation Statistics
- As mentioned on thecfoclub.com, ERP manufacturers and distributors report that about 67% of their implementations succeed.
- From the organization’s side, 93% of companies feel their ERP implementation was successful.
- 54%of companies claimed poor project management is a major hurdle.
- Besides, 50% of ERP projects were completed on time, while around 31% ran longer than expected.
- Just 8% of projects finish earlier than planned.
Conclusion
After completing the article, ERP software helps businesses streamline operations, boost efficiency, and allow them to make informed decisions. Whether cloud, on-premise, or hybrid, ERP provides real-time data, better collaboration, and stronger control over processes. Connecting areas like finance, HR, and supply chain enables faster responses to challenges. Selecting the right ERP is vital for productivity, competitiveness, and long-term success.
FAQ.
Managing finances, handling inventory and supply chains, overseeing human resources, keeping track of customer relationships, and providing reporting and analytics tools to help make better decisions.
For improving efficiency, reducing errors, enhancing collaboration, and gaining real-time insights into operations.
- Cloud ERP is stored online, allowing users to access it from any location.
- On-premise ERP is set up on a company’s own servers and handled by its internal IT team.
- Hybrid ERP mixes both approaches, offering features of cloud and on-premise systems together.
- Streamlined business processes.
- Better decision-making through real-time data.
- Reduced operational costs.
- Improved collaboration across departments.
- High initial costs.
- Complexity in implementation
- Employee training requirements.
- Potential system downtime during upgrades.

Maitrayee Dey has a background in Electrical Engineering and has worked in various technical roles before transitioning to writing. Specializing in technology and Artificial Intelligence, she has served as an Academic Research Analyst and Freelance Writer, particularly focusing on education and healthcare in Australia. Maitrayee's lifelong passions for writing and painting led her to pursue a full-time writing career. She is also the creator of a cooking YouTube channel, where she shares her culinary adventures. At Smartphone Thoughts, Maitrayee brings her expertise in technology to provide in-depth smartphone reviews and app-related statistics, making complex topics easy to understand for all readers.