Facebook Ad Statistics By Revenue, Usage and Facts (2026)
Updated · Jan 12, 2026

Table of Contents
- Introduction
- Editor’s Choice
- General Facebook Ad Statistics
- Facebook Ad Revenue Statistics
- Facebook Lead Ads Changes Statistics
- Industry-Wise Facebook Ad Statistics By Click-Through Rate and Cost Per Click
- Region-Wise Facebook Ad Statistics
- Facebook Advertising Audience Statistics By Demographics, 2025
- Video And Mobile Ad Trends On Facebook
- Facebook Ads Best Practices Statistics
- Facebook Ads Performance Statistics
- Facebook Ads Statistics By Usage and Reach
- Conclusion
Introduction
Facebook Ad Statistics: Facebook ad statistics help advertisers to make better decisions by providing real data rather than guesswork. These ads provide review metrics, including reach, impressions, click-through rate (CTR), cost per click (CPC), cost per result, frequency, and conversion rate. All reviews should show how people are responding to the ads and clarify the findings by including photos or videos that attract attention, such as which audience groups are more likely to respond and where the budget is being wasted, resulting in low results. Advertisers can also identify current advertising trends within days and weeks, repeat strategies that perform well, and address underperforming parts.
This article includes several statistical figures and recent findings from different studies that demonstrate increasing bragadness, boosting, and. These data support better targeting, stronger messages, and improved return on ad spend (ROAS).
Editor’s Choice
- Meta, Facebook’s owner, accounted for USD 156.8 billion in ad revenue in 2025, up 5.8% from 2024, according to sqmagazine.co.uk.
(Reference: amraandelma.com)
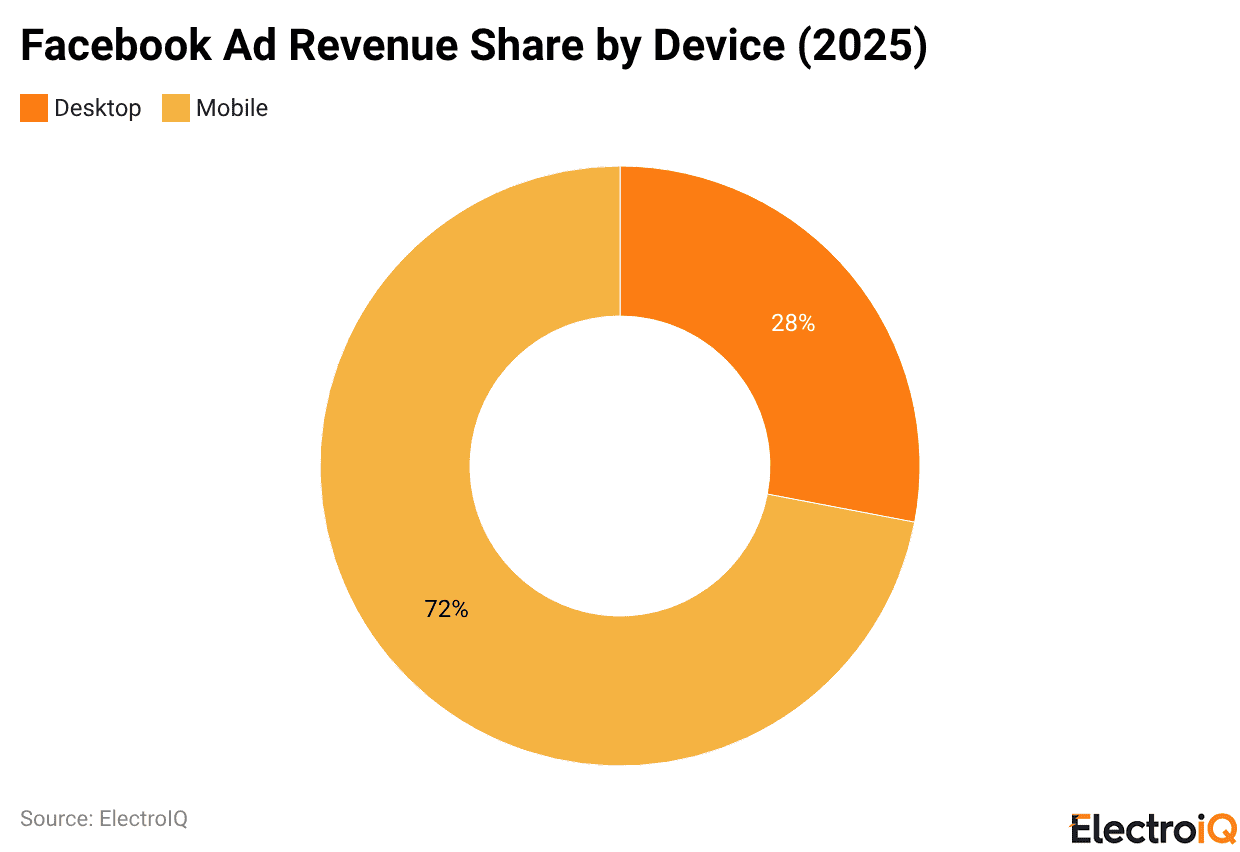
- In the same year, mobile devices accounted for 72% of Facebook’s ad revenue, and desktops for the remaining 28%.
- A report published by Increv.co indicates that the Asia-Pacific region accounts for 43% of Facebook’s global user base.
- Video makes up more than 60% of the time people spend on Facebook.
- Facebook feed ads reports stated that Meta recommends using images at least 1080 pixels wide.
- A survey from Databox indicates that 54% of marketers report that Facebook ads are very effective for sales, whereas only 8% report that they are ineffective.
- According to marketingltb.com, over 90% of marketers use Facebook Ads.
- In the 18-24 age group, males make up 12.7% of Facebook’s advertising audience, while females account for 9.1%.
- In 2025, 82% use Meta Advantage+, while AI bidding delivers a 27% higher ROAS than manual bidding.
General Facebook Ad Statistics
- According to Increv.co, in 2025, the average click-through rate (CTR) is 1.44%, whereas top performers achieve 2.5%.
- The average cost per click (CPC) is USD 0.54, but the best results typically fall between USD 0.30 and USD 0.40.
- For video ads (Reels), the average CTR is 1.94%, with top performers reaching 3.0% or higher.
- The average conversion rate was 9.21%, and top performers typically get 12%.
(Source: wordstream.com)
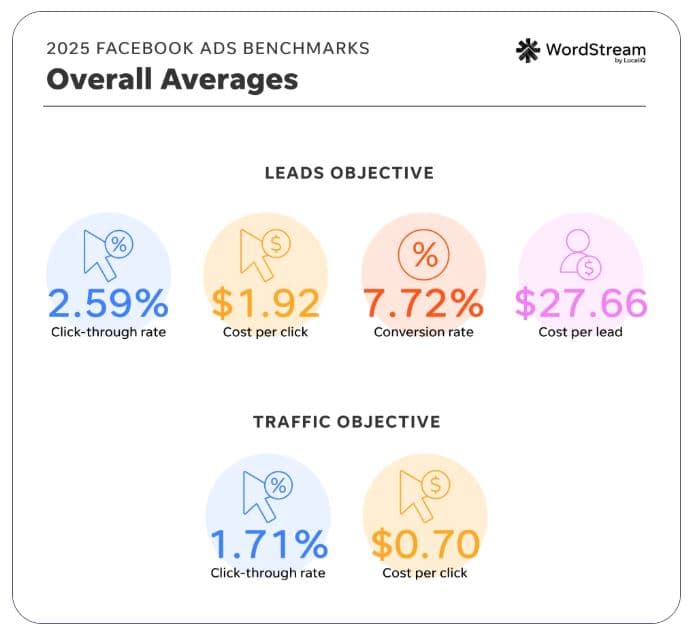
- In 2025, Facebook Ads had a 2.59% click-through rate, along with a USD 1.92 cost per click, a 7.72% conversion rate, and a USD 27.66 cost per lead.
- For the Traffic objective, the click-through rate is 1.71% and the cost per click is USD 0.70.
Facebook Ad Revenue Statistics
- Meta, Facebook’s owner, accounted for USD 156.8 billion in ad revenue in 2025, up 5.8% from 2024, according to sqmagazine.co.uk.
- North America remains the leading region in spending, accounting for over USD 9.3 billion and more than half of Facebook’s worldwide ad revenue.
- In the Asia-Pacific region, revenue reached USD 42.6 billion, up 7.1%, while in Europe it is projected to reach approximately USD 26.4 billion, up 3.9%.
- Ads in Facebook Stories are forecast to jump to USD 18.2 billion.
- Auto brands will spend USD 4.1 billion, 12.6% more, and travel and tourism USD 3.3 billion, up 8.4%.
Facebook Lead Ads Changes Statistics
- As of 2025, Facebook Lead Ads click-through rates increased in 9 of 15 industries.
- Cost per click (CPC) for Facebook lead campaigns increased overall, but 10 of 15 industries (67%) had CPC that remained the same or decreased.
- 87% of industries saw higher CPCs in Google Ads, with an overall increase of 12.88%.
- Lead Ads increased more slowly, with only 2.13% growth compared with 2024, and CPC remains much lower on Lead Ads (USD 1.92) than on Google Ads (USD 5.26).
- Conversion rates declined in 12 of 15 industries (80%) following an overall increase last year, possibly due to economic conditions.
- Cost per lead (CPL) rose in 9 of 15 industries (60%), increasing 20.94% overall to USD 27.66, likely due to competition, privacy constraints, and inflation.
- Though it remains well below Google Ads’ average CPL of USD 70.11.
- In Facebook traffic campaigns, CTR went up year over year in 11 of 22 industries (71%).
- Across 10 of 21 industries, CPC declined by 48%.
- The average CPC was USD 0.70, down 6.67% YoY and lower than USD 5.26 on Google Ads.
Industry-Wise Facebook Ad Statistics By Click-Through Rate and Cost Per Click
- According to Wordstream.com, in 2025, Shopping, Collectables, and Gifts had the highest click-through rate (4.13%), followed by Travel (2.76%) and Sports and Recreation (2.60%).
- The highest cost per click was in Finance and Insurance (USD 1.22), followed by Personal Services (USD 1) and Home and Home Improvement (USD 0.99).
Furthermore, other detailed analyses are mentioned below:
| Industry | CTR | CPC |
| Animals & Pets | 1.64% | USD 0.78 |
| Apparel/Fashion & Jewellery | 1.29% | USD 0.86 |
| Arts & Entertainment | 2.10% | USD 0.49 |
| Attorneys & Legal Services | 1.76% | USD 0.86 |
| Automotive (For Sale) | 1.48% | USD 0.79 |
| Automotive (Repair, Service & Parts) | 0.80% | USD 0.81 |
| Beauty & Personal Care | 1.81% | USD 0.74 |
| Business Services | 1.38% | USD 0.75 |
| Education & Instruction | 1.45% | USD 0.86 |
| Finance & Insurance | 0.98% | USD 1.22 |
| Furniture | 1.39% | USD 0.85 |
| Health & Fitness | 1.63% | USD 0.80 |
| Home & Home Improvement | 1.28% | USD 0.99 |
| Industrial & Commercial | 1.36% | USD 0.86 |
| Personal Services | 1.70% | USD 1 |
| Physicians & Surgeons | 0.83% | USD 0.82 |
| Real Estate | 1.68% | USD 0.91 |
| Restaurants & Food | 1.67% | USD 0.72 |
| Shopping, Collectables & Gifts | 4.13% | USD 0.34 |
| Sports & Recreation | 2.60% | USD 0.41 |
| Travel | 2.76% | USD 0.51 |
- In 2025, the Shopping, Collectables, and Gifts industry recorded the strongest Facebook ad engagement, with a click-through rate of 4.13%, indicating high user interest and relevance. The average cost per click was USD 0.34, making it one of the most cost-efficient sectors for advertisers.
- The Travel sector achieved a solid CTR of 2.76%, reflecting strong consumer intent during trip planning stages. Advertisers in this segment paid an average CPC of USD 0.51, supporting balanced performance between reach and cost.
- Sports and Recreation ads delivered a CTR of 2.60%, supported by interest-driven audiences. The CPC stood at USD 0.41, positioning this sector as both engaging and cost-effective.
- Arts and Entertainment campaigns generated a CTR of 2.10%, driven by content discovery behavior. The average CPC was USD 0.49, among the lower cost categories.
- Beauty and Personal Care advertising achieved a CTR of 1.81%, supported by repeat purchase behavior, with an average CPC of USD 0.74.
- Attorneys and Legal Services recorded a CTR of 1.76%, reflecting moderate engagement levels, while the CPC averaged USD 0.86, indicating competitive bidding.
- Personal Services ads reached a CTR of 1.70%, but the CPC was relatively high at USD 1.00, reflecting strong local competition.
- Real Estate advertising showed a CTR of 1.68%, with a CPC of USD 0.91, driven by high-value lead generation.
- Restaurants and Food ads posted a CTR of 1.67%, supported by frequent purchase cycles, and maintained a CPC of USD 0.72.
- Animals and Pets advertising achieved a CTR of 1.64%, while maintaining a CPC of USD 0.78, supported by emotional purchase drivers.
- Health and Fitness campaigns delivered a CTR of 1.63%, with advertisers paying an average CPC of USD 0.80.
- Education and Instruction ads recorded a CTR of 1.45%, with a CPC of USD 0.86, reflecting longer decision cycles.
- Business Services achieved a CTR of 1.38%, while the CPC remained moderate at USD 0.75.
- Industrial and Commercial advertising showed a CTR of 1.36%, with an average CPC of USD 0.86, influenced by niche targeting.
- Furniture ads generated a CTR of 1.39%, with a CPC of USD 0.85, reflecting considered purchase behavior.
- Apparel, Fashion, and Jewellery campaigns posted a CTR of 1.29%, while the CPC averaged USD 0.86, due to high brand competition.
- Home and Home Improvement advertising delivered a CTR of 1.28%, but experienced a higher CPC of USD 0.99, driven by high-intent audiences.
- Automotive (For Sale) ads achieved a CTR of 1.48%, with a CPC of USD 0.79, supported by comparison-driven searches.
- Automotive (Repair, Service, and Parts) recorded a lower CTR of 0.80%, while maintaining a CPC of USD 0.81.
- Physicians and Surgeons advertising showed a CTR of 0.83%, with a CPC of USD 0.82, reflecting cautious consumer decision-making.
- Finance and Insurance recorded the lowest engagement, with a CTR of 0.98%, while registering the highest CPC at USD 1.22, indicating intense competition and high customer lifetime value.
By Average Conversion Rate (CVR) and Cost Per Lead (CPL)
- As of 2025, Restaurants and Food convert at the highest rate in Facebook lead campaigns, with an 18.25% CVR, followed by Attorneys and Legal Services (10.53%) and Education and Instruction (10.05%).
- The most expensive leads came from Dentists and Dental Services (USD 76.71), Health and Fitness (USD 52.98), and Beauty and Personal Care (USD 51.42).
Other analyses are stated in the table below:
| Industry | Average CVR | Change Rate (YoY) |
Average CPL |
Change Rate (YoY) |
| Arts & Entertainment | 9.34% | -4.77% | USD 18.17 | +242.18% |
| Attorneys & Legal Services | 10.53% | +31.35% | USD 18.17 | -77.01% |
| Beauty & Personal Care | 5.29% | -23.96% | USD 51.42 | +37.71% |
| Career & Employment | 5.77% | -37.34% | USD 17.64 | +40.56% |
| Dentists & Dental Services | 6.38% | -17.31% | USD 76.71 | +97.40% |
| Education & Instruction | 10.08% | +23.70% | USD 28.22 | -25.91% |
| Furniture | 3.77% | -11.69% | USD 40.04 | -30.93% |
| Health & Fitness | 5.63% | -0.68% | USD 52.98 | -6.77% |
| Home & Home Improvement | 5.22% | -36.19% | USD 41.26 | +40.48% |
| Industrial & Commercial | 9.34% | -28.18% | USD 37.34 | +61.65% |
| Personal Services | 6.51% | -32.23% | USD 30.57 | +52.17% |
| Physicians & Surgeons | 4.51% | -0.99% | USD 47.47 | -18.11% |
| Real Estate | 9.53% | -1.51% | USD 16.61 | +13.85% |
| Restaurants & Food | 18.25% | +341.52% | USD 3.16 | -93.28% |
| Sports & Recreation | 5.48% | -32.88% | USD 19.30 | +25.90% |
- Attorneys and Legal Services achieved an average CVR of 10.53%, supported by a great 31.35% year-over-year improvement. The average CPL was USD 18.17, down 77.01%, suggesting improved lead quality and targeting accuracy.
- Education and Instruction maintained a solid average CVR of 10.08%, increasing by 23.70% year over year. The average CPL was USD 28.22, a 25.91% decline, reflecting stable demand and optimised acquisition strategies.
- Real Estate campaigns delivered an average CVR of 9.53%, with a marginal year-over-year decline of 1.51%. The average CPL was USD 16.61, up 13.85%, indicating increased competition for qualified leads.
- Arts and Entertainment achieved an average CVR of 9.34%, declining by 4.77% year over year. However, the average CPL increased sharply to USD 18.17, rising by 242.18%, suggesting reduced efficiency despite stable engagement.
- Industrial and Commercial advertisers recorded a CVR of 9.34%, down 28.18% year over year. The average CPL rose to USD 37.34, up 61.65%, highlighting higher acquisition costs in B2B-focused campaigns.
- Dentists and Dental Services reported an average CVR of 6.38%, down 17.31% year over year. This sector reported the highest average CPL at USD 76.71, with a 97.40% increase, reflecting intense competition and high lead value.
- Health and Fitness campaigns achieved a CVR of 5.63%, which remained relatively stable, with a 0.68% decline. The average CPL was USD 52.98, down 6.77%, indicating moderate cost control.
- Beauty and Personal Care recorded a CVR of 5.29%, down 23.96% year over year. The average CPL reached USD 51.42, up 37.71%, driven by saturation and intense brand competition.
- Personal Services recorded an average CVR of 6.51%, down 32.23% year over year. The average CPL increased to USD 30.57, up by 52.17%, indicating weaker targeting efficiency.
- Career and Employment campaigns achieved a CVR of 5.77%, a 37.34% decline. The average CPL was USD 17.64, increasing by 40.56%, reflecting lower engagement and higher acquisition costs.
- Home and Home Improvement recorded a CVR of 5.22%, down 36.19% year over year. The average CPL increased to USD 41.26, up 40.48%, indicating reduced conversion efficiency.
- Physicians and Surgeons recorded a lower average CVR of 4.51%, with a minor 0.99% year-over-year decline. The average CPL was USD 47.47, down 18.11%, indicating gradual optimisation.
- Furniture advertisers achieved one of the lowest CVRs at 3.77%, declining by 11.69% year over year. The average CPL was USD 40.04, down 30.93%, reflecting improved cost control despite weaker conversion rates.
- Sports and Recreation campaigns had an average CVR of 5.48%, down 32.88% year over year. The average CPL was USD 19.30, up 25.90%, indicating mixed performance across this segment.
Region-Wise Facebook Ad Statistics
- A report published by Increv.co indicates that the Asia-Pacific region accounts for 43% of Facebook’s global user base.
- In Europe, CPC is usually 15-20% higher than the global average.
- In Latin America, individuals exhibit 25% higher engagement with video content.
- North America has the highest average revenue per user, averaging USD 60.57.
Facebook Advertising Audience Statistics By Demographics, 2025
| Age Group (Year) |
Male Share | Female Share |
| 18-24 | 12.7% | 9.1% |
| 25-34 | 18.5% | 12.7% |
| 35-44 | 11.7% | 8.7% |
| 45-54 | 6.6% | 5.7% |
| 55-64 | 4.0% | 3.9% |
| 65 and above | 3.0% | 3.4% |
- Among users aged 18 to 24 years, male audiences account for USD 12.7% of Facebook’s advertising reach, while female audiences represent USD 9.1%, indicating a stronger male presence in this younger group.
- In the 25-34 age group, male users account for the largest share at USD 18.5%, compared with USD 12.7% for female users, making this segment the most active and valuable for advertisers.
- Among users aged 35 to 44 years, the male audience share is USD 11.7%, while the female share is slightly lower at USD 8.7%, reflecting steady engagement among mid-career professionals.
- Within the 45 to 54 years category, male users contribute USD 6.6% of the audience, and female users contribute USD 5.7%, showing a more balanced gender distribution.
- In the 55-64 age group, Facebook’s advertising audience is almost evenly split, with males at USD 4.0% and females at USD 3.9%, suggesting stable usage among older adults.
- Among users aged 65 years and above, female users slightly exceed males, at USD 3.4% versus USD 3.0%, indicating continued platform relevance among senior users, particularly women.
Video And Mobile Ad Trends On Facebook
- Video makes up more than 60% of the time people spend on Facebook.
- Vertical videos with sound bring a 12% higher conversion rate than other video styles.
- Reels ads using vertical video with audio get a 35% higher CTR than other Reels formats.
- Overall, video content creates 85% of ad engagement on Facebook.
- Short videos under 15 seconds have 23% higher completion rates.
- Mobile video ads under 15 seconds can bring a 12.3% lower cost per acquisition.
- Meanwhile, 9:16 Reels-style vertical videos performed 35% better than other formats.
- The vertical videos with sound lifted the brand share to 67%.
- In the U.S., Meta held 40.7% of social video viewing time by 2025.
Facebook Ads Best Practices Statistics
- Facebook feed ads reports stated that Meta recommends using images at least 1080 pixels wide.
- For Reels, leave a space of about 14% at the top, 35% at the bottom, and 6% on the left and right, with no text, logos, or visuals in those zones.
- In a study of 752,626 Facebook ads, AdEspresso reported a median headline length of 5 words.
- Meanwhile, the average ad text length is about 19 words.
- The top 5 most commonly used call-to-action buttons on Facebook ads are Learn More, Contact Us, Sign Up, Call Now, and Download.
Facebook Ads Performance Statistics
- A survey from Databox indicates that 54% of marketers report that Facebook ads are very effective for sales, whereas only 8% report that they are ineffective.
- Regarding ROI, 29% report that Facebook delivers the greatest return among platforms.
- 67.55% of Facebook advertisers stated that videos receive more clicks than other formats.
- For 42.9% of marketers, the optimal audience size is over 50,000.
- In the second quarter of 2025, CPM fell 5% year over year, with an average CPM of USD 1.12.
- In the United States, CPM reached USD 4.29 in 2024, approximately 3.83 times the global figure.
- Facebook’s U.S. advertising revenue totalled USD 32.55 billion in 2024.
- Metricool further reported that App Promotion has the highest CPC at USD 0.32, whereas Traffic has the lowest at USD 0.04.
- WordStream reports that Facebook ads average a cost-per-action of USD 19.68, with an 8.95% conversion rate, ranging from 3.95% to 11.34% across industries.
- The average lead cost is USD 23.10, with legal services at the highest at USD 78.26 and real estate at the lowest at USD 12.43.
Facebook Ads Statistics By Usage and Reach
- According to marketingltb.com, over 90% of marketers use Facebook Ads.
- Each month, the ads can reach more than 2 billion active users.
- The average person clicks about 10 ads a month.
- More than 75% of global social media advertising budgets are allocated to Facebook and Instagram.
- Ads run in more than 190 countries, and approximately 10 million advertisers are active monthly.
- The ad audience comprises more than one-third of the world’s population aged 13 and above and nearly 60% of internet users.
By AI and Automation
- In 2025, 82% use Meta Advantage+, while AI bidding delivers a 27% higher ROAS than manual bidding.
- AI bidding gives 27% higher ROAS than manual bidding.
- Meanwhile, creative automation delivers 45% more ad variants without added production time.
- AI targeting CTR increased by 33.2% in niche e-commerce.
- Meta’s predictive analytics suggests optimisations every 72 hours. ChatGPT copywriting in Ads Manager is used by 1 in 4 marketers.
- Dynamic scene-switching AI video increases watch time 21%.
- Creative AI reduces ad fatigue by 15.6%, and Meta’s ML reduces setup time by 46%.
Conclusion
After completing the article on Facebook Ads Statistics, ads remain a strong, trackable way to reach people and drive results. The above analyses often vary based on the target audience, ad design quality, and goal (e.g., sales or leads). Short videos and mobile ads usually receive more attention.
Better results can be observed when different ad versions are tested, older ads are replaced before people become bored, and the campaign is optimised for the intended action. Ads using tools such as Pixel or CAPI that help identify what works best and reallocate budget to the top-performing audiences.
FAQ.
Facebook ads appeared across Facebook, Instagram, Messenger, and the Audience Network, including placements like feeds and stories.
After the ad was published, Meta reviewed it, and it typically began running once approved, often within 24 hours.
There was no set minimum budget, but spending typically increased after performance became stable and began to improve.
Ads performed best when they had a clear offer, a strong opening hook, mobile-first visuals, short videos, a fast landing page, and a simple call to action.
It worked well to begin with 3-6 creative versions across 1-2 audiences, then keep testing and scaling the top performers based on results.

Maitrayee Dey has a background in Electrical Engineering and has worked in various technical roles before transitioning to writing. Specializing in technology and Artificial Intelligence, she has served as an Academic Research Analyst and Freelance Writer, particularly focusing on education and healthcare in Australia. Maitrayee's lifelong passions for writing and painting led her to pursue a full-time writing career. She is also the creator of a cooking YouTube channel, where she shares her culinary adventures. At Smartphone Thoughts, Maitrayee brings her expertise in technology to provide in-depth smartphone reviews and app-related statistics, making complex topics easy to understand for all readers.