How Many Ecommerce Sites Are There in the World?
Updated · Feb 24, 2026


Table of Contents
- Introduction
- E-commerce Sites Growth Analysis (From 2004 to 2024)
- E-commerce Websites in the United States
- Which eCommerce Websites are the Most Popular in 2025?
- Top 10 eCommerce Websites in the United States
- Most E-commerce Sites in the Top 10 Countries
- Top eCommerce Platforms Market Share
- E-commerce Platforms Market Share of Top 10 Countries
- How Many eCommerce Stores are Available?
- Number of eCommerce Stores Analysis by Region, 2025
- By Country
- By Industry Vertical
- Future of eCommerce Websites
Introduction
As of 2025, analytics firms place the number of active e‑commerce sites worldwide at roughly 28 million, according to SellersCommerce’s mid‑2025 review; that total is expanding by about 2,162 new stores every day and still sees one site in every two registered in the United States. Independent tallies underline methodological variation, with Markinblog’s February 2025 audit recording about 24 million sites while SEO.ai’s Q2 2024 snapshot counted 30.7 million.
BuiltWith’s July 2025 analysis adds that 49% of all e‑commerce domains—over 13 million—reside in the United States, whereas the United Kingdom, Australia, Germany, and Brazil each capture between 2% and 5%. Together, these figures answer the question—there are around 28 million e‑commerce sites in the world today—and highlight a still‑growing but maturing digital‑retail ecosystem whose competitive intensity shows no sign of easing.
 (Reference: nitrocdn.com)
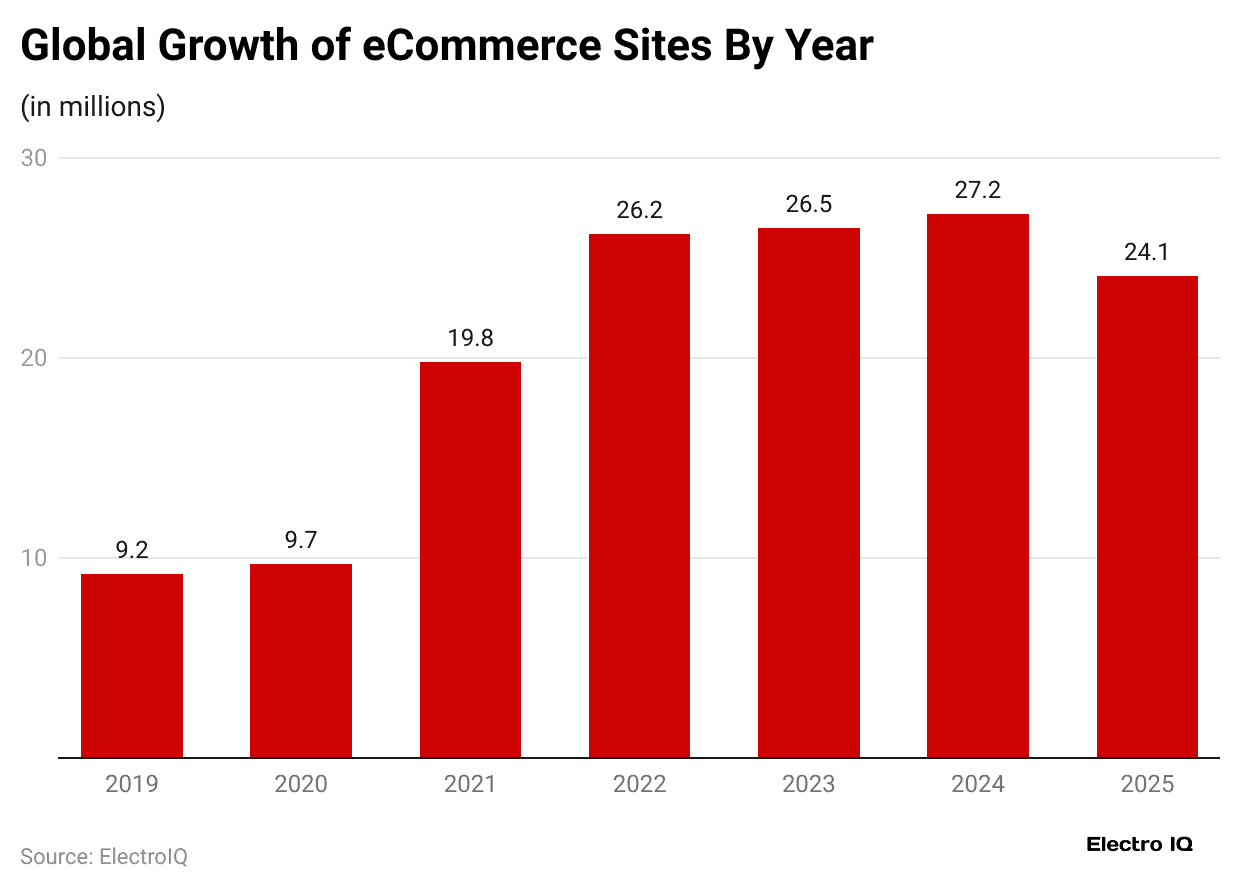
- Marketing Blog estimated that there are almost 24.1 million eCommerce websites globally, down by 11.4% from last year.
- Between 2023 and 2024, the number of websites went up slightly by 2.6%, reaching 27.2 million.
- According to a report published by Sellers Commerce in 2025, around 50% of all e-commerce websites are based in the United States of America.
E-commerce Sites Growth Analysis (From 2004 to 2024)
 (Reference: doofinder.com)
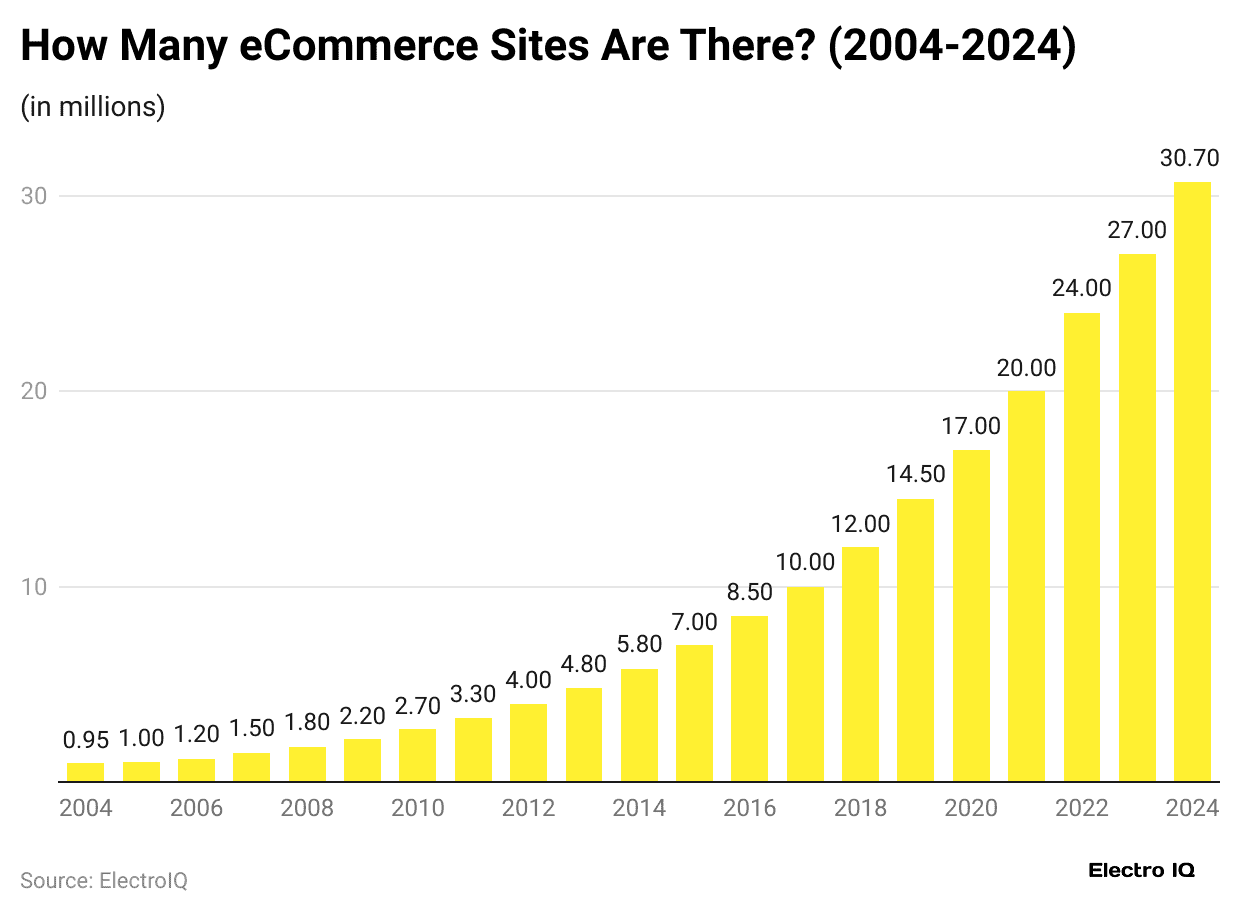
- In 2024, more than 30.7 million eCommerce websites existed around the world, the highest number of sites in the last 20 years.
| Year | Number of eCommerce websites (millions) | Change rate |
| 2024 | 30.7 |
+14% |
|
2023 |
27 | +13% |
| 2022 | 24 |
+20% |
|
2021 |
20 | +18% |
| 2020 | 17 |
+17% |
|
2019 |
14.5 | +21% |
| 2018 | 12 |
+20% |
|
2017 |
10 | +18% |
| 2016 | 8.5 |
+21% |
|
2015 |
7 | +21% |
| 2014 | 5.8 |
+21% |
|
2013 |
4.8 | +20% |
| 2012 | 4 |
+21% |
|
2011 |
3.3 | +22% |
| 2010 | 2.7 |
+23% |
|
2009 |
2.2 | +22% |
| 2008 | 1.8 |
+20% |
|
2007 |
1.5 | +25% |
| 2006 | 1.2 |
+20% |
|
2005 |
1,000,000 | +5% |
| 2004 | 950,000 |
– |
E-commerce Websites in the United States
- As of 2025, there will be around 11.9 million eCommerce websites in the United States, which decreased by 13.1% from last year, according to Marketing Blog.
- In 2024, the number of websites dropped slightly to 13.7 million, showing a small 2.1% decline from 2023.
The number of e-commerce websites has grown a lot over the years:
| Year | Number of eCommerce websites (millions) | YoY (Growth rate) |
| 2023 | 14 | +47.2% |
| 2022 | 9.5 | +10.4% |
| 2021 | 8.6 | +30.3% |
| 2020 | 6.6 | +83.3% |
| 2019 | 3.6 | – |
Which eCommerce Websites are the Most Popular in 2025?
#1. Amazon
- According to Red Stag Fulfilment’s report analysis, from May to June 2025, Amazon.com attracted around 2.3 to 2.8 billion visits per month, resulting in approximately 86 to 90 million daily visitors.
- About 70% to 75% of this traffic came from mobile devices, and roughly 83% to 86% of users were located in the U.S., India, and Canada.
- Visitors spend around 11 to 12 minutes per session, viewing an average of 6 to 9 pages each visit.
- In the U.S. alone, Amazon holds approximately 37.6% to 40.4% of the e‑commerce market share, equivalent to USD 447 to USD 492 billion in online retail sales in 2024 to 2025.
- eDesk further states that in 2024, Amazon’s total net sales reached USD 638 billion, with projections targeting USD 700 billion by the end of 2025.
#2. eBay
- investors.ebayinc.com states that eBay was founded in September 1995 and is based in San Jose, California, and operates a global online marketplace across 190 countries.
- The website is connecting 132 to 134 million active buyers with some 18 to 18.3 million sellers amid approximately 2.3 billion live listings.
- In 2024, it generated around USD 10.3 billion in revenues, a year-over‑year increase of about 1.7%, and facilitated USD 74.7 billion in Gross Merchandise Volume (GMV), with quarterly GMV rising to USD 19.3 billion in Q4.
- In the first quarter of 2025, eBay reported USD 2.6 billion in revenue, a 1% to 2% quarterly gain, and GMV near USD 18.8 billion, while international sales made up 48% of its revenue.
- In the same period, the company also returned over USD 750 million to shareholders.
#3. AliExpress
- In May 2025, AliExpress attracted about 599.3 million visits, earning a global website traffic rank of #51 according to SimilarWeb.
- In June 2025, Semrush reported 765.8 million visits, with users spending an average of 10 minutes and 32 seconds per session, and 4.39 pages per visit, although traffic dropped about 8.6% month-on-month.
- According to Techjury report analysis, the mobile app boasted 8.18 million monthly active users as of March 2024, representing a 130 % year‑on‑year increase.
- Additionally, the AliExpress app has surpassed 600 million total downloads globally.
- ecombusinesshub.com also shows that the platform lists over 2.5 billion product listings and operates in 18 languages, serving buyers over 230 countries and regions.
#4. Walmart
- Semrush reports state that in June 2025, Walmart.com averaged around 480 million visits per month globally.
- The website’s average user spending was 11 minutes per session and viewing roughly 4.8 pages, with a bounce rate standing at about 51.4%
- In early 2025, data from Exploding Topics showed approximately 527 million monthly visits with a slightly higher bounce rate of 51.52% and average session duration of 10:59.
- According to BloggingWizard, Walmart.com had 382 million monthly visits on average and ranked third among U.S. e‑commerce sites, with an average visit duration of 4 minutes 40 seconds and 4.89 pages per session.
- On the sales front, Walmart generated around USD 60.41 billion in global net e‑commerce revenue in fiscal year 2024, up from USD 58.12 billion in 202,3 with a growth rate of nearly 4% year-over-year.
- Digital Commerce 360 also shows that over the full fiscal year 2025, total global revenue hit USD 681 billion, growing 5.1% year-over-year.
#5. Etsy
- Yaguara.co further states that in 2024, more than 417 million people visited Etsy, and about 53.25% of them were from the United States.
- The platform connected about 95.5 million active buyers and 8.13 million active sellers in 2024, with a decrease of roughly 10% in seller count compared to the previous year.
- In the same year, Etsy made USD 2.808 billion from its marketplace, while it also earned USD 542.7 million from services.
- investors.etsy.com depicts over the year, its Gross Merchandise Sales (GMS), which reflect the total value of goods sold across Etsy, Reverb, and Depo, reached around USD 12.59 billion, marking a 4.4% year‑on‑year decline compared with 2023.
- According to Hipster Fashion, Etsy’s marketplace hosted over 100 million active listings, supported by traffic of around 400 to 500 million visits per month, peaking at 536 million visits in December 2024.
Top 10 eCommerce Websites in the United States
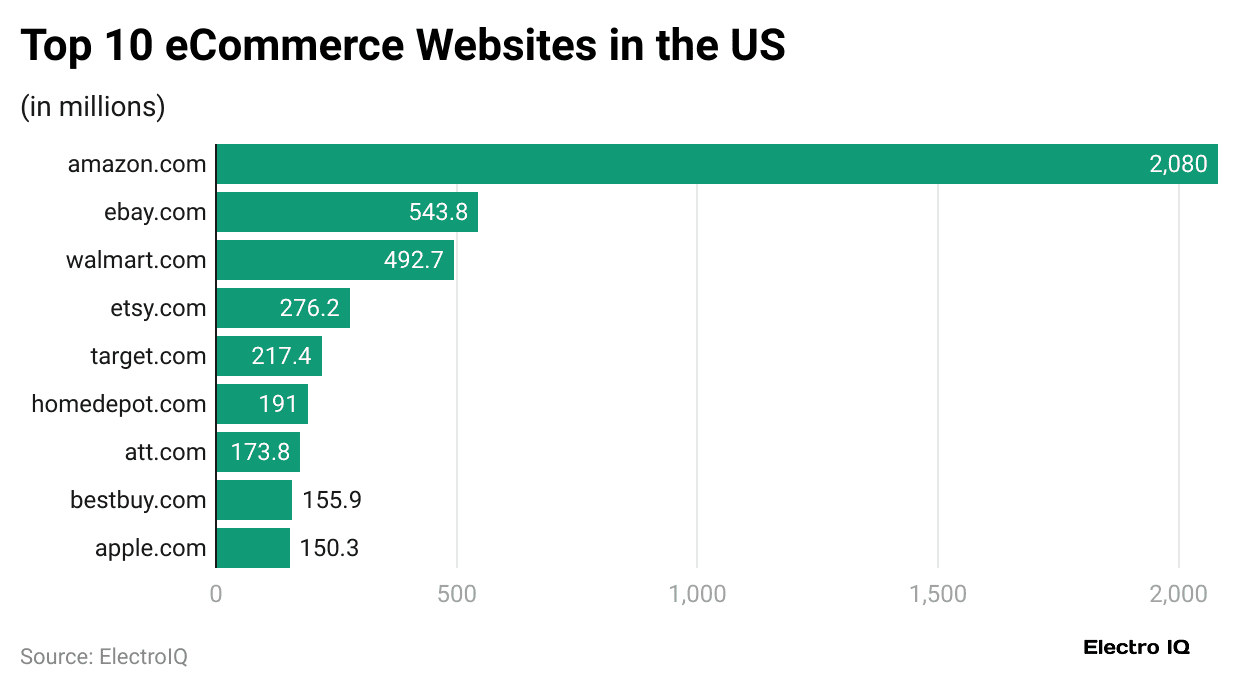
- In 2024, Amazon.com is the most visited e-commerce website in the United States, getting about 2.08 billion visits every month.
- eBay.com comes next with around 543.8 million monthly visits, and Walmart.com takes third place with roughly 492.7 million visits each month.
- com secures the fourth spot with 276.2 million monthly visits, while Target.com comes next with 217.4 million.
- T-Mobile.com and HomeDepot.com follow closely, attracting 202.3 million and 191.0 million visitors, respectively.
- com ranks eighth with 173.8 million visits, just ahead of BestBuy.com with 155.9 million.
- Rounding out the list is Apple.com, drawing about 150.3 million monthly visits.
Most E-commerce Sites in the Top 10 Countries
 (Source: doofinder.com)
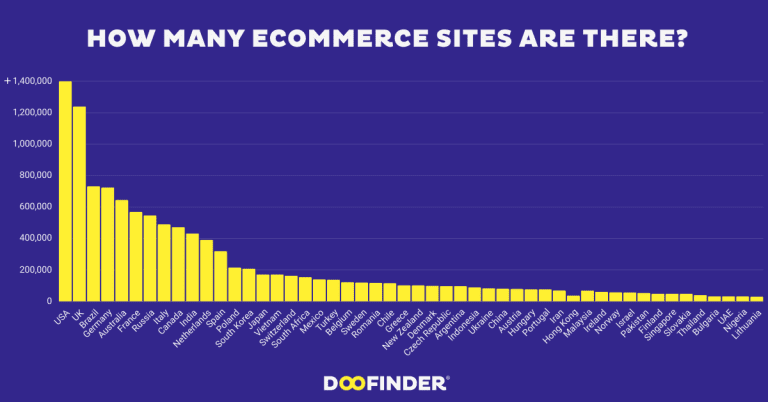
- In 2024, the United States remained the top country in global e-commerce, with around 13.98 million online shopping websites.
- This number shows a 47.2% increase compared to 2023.
Furthermore, other top 9 countries total number of eCommerce websites in 2024 is stated in the table below:
| Country | Number of eCommerce sites | Change rate (YoY) |
| United Kingdom | 1.24 million | 45.9% |
| Brazil | 731,900 | 36.9% |
| Germany | 724,800 | 56.5% |
| Australia | 645,300 | 62.5% |
| France | 568,600 | 83.9% |
| Russia | 547,600 | 71.9% |
| Italy | 490,400 | 75.0% |
| Canada | 472,000 | 56.7% |
| India | 432,700 | 226.3% |
 (Reference: theretailexec.com)
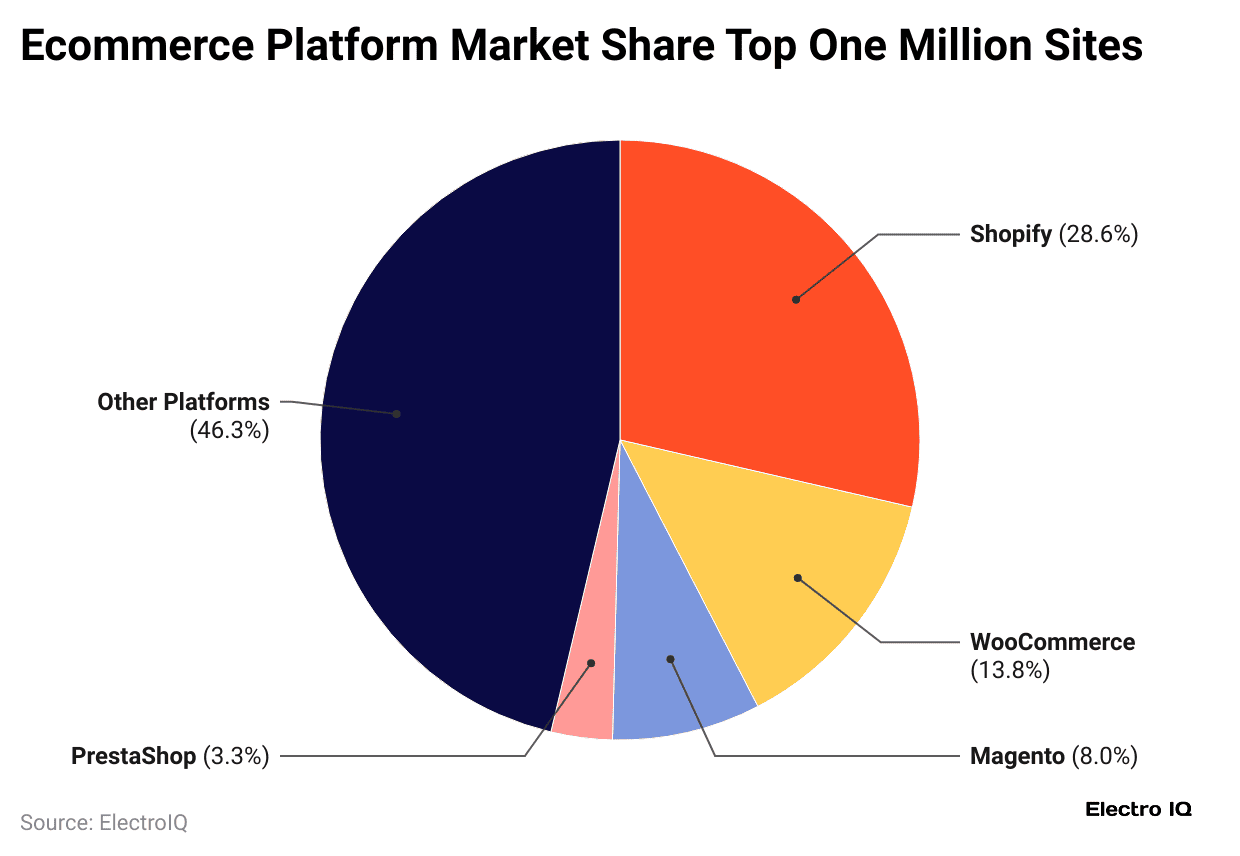
- In the first quarter of 2025, Shopify held the largest share among ecommerce platforms across various website rankings, with 28.6% of the top one million ecommerce sites globally.
- Followed by a 25.7% share of the top 100,000 sites and 24.3% of the top 10,000 sites.
- Shopify is especially popular in countries such as the United States, the United Kingdom, Australia, Brazil, Germany, and Canada.
In the same duration, other e-commerce platforms’ market share is mentioned in the table below:
| Platform Names | The top one million sites | Top 100k sites | Top 10k sites |
| WooCommerce | 13.8% | 9.8% | 5.2% |
| Magento | 8% | 7.7% | 6.7% |
| PrestaShop | 3.3% | 1.43% | >1% |
| Amplience | 1.77% | 6.7% | 11.1% |
| Others | 46.3% | 50.2% | 52.8% |
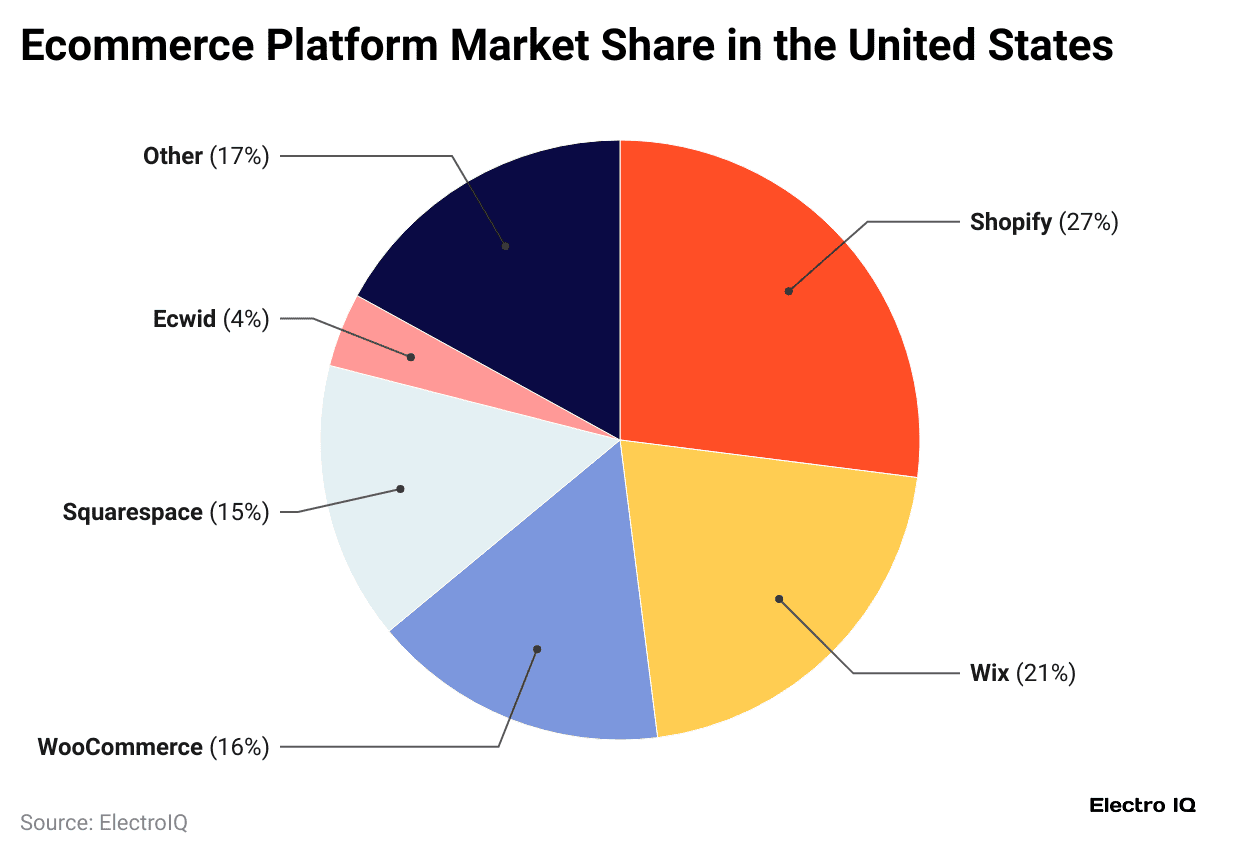
- As of the first quarter of 2025, the top ecommerce platform in the United States was captured by Shopify, holding a market share of 27%.
- Wix comes next with 21%, followed by WooCommerce at 16% and Squarespace at 15%.
- Ecwid has a smaller share of 4%, and all other platforms together make up the remaining 17%.
Meanwhile, other countries’ e-commerce platform market shares are stated in the table below:
| Country | Shopify | Wix | WooCommerce | Squarespace | Ecwid | Other |
| United Kingdom | 22% | 22% | 19% | 13% | 8% | 17% |
| Australia | 28% | 16% | 17% | 24% | 5% | 9% |
| Germany | 25% | 16% | 10% | 4% | 19% | 26% |
| Brazil | 21% | 14% | 8% | – | – | 36% |
| Canada | 29% | 21% | 14% | 23% | 3% | 10% |
| France | 20% | 23% | 13% | – | 14% | 18% |
| India | 24% | 16% | 44% | – | – | 11% |
| Italy | 17% | 15% | 27% | – | 20% | 13% |
| Netherlands | 24% | 11% | 21% | 5% | 11% | 28% |
| Spain | 13% | – | 23% | 16% | 10% | 24% |
How Many eCommerce Stores are Available?
 (Source: redstagfulfillment.com)
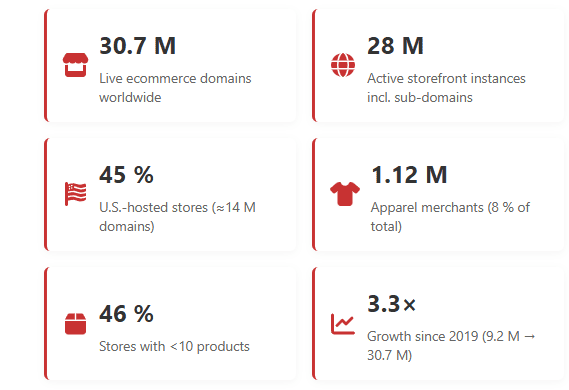
- As of April 2025, there are approximately 30.7 million live e-commerce domains worldwide, with 28 million active storefront instances, including sub-domains.
- The United States hosts around 45% of these stores, about 14 million domains.
- Notably, 46% of e-commerce stores list fewer than ten products, showing a strong presence of small sellers.
- The apparel sector alone accounts for 1.12 million merchants, making up 8% of the total.
- Since 2019, the number of e-commerce stores has grown 3.3 times, rising from 9.2 million to 30.7 million.
Number of eCommerce Stores Analysis by Region, 2025
| Region | Stores (million) | Share |
| North America | 3.54 | 25.6% |
| Europe | 1.65 | 11.9% |
| South America | 0.45 | 3.2% |
| Oceania | 0.34 | 2.5% |
| Asia | 0.32 | 2.3% |
| Other / Unknown | 7.55 | 54.5% |
By Country
| Country | Stores |
| United States | 3,179,766 |
| United Kingdom | 653,249 |
| Brazil | 448,250 |
| Germany | 415,151 |
| Canada | 361,212 |
| Australia | 340,255 |
| India | 317,972 |
| France | 311,169 |
| Netherlands | 267,563 |
| Undisclosed | 3,401,568 |
By Industry Vertical
| Vertical | Stores | Share |
| Apparel | 1,122,660 | 8.1 % |
| Home & Garden | 787,680 | 5.7 % |
| Food & Drink | 580,820 | 4.2 % |
| Beauty & Fitness | 554,891 | 4.0 % |
| Arts & Entertainment | 480,163 | 3.5 % |
Future of eCommerce Websites
eCommerce websites are moving towards a smarter and more engaging future. New tech like AR, voice search, and AI will help create shopping experiences that match each shopper’s needs. Buying on phones, social apps, and with one-click checkouts will get easier. People also want safer, greener, and more honest brands, so companies will need to make better, more responsible choices.
Sources

Maitrayee Dey has a background in Electrical Engineering and has worked in various technical roles before transitioning to writing. Specializing in technology and Artificial Intelligence, she has served as an Academic Research Analyst and Freelance Writer, particularly focusing on education and healthcare in Australia. Maitrayee's lifelong passions for writing and painting led her to pursue a full-time writing career. She is also the creator of a cooking YouTube channel, where she shares her culinary adventures. At Smartphone Thoughts, Maitrayee brings her expertise in technology to provide in-depth smartphone reviews and app-related statistics, making complex topics easy to understand for all readers.


