How Many People Use Google Shopping? Statistics and Facts (2025)
Updated · Sep 22, 2025

Table of Contents
- Introduction
- Google Shopping User Statistics
- What are Google Shopping Users’ Average Monthly Budget, Cost Per Click (CPC), And Click-Through Rate (CTR) in Different Industries?
- What is the User Behavior of Google Shoppers?
- What are Google Shopping Website Traffic Statistics?
- Shopping.google.com User Demographics Statistics
- By Country
- What is Google Shoppers’ Brand Awareness?
- Google Shopping Statistics in Different Platforms
- Google Search Ad Spending Statistics
Introduction
How Many People Use Google Shopping? Google Shopping is a tool by Google that helps people search for and compare products from various online stores. It’s like a product search engine where users can check prices, brands, and stores all in one place.
(Source: adwordsrobot.com)
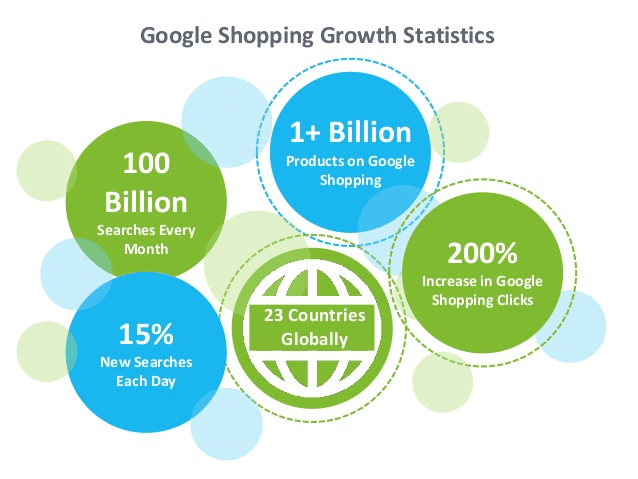
- Google Shopping is growing rapidly, with over 100 billion monthly searches and 15% being brand-new each day.
- It offers more than 1 billion products and operates in 23 countries.
- In contrast, a 200% rise in clicks shows increasing user engagement.
Google Shopping User Statistics
- As per Business Dasher, around 1.2 billion searches are made on Google Shopping every month in 2025.
- It also plays a big role in product discovery, accounting for 36% of such searches, as per the reports of AI.
- When users click on a product page, only about 1.91% of them end up buying the item.
- However, Google Shopping ads are highly effective as they make up 76% of retail search ad spending and bring in 85% of all clicks from Google Ads and Shopping campaigns.
- Besides, 19% of people who look for a product on Google end up clicking on a Shopping result.
- Around 65% of all paid search clicks on Google come from mobile phones.
- According to KlientBoost, 70% of smartphone users search online for details before they go to a store to buy something.
What are Google Shopping Users’ Average Monthly Budget, Cost Per Click (CPC), And Click-Through Rate (CTR) in Different Industries?
| Industry | Average Monthly Costs (USD) | Average CPC (USD) | Average CTR |
| Health & Beauty | 1,815.12 | 0.87 |
0.74% |
|
Computers & Technology |
1,473.32 | 0.89 | 0.55% |
| HVAC & Climate Control | 1,116.21 | 0.47 |
1.12% |
|
Food & Alcohol |
1,065 | 0.42 | 0.91% |
| Automotive Supplies | 988.34 | 0.56 |
1.20% |
|
Home & Garden |
864.87 | 0.58 | 0.90% |
| Office & Business Needs | 835.77 | 1.09 |
0.65% |
|
Clothing & Apparel |
801.74 | 0.82 | 0.76% |
| Entertainment & Events | 770.41 | 0.48 |
0.92% |
|
Chemical & Industrial |
638.66 | 0.66 | 0.89% |
| Medical Supplies | 423.37 | 0.63 |
0.87% |
|
Art & Music |
421.02 | 0.34 | 0.76% |
| Pet Care | 384.73 | 0.82 |
0.68% |
|
Child & Infant Care |
381.46 | 0.36 | 0.71% |
| Educational Supplies | 296.43 | 0.83 |
0.94% |
|
Travel & Luggage |
273.35 | 0.4 |
0.99% |
What is the User Behavior of Google Shoppers?
- According to the Grow My Ads report, about 83% of shoppers buy from the same store again because it makes returns easier.
- Nearly 72% of people with voice-activated speakers use them daily.
- Around 70% of smartphone users search on Google for product details before buying in a store.
- Moreover, 65% of all paid Google search ad clicks come from people using mobile phones.
- At the start of shopping, 60% of people turn to Google, while 59% of shoppers prefer stores that make mobile shopping simple.
- In contrast 44% use their phones to buy household products, and 35% of buyers kept buying from brands they first found online or in ads.
What are Google Shopping Website Traffic Statistics?
 (Reference: similarweb.com)
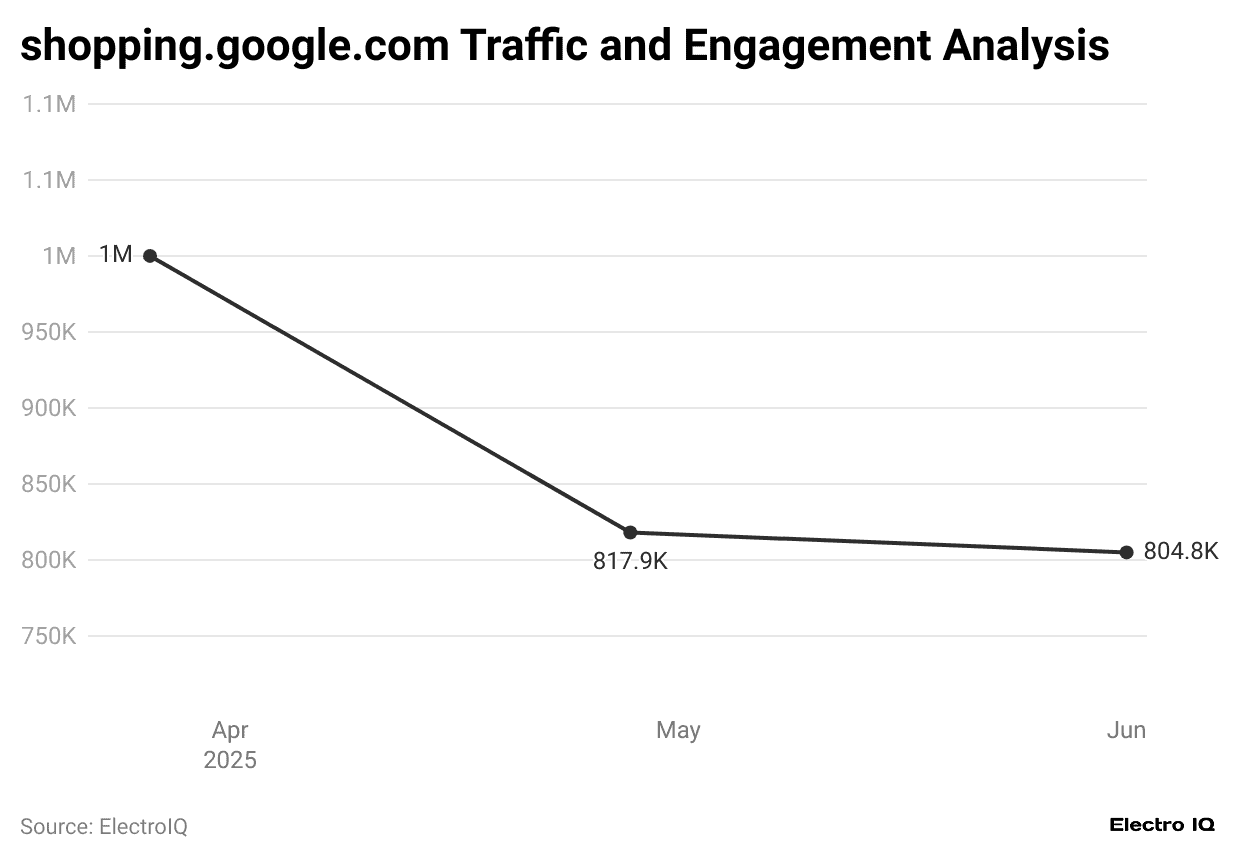
- Google Shopping received around 804,800 total visits in June 2025, an increase of 1.6% from the previous month.
- The website maintained a relatively low bounce rate of 33.64%.
- On average, visitors viewed 5.89 pages per session and spent about 1 minute and 6 seconds on the site during each visit.
Shopping.google.com User Demographics Statistics
- As per Similarweb data, most of the visitors to shopping.google.com are men, making up 58.07% of the audience, while women account for 41.93%.
 (Reference: similarweb.com)
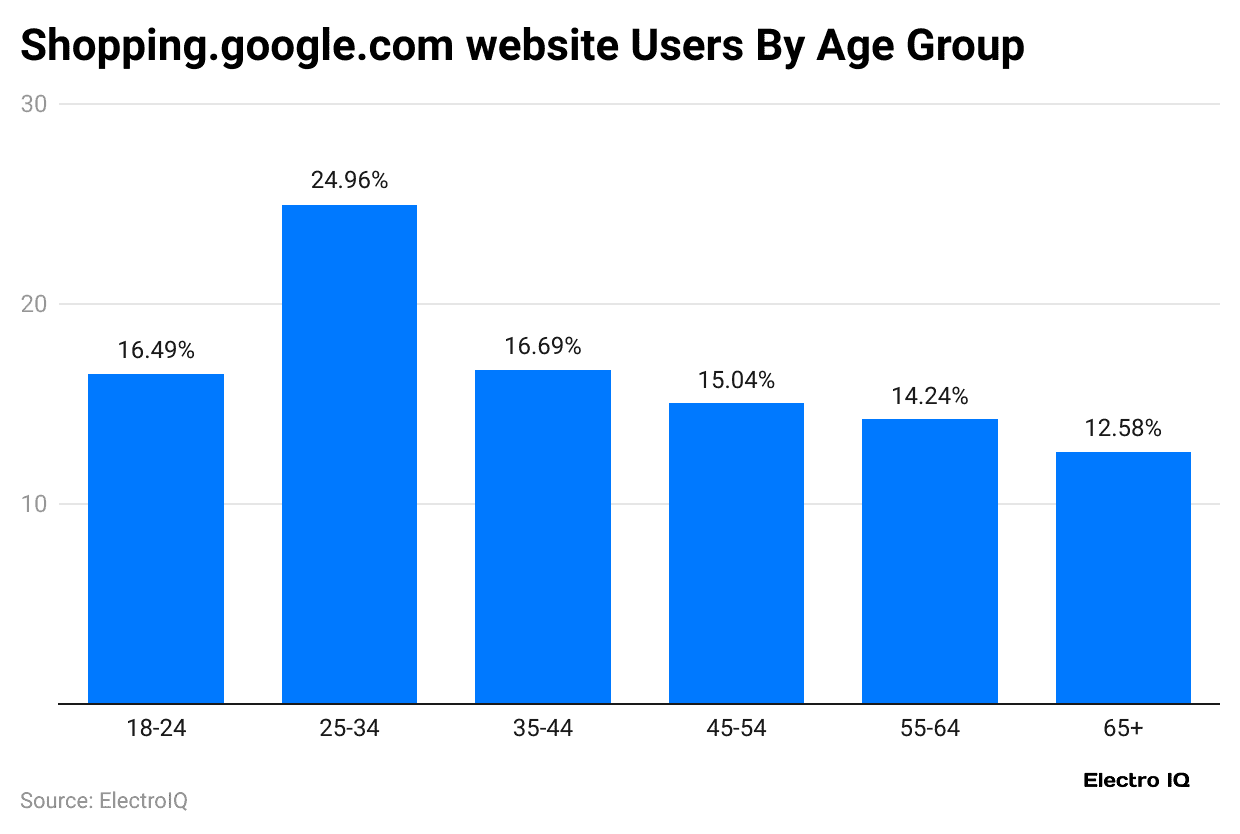
- As of June 2025, the total number of shopping.google.com website users aged 25 to 34 years accounted for the highest share, at 24.96%, followed by those aged 35 to 44 years at 16.69%.
- Furthermore, the age distribution of other users is as follows: 18 to 24 years (16.49%), 45 to 54 years (15.04%), 55 to 64 years (14,24%), and 65 years and older (12.58%).
By Country
 (Reference: similarweb.com)
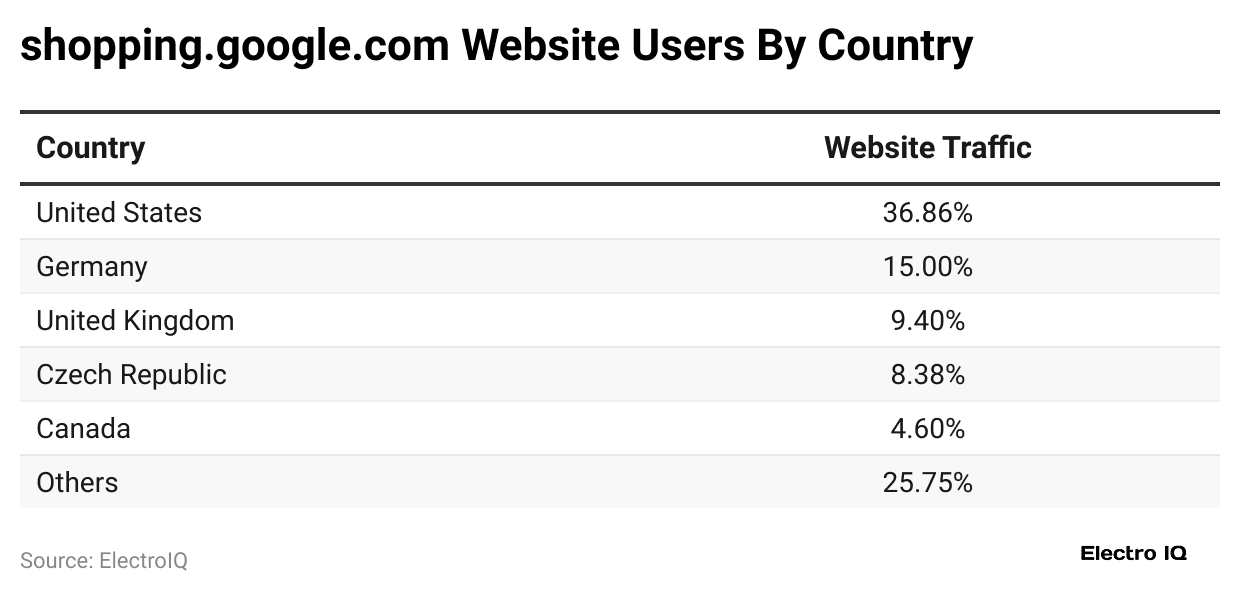
- In the same period, the United States leads in Google Shopping traffic, contributing 36.86% of total visits to shopping.google.com, up by 12.48% from May 2025.
- Germany follows with 15% (+2.69%), while the United Kingdom accounts for 9.4% (+6.74%).
- The Czech Republic and Canada contribute 8.38% (+21.74%) and 4.6% (-30.75%), respectively.
- Combined, other countries make up 25.75% of the platform’s traffic.
What is Google Shoppers’ Brand Awareness?
 (Reference: statista.com)
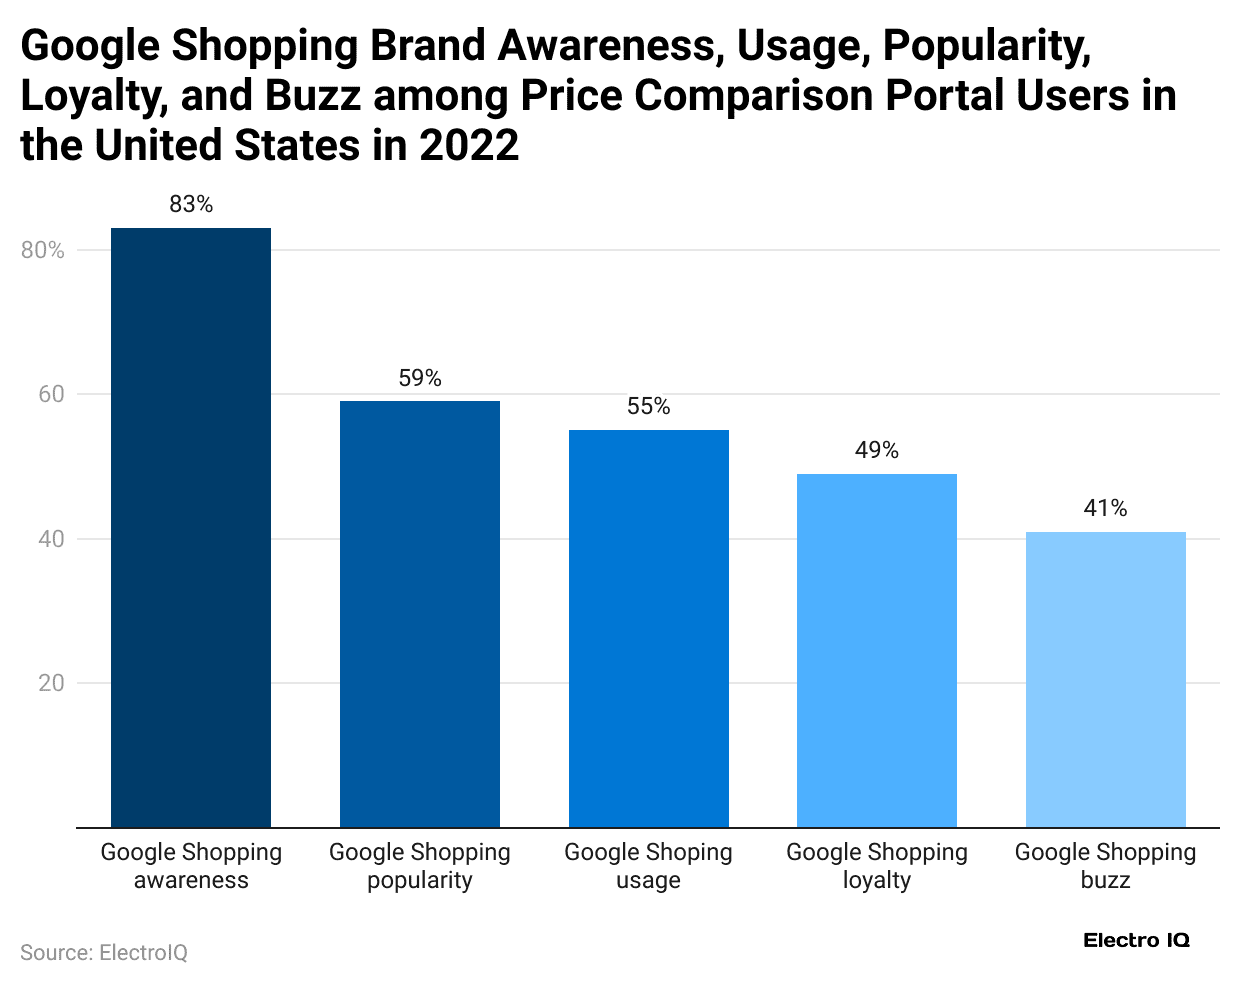
- According to a Statista report, 83% of people in the U.S. know about Google Shopping.
- About 59% of users who compare prices online say they like using it, while Google Shopping handles 55% of online shopping traffic.
- Nearly 49% of users stick with it regularly, and around 41% of U.S. shoppers have used it.
Google Shopping Statistics in Different Platforms
 (Reference: statcounter.com)
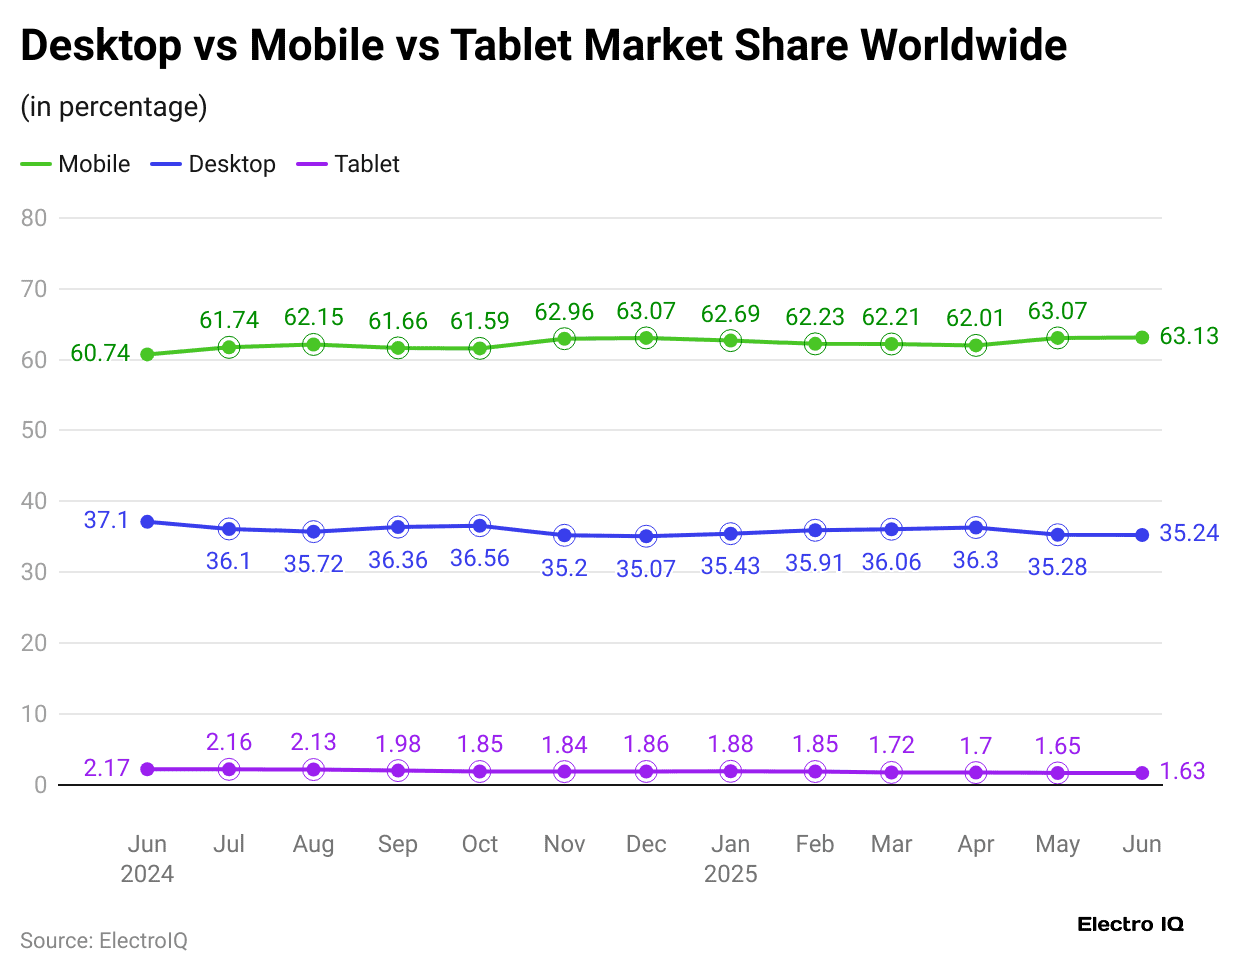
- As of June 2025, Google Shopping is mostly used on mobile devices, making up 63.13% of its traffic.
- Meanwhile, desktop users account for 35.24%, while only 1.63% of people use tablets.
Furthermore, Google Shopping’s monthly market share by other platforms in 2025 is mentioned below
| Month | Desktop | Mobile | Tablet |
| January | 62.69% | 35.43% | 1.88% |
| February | 62.23% | 35.91% | 1.85% |
| March | 62.21% | 36.06% | 1.72% |
| April | 62.01% | 36.3% | 1.7% |
| May | 63.07% | 35.28% | 1.65% |
Google Search Ad Spending Statistics
 (Source: searchengineland.com)
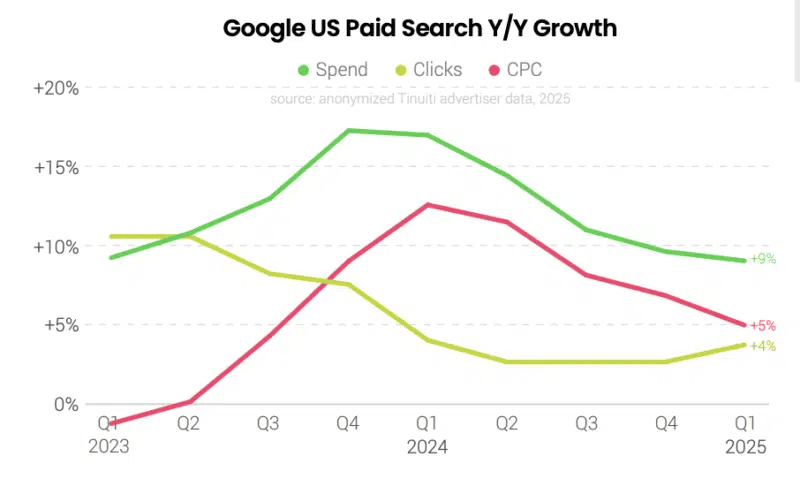
- In Q1 2025, Google Search ad spending increased by 9% year-over-year and decreased by 10% in Q4 2024.
- In contrast, the click growth held steady at 4% year-over-year, while the average cost per click (CPC) rose by 5% YoY.
 (Source: searchengineland.com)
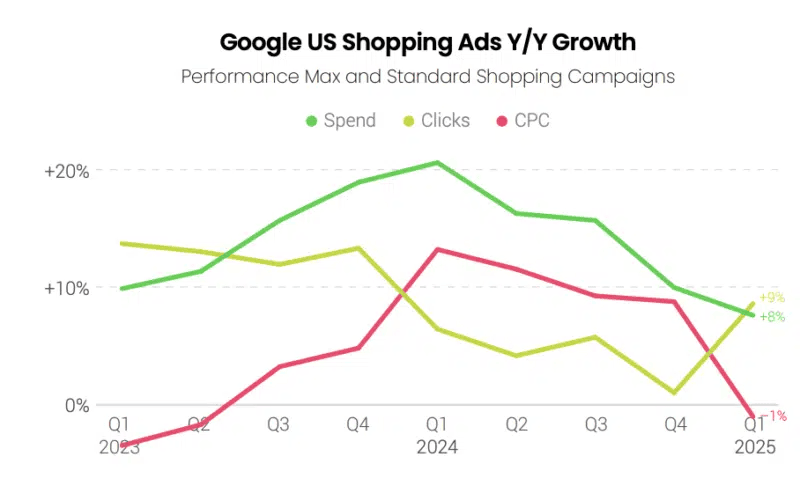
- Shopping ad spending grew by 8% year-over-year, slightly lower than the 10% growth seen in Q4 2024, while click volume rose by 9%, a strong rebound from just 1% growth in the previous quarter.
- Cost-per-click (CPC) remained stable, resulting in 1% year-over-year decrease.
 (Reference: searchengineland.com)
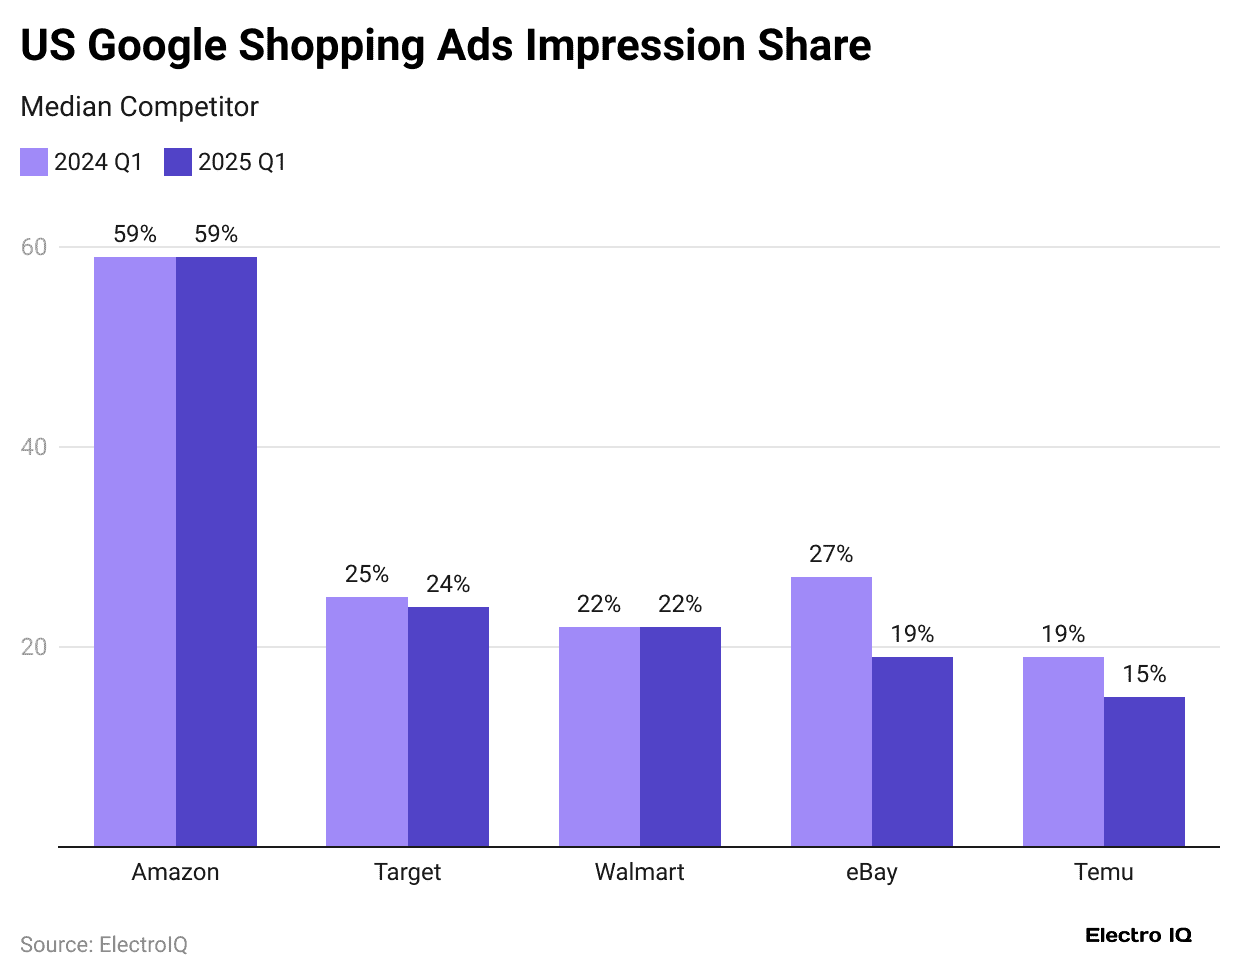
- In the U.S., Google Shopping Ads data shows that Amazon accounted for the highest share of 59% in both Q1 2024 and Q1 2025.
- Target’s share ranks in second position, from 25% (2025) to 24% (2024), while Walmart held steady at 22% in 2025.
- eBay’s visibility fell sharply from 27% to 19%, and Temu also declined from 19% to 15% (2025 to 2024).

Maitrayee Dey has a background in Electrical Engineering and has worked in various technical roles before transitioning to writing. Specializing in technology and Artificial Intelligence, she has served as an Academic Research Analyst and Freelance Writer, particularly focusing on education and healthcare in Australia. Maitrayee's lifelong passions for writing and painting led her to pursue a full-time writing career. She is also the creator of a cooking YouTube channel, where she shares her culinary adventures. At Smartphone Thoughts, Maitrayee brings her expertise in technology to provide in-depth smartphone reviews and app-related statistics, making complex topics easy to understand for all readers.


