Mobile Advertising Statistics By Market, Revenue, Spending, Country, Facts and Insights (2026)
Updated · Jan 10, 2026


Table of Contents
- Introduction
- Editor’s Choice
- General Statistics
- Mobile Advertising Market Statistics
- Mobile Advertising Revenue Statistics By Geography
- Social Media Mobile Ad Statistics
- Mobile Advertising Spending Statistics
- United States Mobile Advertising Spending Statistics
- Mobile Marketing Statistics
- Advantages of Mobile Advertising
- Conclusion
Introduction
Mobile Advertising Statistics: Mobile advertising is playing a crucial role in digital marketing. In recent years, billions of people have used their phones throughout the day and spent a significant amount of time in various apps. This constant mobile use creates frequent opportunities for brands to reach audiences directly on their screens. In many countries, mobile accounts for the largest share of online ad spend. Marketers follow users into social apps, short-form video platforms, chat tools, and mobile games.
This article outlines where budgets are allocated, including search, social, display, and in-app video, as well as how well campaigns perform. They measure reach, clicks, sales, and costs, including cost per purchase. This article presents several statistical analyses across different insights that enable companies to compare results, improve small-screen creative, and plan smarter campaigns for real customers.
Editor’s Choice
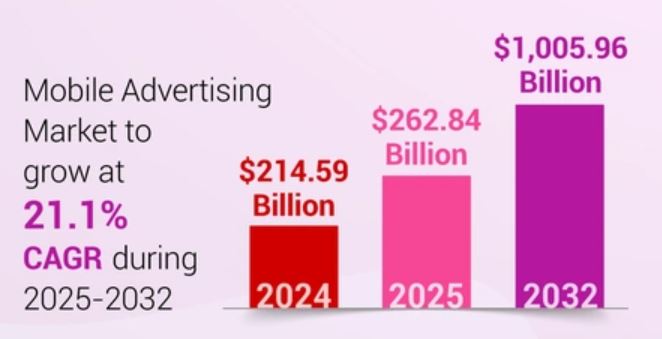
- According to Fortune Business Insights, the mobile advertising market was valued at USD 214.59 billion in 2024 and reached USD 262.84 billion in 2025.
- Meanwhile, 91% of users buy or plan to buy after seeing a relevant ad, and mobile shoppers are 40% more likely to make impulse purchases.
- Market.biz reports that the U.S. mobile ad market may add USD 83.1 billion from 2021-2025.
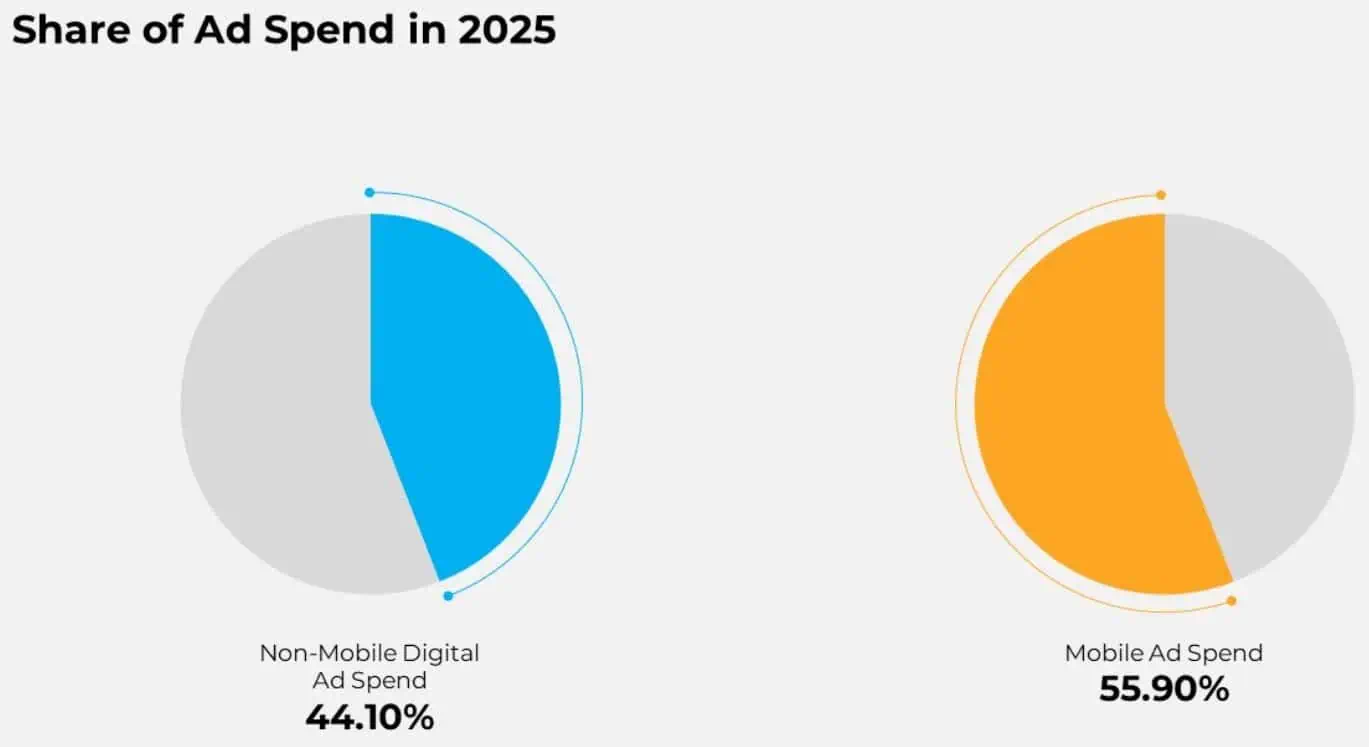
- In 2025, mobile ad spend accounts for 55.90% of total ad spend, while non-mobile digital ad spend accounts for 44.10%.
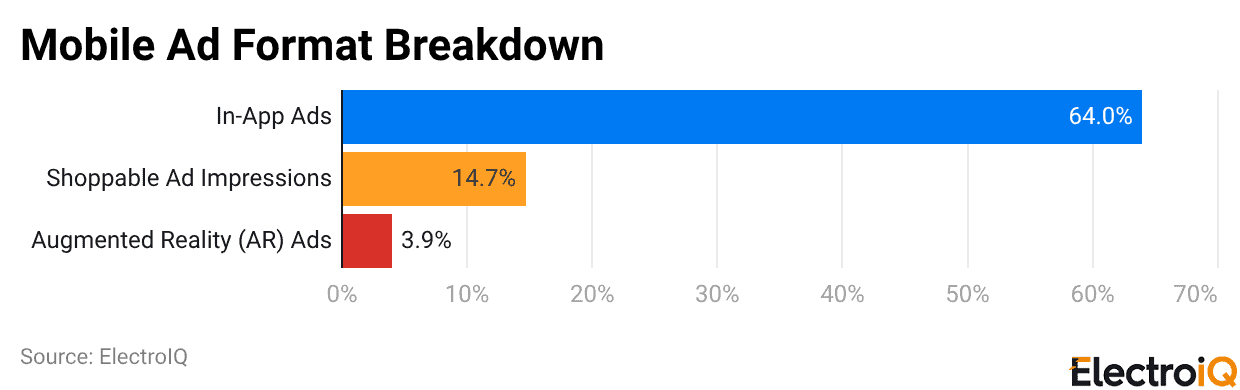
- Moreover, in-app ads account for 64% of global mobile ad spend, followed by shoppable ad impressions (14.7%) and Augmented Reality ads (3.9%).
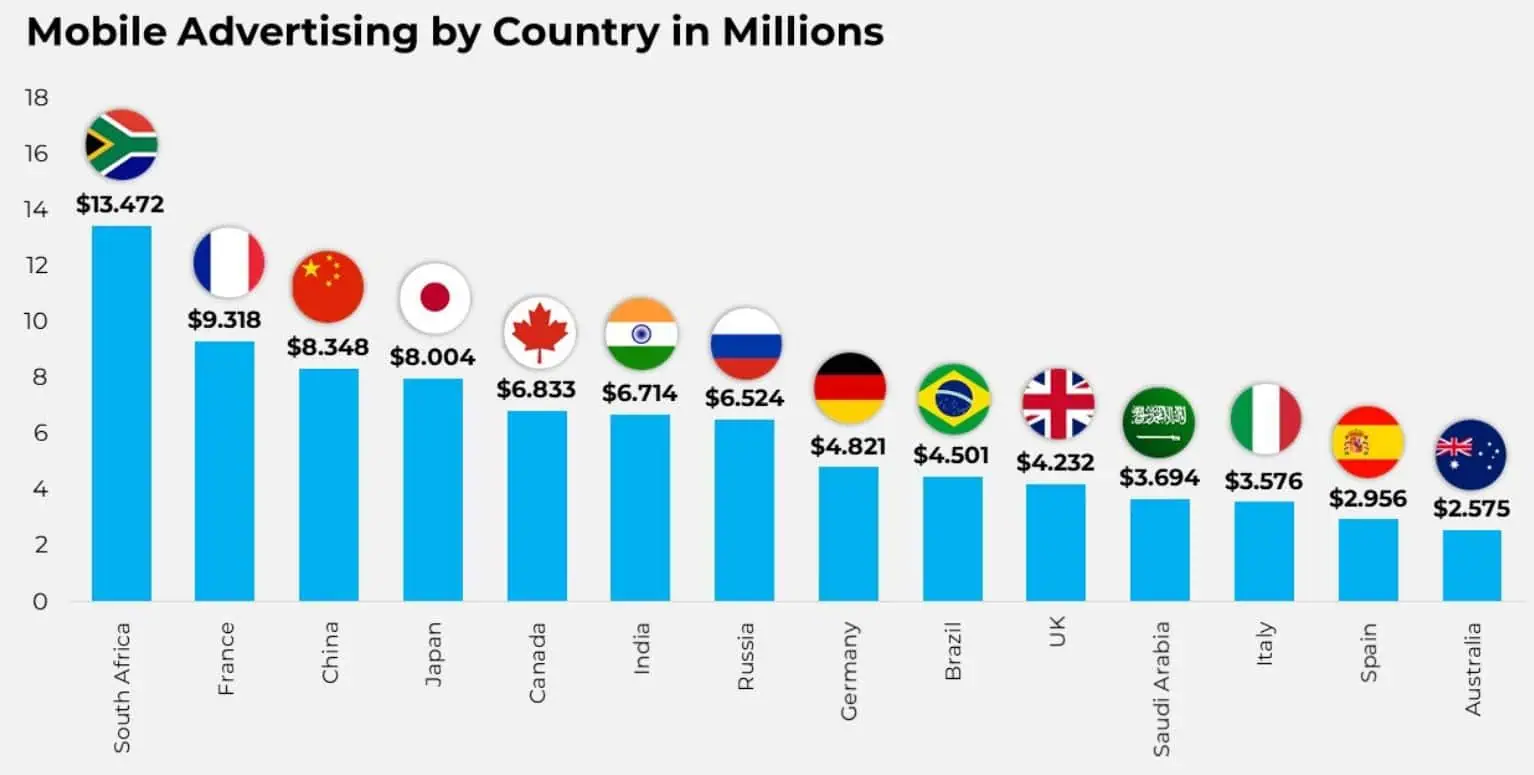
- As of 2025, South Africa accounted for the highest mobile advertising revenue, with around USD 13.472 billion, followed by France (USD 9.318 billion) and China (USD 8.348 billion).
- Global social media advertising spending reached USD 276.7 billion in 2025 and is projected to increase by 83% by 2030, according to sqmagazine.co.uk.
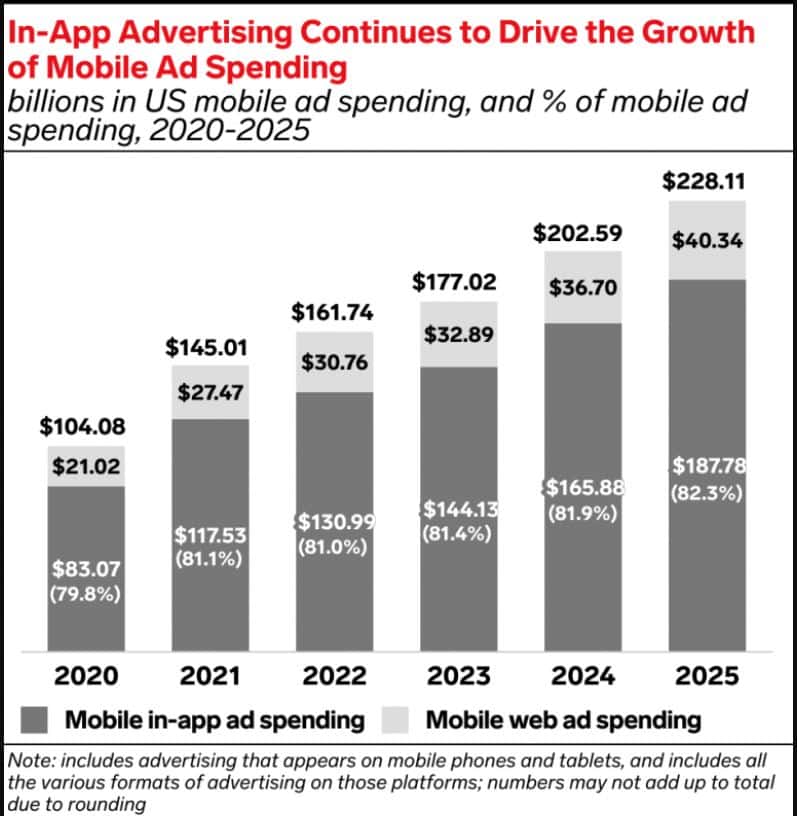
- As of 2025, total mobile ad spending in the United States was USD 228.11 billion, with in-app ads accounting for USD 187.78 billion (82.3% share).
- Retail accounts for the largest share of the mobile ad market, at 23.8%.
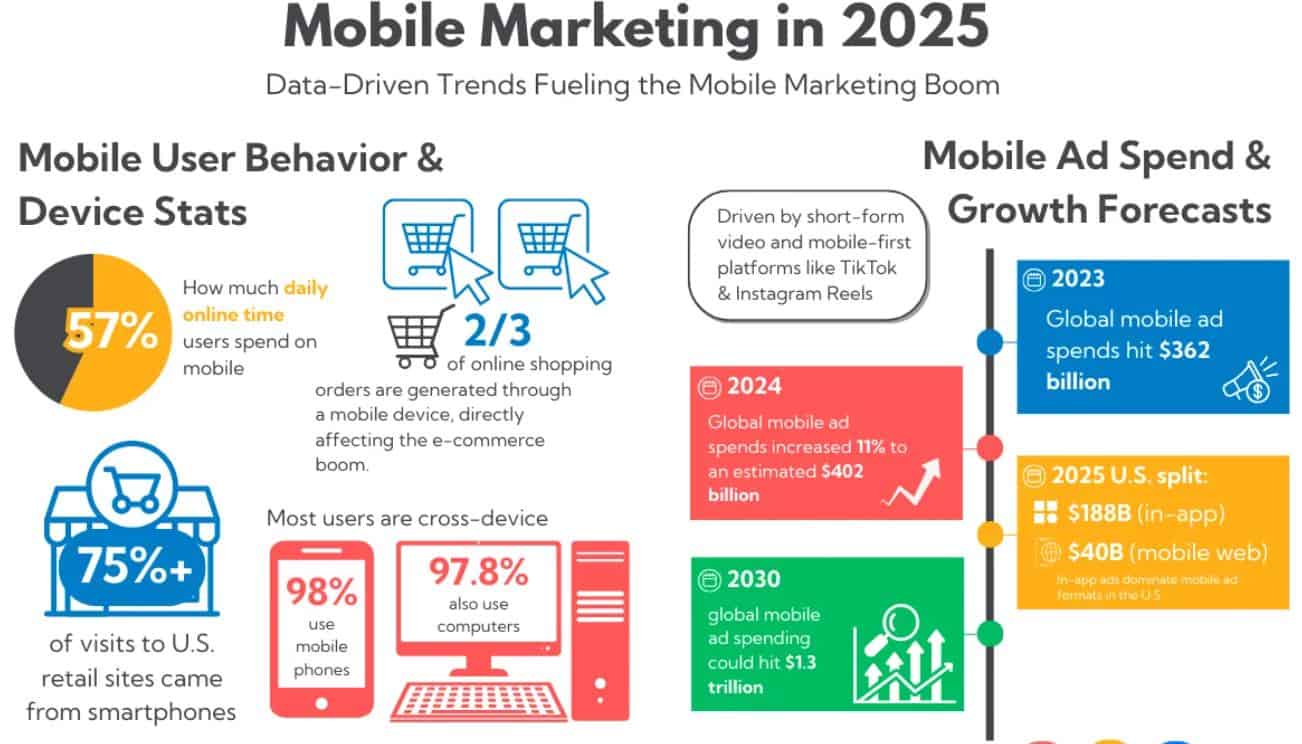
- Mobile now takes 57% of people’s daily online time.
- Globally, the mobile advertising spend will reach USD 1.3 trillion by 2030.
General Statistics
- As of 2025, Mobile ad spending reached approximately USD 228.11 billion, accounting for 75% of all digital ad spending.
- In-app ads already surpassed USD 352.20 billion in 2024 and will reach USD 533.90 billion by 2029.
- Social platforms are also adopting mobile advertisements, which are expected to account for USD 255.8 billion in social media ad revenue by 2028.
- Shopping follows the same pattern: mobile accounts for more than 55% of online sales, and 65% of purchases occur on mobile devices.
- Meanwhile, 91% of users buy or plan to buy after seeing a relevant ad, and mobile shoppers are 40% more likely to make impulse purchases.
- Besides, 76% of those who search “near me” visit within a day and often spend more.
- More than 530 million people block ads, so brands should use native, less disruptive formats.
- 63% of traffic was accounted for by Mobile video, while 69% prefer personalisation, followed by 61% (mobile-friendly sites).
Mobile Advertising Market Statistics
(Source: amazonaws.com)
- According to Fortune Business Insights, the mobile advertising market was valued at USD 214.59 billion in 2024 and reached USD 262.84 billion in 2025.
- By 2032, the market will reach approximately USD 1,005.96 billion.
- This growth equals a strong 21.1% CAGR from 2025 to 2032.
- Meanwhile, the U.S. alone may reach USD 142.68 billion by 2032.
- Market.biz reports that the U.S. mobile ad market may add USD 83.1 billion from 2021-2025.
- This represents a 57.3% increase, with an average annual growth rate of 12%.
(Source: market.biz)
- In 2025, mobile ad spend accounts for 55.90% of total ad spend, while non-mobile digital ad spend accounts for 44.10%.
- Daily smartphone use ranges from 1h 54m to 5h 20m by country.
- Approximately 38% of marketing videos are produced using mobile apps.
- Mobile also has the highest bounce rate at 52.11%, exceeding that of desktop and tablet.
- South Africa’s mobile ad revenue is about USD 13.472 billion.
- On e-commerce sites, mobile advertisements accounted for 75% of traffic and 63% of sales.
(Reference: sqmagazine.co.uk)
- In 2025, in-app ads account for 64% of global mobile ad spend.
- Followed by shoppable ad impressions (14.7%) and Augmented Reality ads (3.9%).
Mobile Advertising Revenue Statistics By Geography
(Source: market.biz)
- As of 2025, South Africa accounted for the highest mobile advertising revenue, with around USD 13.472 billion, followed by France (USD 9.318 billion) and China (USD 8.348 billion).
Furthermore, other geographical revenue in 2025 is mentioned in the table below:
| Region/Country | Revenue (USD billion) |
| North America | 76.819 |
| United States | 50.09 |
| Canada | 6.714 |
| Mexico | 20.015 |
| Europe | 57.731 |
| United Kingdom | 4.232 |
| Germany | 4.821 |
| Italy | 3.576 |
| Russia | 6.524 |
| Spain | 2.956 |
| Sweden | 1.824 |
| Denmark | 1.790 |
| Switzerland | 2.575 |
| Luxembourg | 1.230 |
| Rest of Europe | 18.888 |
| Asia Pacific | 47.815 |
| Japan | 8.004 |
| India | 6.833 |
| South Korea | 1.951 |
| Australia | 2.525 |
| Singapore | 1.984 |
| South East Asia | 0.966 |
| Taiwan | 2.013 |
| South America | 13.602 |
| Brazil | 4.501 |
| Argentina | 1.945 |
| Colombia | 1.162 |
| Peru | 0.713 |
| Chile | 0.552 |
| Rest of South America | 4.729 |
| Middle East | 14.303 |
| Saudi Arabia | 3.694 |
| Turkey | 2.2 |
| UAE | 0.872 |
| Egypt | 1 |
| Qatar | 0.299 |
| Rest of the Middle East | 6.238 |
| Africa | 49.312 |
| Nigeria | 16.613 |
| Rest of Africa | 19.227 |
Social Media Mobile Ad Statistics
- Global social media advertising spending reached USD 276.7 billion in 2025 and is projected to increase by 83% by 2030, according to sqmagazine.co.uk.
- As of July 2025, there are approximately 5.41 billion social media users globally (65.7% of the global population).
- Meanwhile, people spend approximately 2 hours and 24 minutes per day on social media apps.
- In the U.S., roughly 72.5% of the population (about 246 million people) are active users.
- Short videos drive product discovery: 78% prefer learning about new products through short-form video.
- For internet users aged 16-34, social ads are a major source of brand awareness.
- From 2025 to 2030, advertising spend is expected to grow by approximately 9.37% each year.
Mobile Advertising Spending Statistics
- Market.biz reports that global spending on mobile ads reached USD 402 billion in 2024, up 11% from the previous year.
- During the same period, the U.S. spent USD 216 billion on mobile advertising, while China spent approximately USD 150 billion.
- By 2028, mobile is expected to account for 70% of total advertising budgets.
- Also, paid mobile ads on YouTube can be 84% more effective than traditional TV advertising.
By Channel
(Source: keywordseverywhere.com)
- As of 2025, total mobile ad spending in the United States was USD 228.11 billion, with in-app ads accounting for USD 187.78 billion (82.3% share).
- Mobile web ads are expected to account for the remaining USD 40.34 billion.
Previous years’ spending analyses are mentioned in the table below:
| Year | Total US Mobile Ad Spending (USD billion) |
Mobile In-App Ad Spending (USD billion) |
In-App Share of Mobile Ad Spending Share | Mobile Web Ad Spending (USD billion) |
| 2024 | 202.59 | 165.88 | 81.9% | 36.70 |
| 2023 | 177.02 | 144.13 | 81.4% | 32.89 |
| 2022 | 161.74 | 130.99 | 81.0% | 30.76 |
| 2021 | 145.01 | 117.53 | 81.1% | 27.47 |
| 2020 | 104.08 | 83.07 | 79.8% | 21.02 |
United States Mobile Advertising Spending Statistics
| Year | Ads Spending (USD billion) |
Change Rate | Total Share of Digital Ads Spending |
| 2025 | 228.11 | +12.6% | 66.4% |
| 2024 | 202.59 | +14.4% | 66.0% |
| 2023 | 177.02 | +9.4% | 65.5% |
| 2022 | 161.74 | +11.5% | 65.6% |
| 2021 | 145.01 | – | 65.7% |
By Format
- A report published by Oberlo.com in the U.S. finds that search ads account for the largest share of mobile ad spending at USD 81.5 billion.
- Followed by video ads (USD 58.92 billion) and banner ads (USD 50.96 billion).
- Influencer ads make up a smaller share, totalling USD 4.85 billion.
By Industry
- In 2025, retail accounts for the largest share of the mobile ad market, at 23.8%.
- Consumer packaged goods account for 16.8%, while financial services follow at 13.3%.
- Other mobile ad market shares include computing products & consumer electronics (9.5%), telecom (8%), automotive (7.2%), entertainment (6.6%), health care & pharma (5.4%), media (4.7%), travel (1.6%), and other (3.1%).
Mobile Marketing Statistics
(Source: sqmagazine.co.uk)
- Mobile now takes 57% of people’s daily online time.
- Most online shopping now occurs on mobile phones, with 2 out of 3 orders placed via mobile devices.
- Also, more than 75% of visits to U.S. retail websites come from smartphones.
- Meanwhile, 98% access the internet via mobile devices, and 97.8% also use computers.
- Global mobile advertising spending totalled USD 362 billion in 2023 and rose 11% to approximately USD 402 billion in 2024.
- As of 2025, the United States generated USD 188 billion in in-app ad revenue, compared with USD 40 billion from mobile web ads.
- Globally, the mobile advertising spend will reach USD 1.3 trillion by 2030.
Advantages of Mobile Advertising
- Mobile ads can save money because they reach the right people and often cost less to create.
- They use data to improve targeting, so ads feel more relevant and work better.
- Since phones are always nearby, brands can connect with customers instantly and in real time.
- New technology continues to introduce novel advertising styles, and interactive formats encourage user engagement.
- Advertisers can also target by live location and personalise messages based on interests and behaviour, giving mobile unmatched reach and strong engagement.
Conclusion
After finishing the Mobile Advertising Statistics article, it is clear that mobile is no longer optional, as it’s where people spend time, shop, and stream. More money is moving into mobile-first ads like short videos, social feeds, in-app spots, and commerce-linked placements. The mobile advertisement offers greater relevance, faster load times, and stronger creatives than a large reach approach.
Privacy updates and weaker tracking are also changing targeting and reporting, so brands are relying more on first-party data, contextual ads, and better measurement methods such as incrementality tests and media mix modelling.
Sources
FAQ.
Banner/display ads, video ads, social media ads, in-app ads, search ads, native ads, and message-based ads like SMS/WhatsApp.
In-app ads run within mobile applications, whereas mobile web ads appear on websites accessed via a phone’s browser.
It blends into the app or site design, like a sponsored post in a feed, making it feel more natural.
Ads can be targeted based on location, device, interests, user actions, page/app context, and first-party data.
It’s data you collect directly (visits, purchases, sign-ups). It’s more valuable now that privacy regulations limit third-party tracking.
They reduce cross-app tracking, making measurement more difficult; as a result, marketers rely on contextual targeting and stronger testing methods.

Maitrayee Dey has a background in Electrical Engineering and has worked in various technical roles before transitioning to writing. Specializing in technology and Artificial Intelligence, she has served as an Academic Research Analyst and Freelance Writer, particularly focusing on education and healthcare in Australia. Maitrayee's lifelong passions for writing and painting led her to pursue a full-time writing career. She is also the creator of a cooking YouTube channel, where she shares her culinary adventures. At Smartphone Thoughts, Maitrayee brings her expertise in technology to provide in-depth smartphone reviews and app-related statistics, making complex topics easy to understand for all readers.