Network as a Service Statistics By Region, Types, Market Size and Facts (2025)
Updated · Sep 22, 2025


Table of Contents
- Introduction
- Editor’s Choice
- Network as a Service Market Size
- Factors Driving the Demand for Network as a Service (NaaS)
- US Network as a Service Market
- By Type
- Market Share By Region
- By Enterprise Size
- By Region
- Key Players of Network as a Service Market
- Networking-Related Outages Statistics
- Recent Developments
- Conclusion
Introduction
Network as a Service Statistics: Network as a Service (NaaS) has quickly become one of the most talked-about models in the technology world. Instead of companies investing heavily in physical networking hardware, NaaS allows them to access networking resources through a flexible, subscription-based model. Organisations are now able to cut costs, grow more quickly, and handle networks more easily. As more companies rely on cloud services, edge computing, and remote connections, the Network-as-a-Service (NaaS) market is growing quickly.
This article includes the latest statistics from different insights that give a clear picture of how this industry is developing, what factors are driving its growth, and where it is headed in the coming years.
Editor’s Choice
- According to Market.us, the global Network as a Service (NaaS) market was valued at USD 14.6 billion in 2023.
- It is expected to grow strongly in the coming years.
- By 2032, the market is projected to reach about USD 115.7 billion.
- The market will expand at a CAGR of 26.7% between 2023 and 2032.
- In 2024, North America took the lead in the network-as-a-service industry, accounting for 42% of the global share.
- Among the different service types, WAN-based solutions made up 53% of the total share in the same period.
- Meanwhile, LAN-based offerings are predicted to rise strongly, with a growth rate of 18.7% CAGR from 2025 to 2034.
- Based on enterprise size, larger organizations contributed more than 56% of the market in 2024.
- When considering end users, corporate clients represented over 59%.
- A recent survey of more than 900 IT professionals revealed that 90% intend to move to Network-as-a-Service (NaaS) within three years.
- Around 30% prefer managing services themselves, 27% want quicker provisioning, 18% face high bandwidth costs, and 49% seek stronger network security.
- Configuration and change management failures are the top cause of network problems, reported by 49% of respondents, as mentioned in scoop.market.us.
Network as a Service Market Size
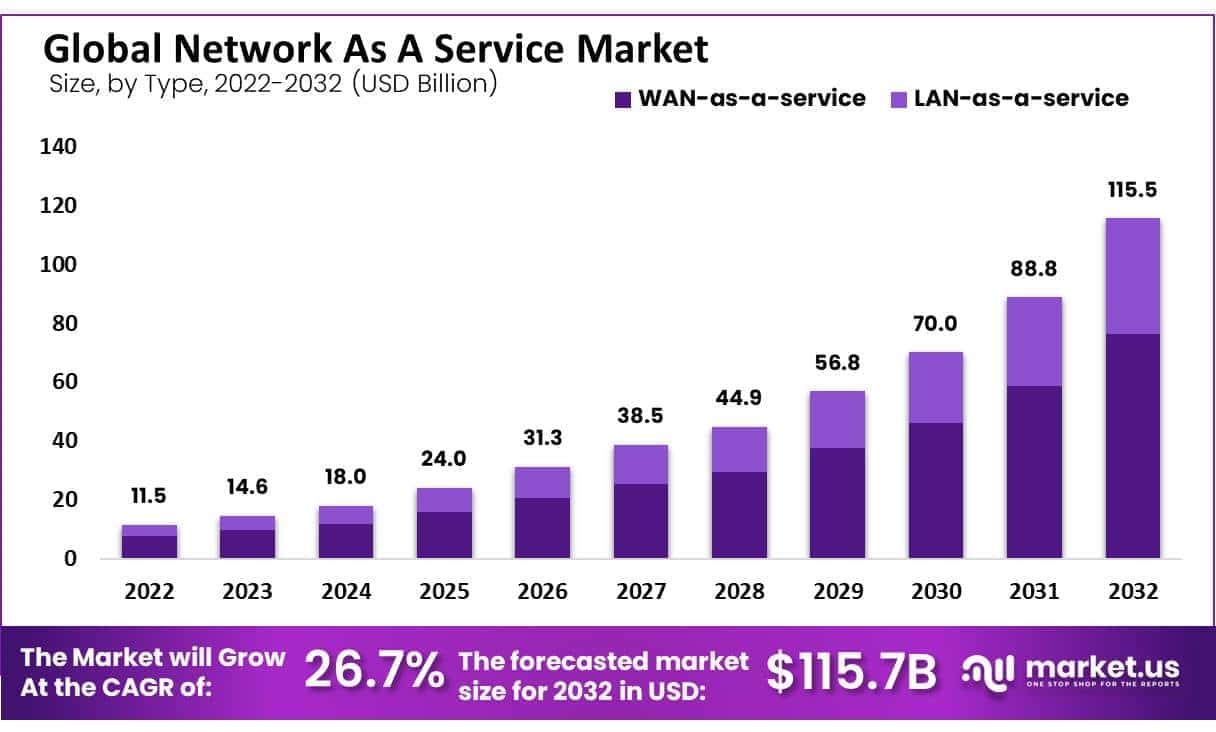
- The Global Network as a Service (NaaS) Market is projected to grow from USD 14.6 billion in 2023 to around USD 115.7 billion by 2032, with a strong CAGR of 26.7% during 2023–2032.
- A survey by Aruba with 2,400 IT decision-makers found that 38% plan to increase investments in cloud-based networking, while 35% will focus on AI-driven networking. These investments are being driven by the impact of COVID-19 and the demand for agile, automated infrastructures for hybrid work models.
- The adoption of NaaS is expected to grow by 38% in the next two years as businesses adjust strategies to deal with challenges from the pandemic.
- By Type, the WAN-as-a-Service (WANaaS) segment led the market in 2022 with a 66% share and is expected to grow at a CAGR of 33.6%.
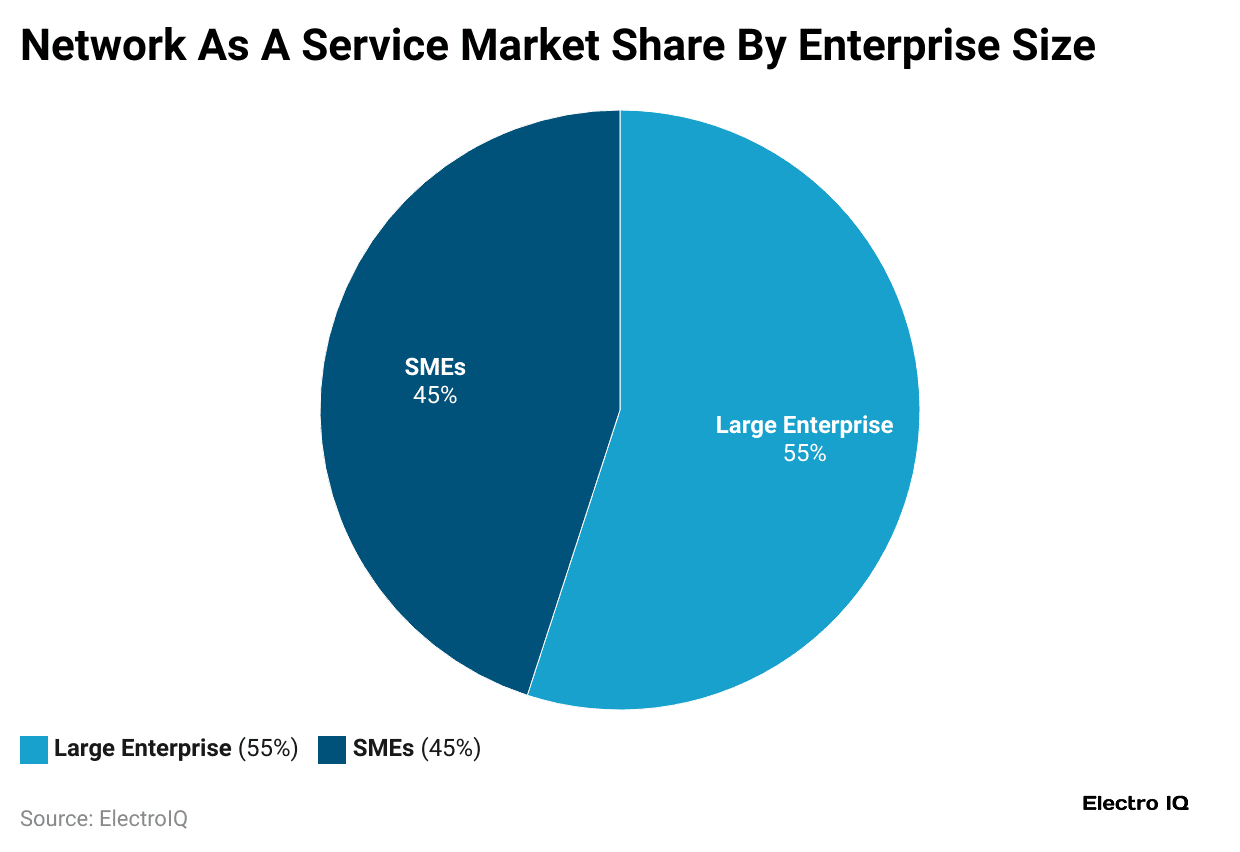
- By Enterprise Size, the Large Enterprise segment held the leading position in 2022 with a 55% share, showing its importance for complex networking needs.
- By Application, Cloud and SaaS Connectivity was the leading segment in 2022, accounting for 24% of the share.
- By Industry Vertical, the IT and Telecom sector led the market in 2022 with more than 24% share.
- Regionally, Asia Pacific is expected to be the fastest-growing market, with a projected CAGR of 34.1% during the forecast period.
Factors Driving the Demand for Network as a Service (NaaS)
- Networking failures top the list of NaaS adoption drivers, cited by 29% of respondents.
- Power outages follow with 25%, while 24% adopt NaaS proactively, noting no IT service interruptions in recent years.
- Third-party service issues, including cloud and SaaS, account for 16%.
- The remaining 7% of responses highlight various other smaller contributing factors shaping demand.
Other drivers impacting the market are mentioned in the table below:
| Drivers | CAGR (2025 to 2030) |
| Companies are moving to cloud-first network plans |
6.2% |
|
Switching from CapEx to OpEx |
5.8% |
| Combining SD-WAN with SASE |
4.9% |
|
Adopting AI for network assurance |
4.1% |
| Using Campus-LAN NaaS for Wi-Fi 7 |
3.7% |
|
Offering private 5G slicing |
3.6% |
US Network as a Service Market
 (Reference: Precedence Research)
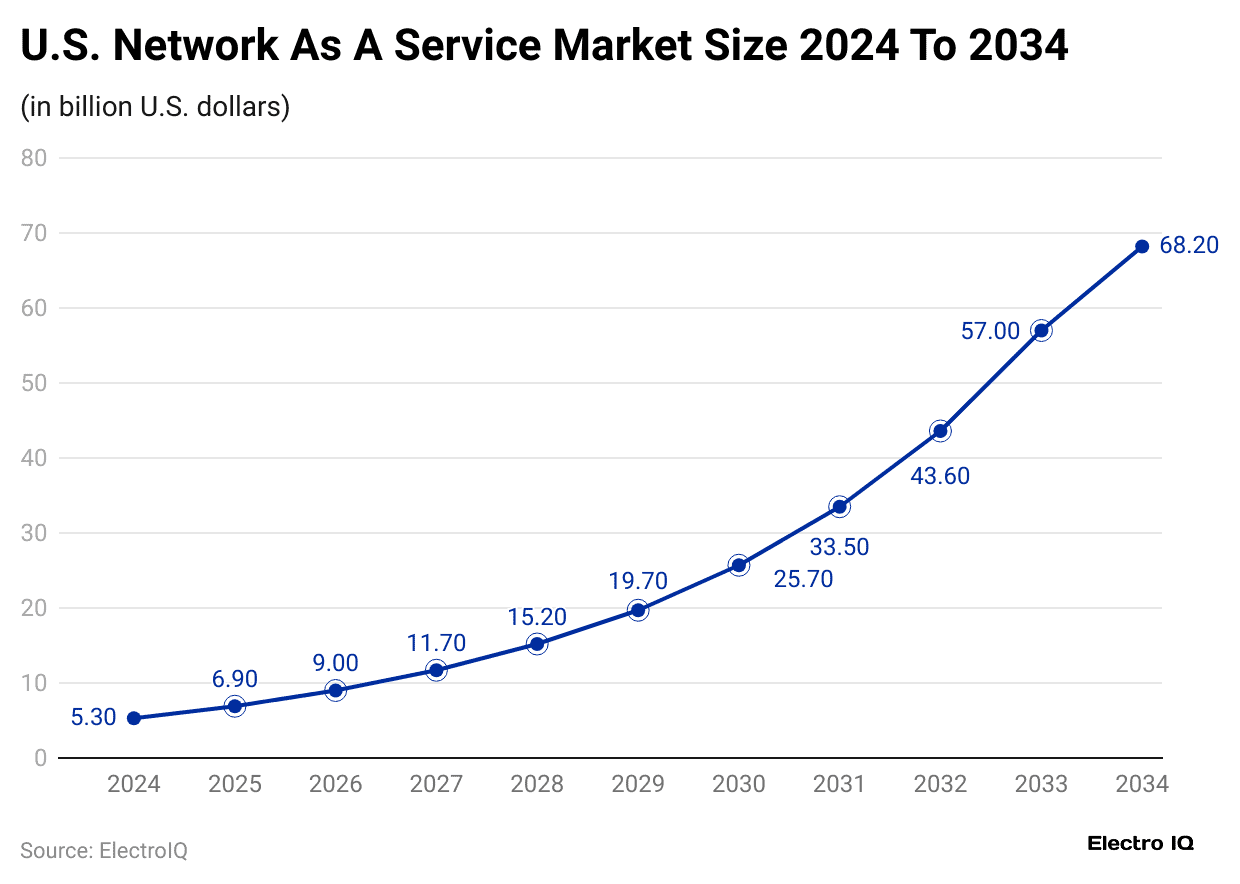
- By 2025, the U.S. network-as-a-service market will be worth around USD 6.90 billion.
- It is forecast to rise to approximately USD 68.20 billion by 2034, with an annual growth rate of 29.11% from 2025 to 2034.
- Furthermore, the market size in the coming years is expected to be USD 9 billion in 2026, USD 11.70 billion in 2027, USD 15.20 billion in 2028, USD 19.70 billion in 2029, USD 25.70 billion in 2030, USD 33.50 billion in 2031, USD 43.60 billion in 2032, and USD 57 billion in 2033.
By Type
- In 2025, the Network as a Service (NaaS) market will see WAN-as-a-Service leading with a revenue of USD 15.8 billion, while LAN-as-a-Service will generate USD 8.2 billion.
In the coming years, other types of network revenue analysis are estimated in the table below:
| Year | WAN-as-a-service | LAN-as-as-service |
| Revenue (USD billion) | ||
| 2026 | 20.6 | 10.6 |
| 2027 | 25.4 | 13.1 |
| 2028 | 29.6 | 15.3 |
| 2029 | 37.5 | 19.3 |
| 2030 | 46.2 | 23.8 |
| 2031 | 58.6 | 30.2 |
| 2032 | 76.6 | 39.3 |
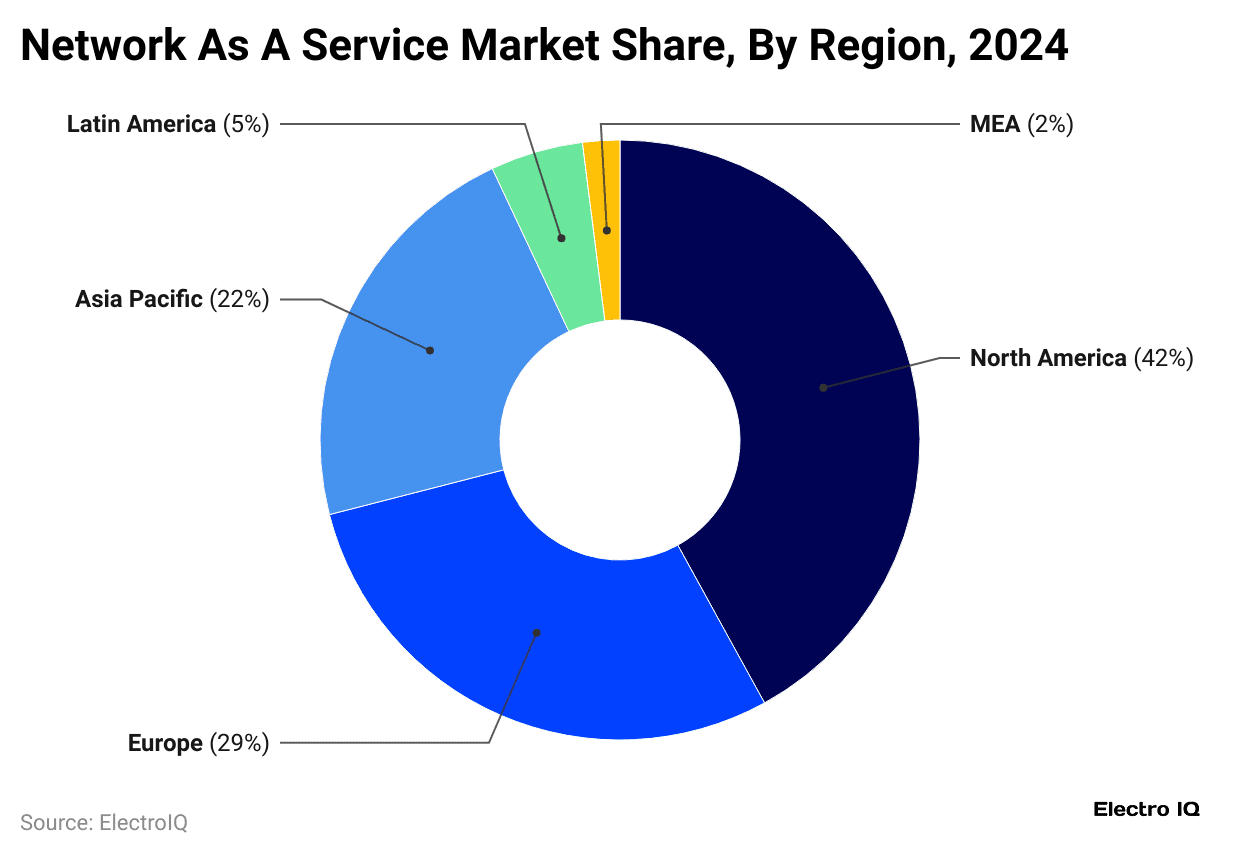
- As of 2024, North America captured 42% of the global share in the market of the Network-as-a-Service industry.
- Furthermore, other regions’ market share were Europe (29%), Asia Pacific (22%), Latin America (5%), and MEA (2%).
By Enterprise Size
 (Reference: scoop.market.us)
- As of 2024, large enterprises now hold the bigger part of the market, with a strong 55% share.
- SMEs also play an important role, making up 45%.
By Region
| Country | Estimated Market Size (USD million) | ||
| 2025 | 2033 | CAGR | |
| North America | 4954.21 | 35415.1 | 27.87% |
| Europe | 3701.3 | 27769.2 | 28.64% |
| Asia Pacific | 3538.21 | 28754.3 | 29.93% |
| South America | 736.93 | 4338.56 | 24.80% |
| Middle East | 504.43 | 3070.67 | 25.33% |
| Africa | 1555.41 | 10712.1 | 27.27% |
By Country Analysis
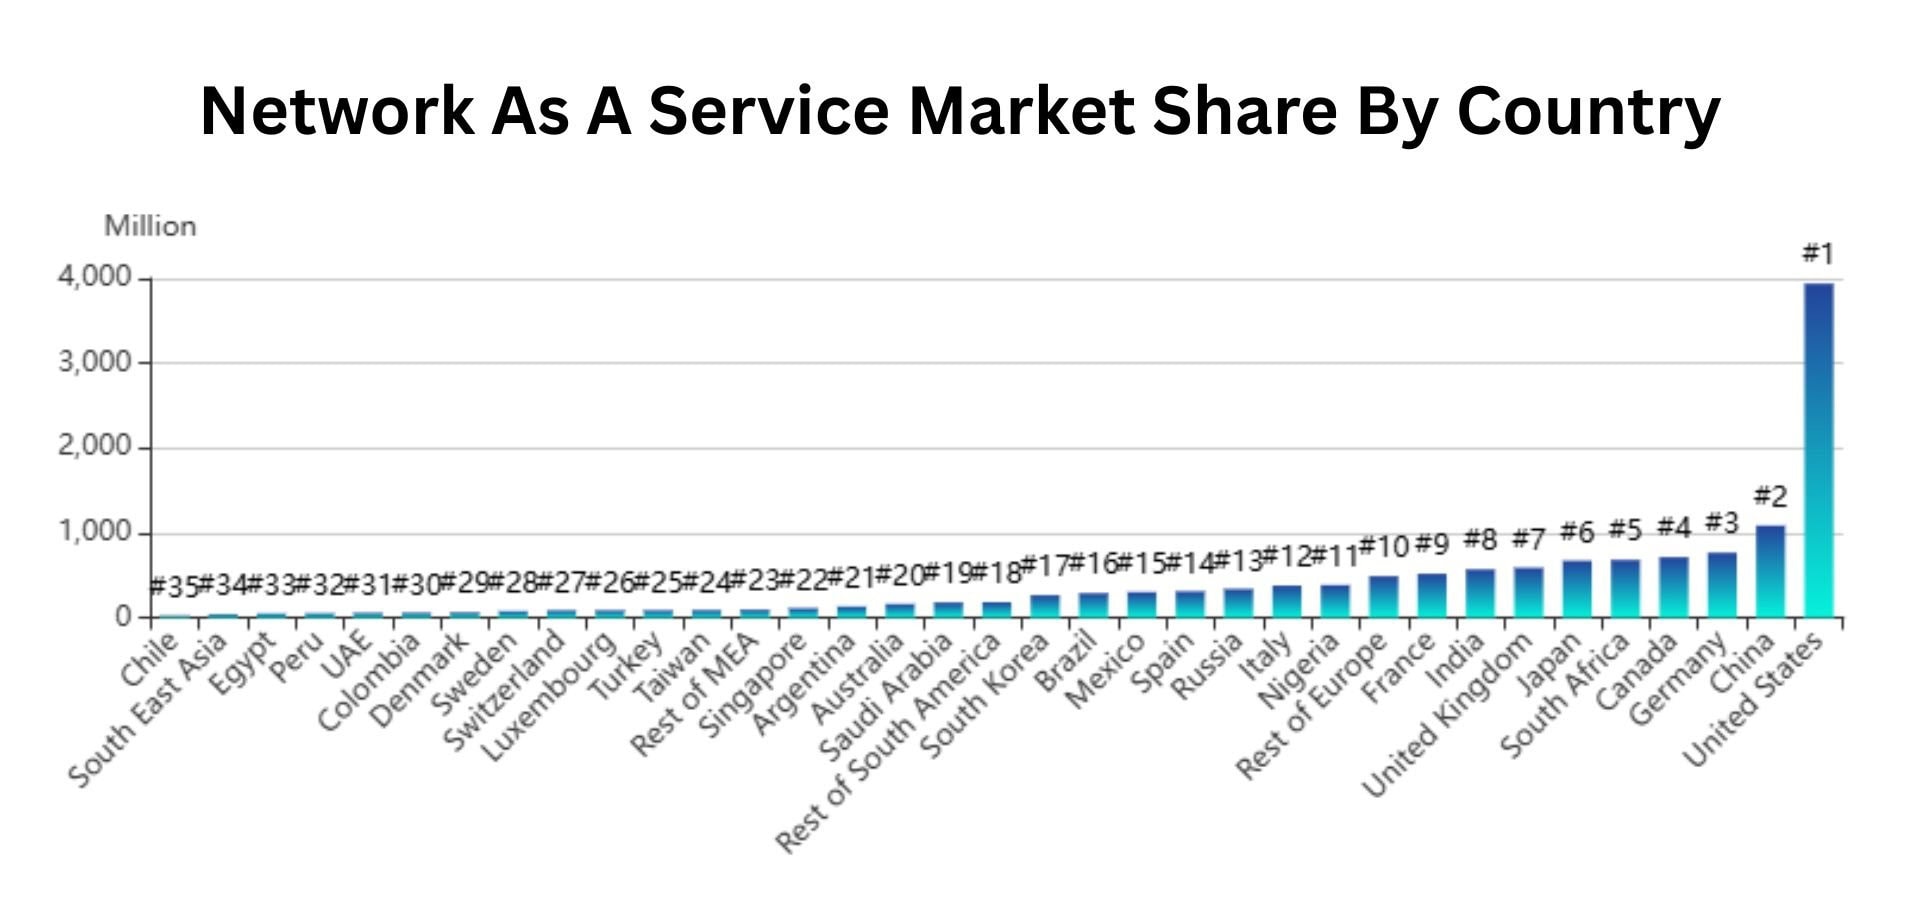 (Source: cognitivemarketresearch.com)
- According to cognitivemarketresearch.com, in the United States, the Network as a Service (NaaS) market is projected to grow from an estimated USD 3938.55 million in 2025 to USD 27977.2 million by 2033.
- The market is reflecting a growth rate of 27.77% CAGR from 2025to 2033.
| Country | Estimated Market Size (USD million) | ||
| 2025 | 2033 | CAGR | |
| Canada | 713.45 | 5242.14 | 28.31% |
| Mexico | 302.20 | 2195.74 | 28.13% |
| United Kingdom | 588.43 | 4303.12 | 28.23% |
| Germany | 766.24 | 5888.19 | 29.03% |
| France | 518.10 | 3831.04 | 28.41% |
| Italy | 378.34 | 2900.22 | 28.99% |
| Russia | 338.74 | 2555.88 | 28.73% |
| Spain | 310.98 | 2358.72 | 28.82% |
| Sweden | 76.91 | 568.15 | 28.39% |
| Denmark | 61.73 | 454.30 | 28.33% |
| Switzerland | 86.16 | 637.58 | 28.42% |
| Luxembourg | 86.31 | 650.91 | 28.73% |
| Rest of Europe | 489.31 | 3621.11 | 28.42% |
| China | 1086.34 | 9059.32 | 30.35% |
| Japan | 672.15 | 5404.08 | 29.76% |
| India | 569.75 | 4861.2 | 30.73% |
| South Korea | 265.25 | 2011.07 | 28.81% |
| Australia | 161.44 | 1333.05 | 30.19% |
| Singapore | 111.70 | 898.28 | 29.76% |
| South East Asia | 202.27 | 1608.51 | 29.58% |
| Taiwan | 89.05 | 688.37 | 29.12% |
| Brazil | 288.90 | 1714.08 | 24.92% |
| Argentina | 131.94 | 781.28 | 24.89% |
| Colombia | 58.58 | 340.38 | 24.60% |
| Peru | 51.33 | 296.84 | 24.52% |
| Chile | 23.25 | 135.45 | 24.63% |
| Rest of South America | 182.91 | 1070.52 | 24.71% |
| Saudi Arabia | 179.55 | 1083.33 | 25.19% |
| Turkey | 86.78 | 543.81 | 25.78% |
| UAE | 56.52 | 353.43 | 25.75% |
| Egypt | 48.70 | 295.39 | 25.27% |
| Qatar | 40.02 | 242.58 | 25.26% |
| Rest of the Middle East | 92.84 | 552.10 | 24.96% |
| Nigeria | 384.71 | 2641.4 | 27.22% |
| South Africa | 681.36 | 4725.34 | 27.38% |
| Rest of Africa | 489.33 | 3345.4 | 27.16% |
Key Players of Network as a Service Market
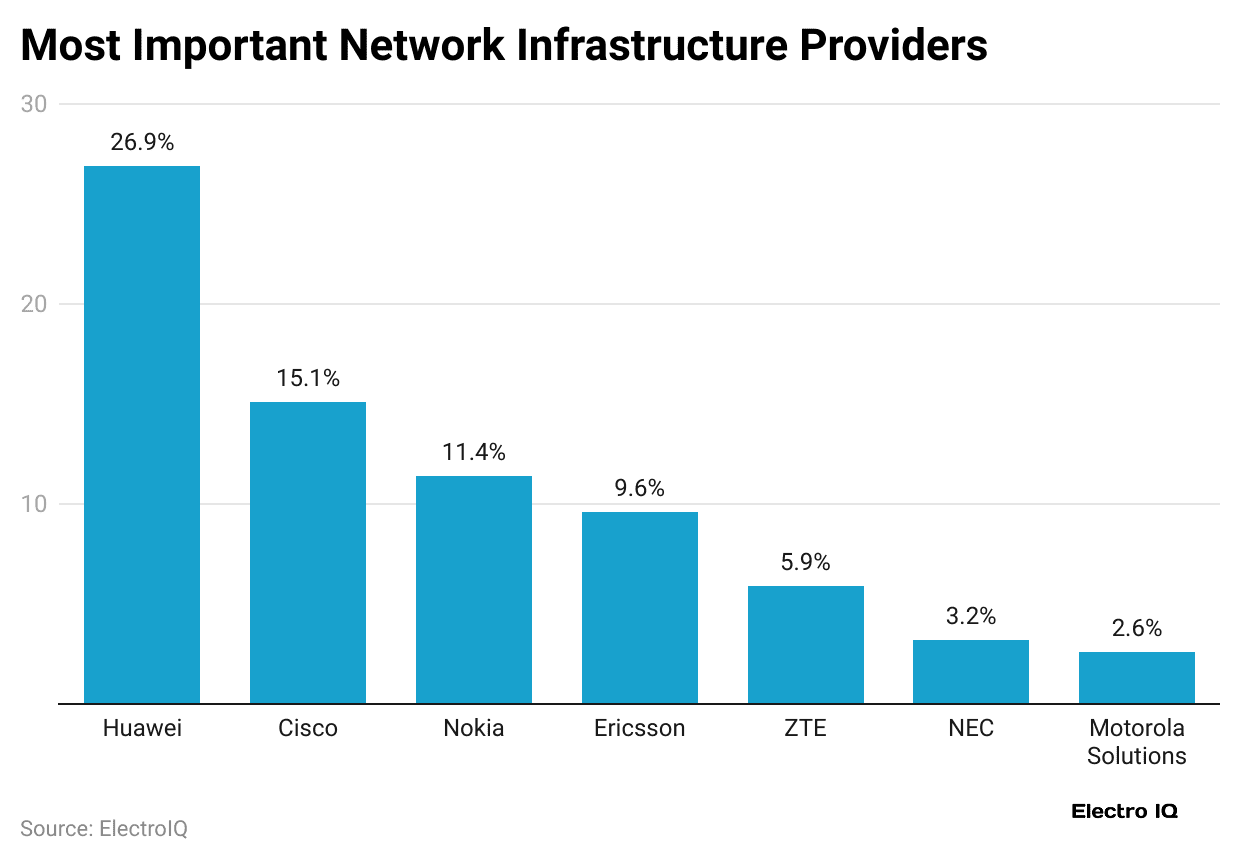
- As of 2024, Huawei accounted for the highest market share of networking, with a share of 26.9%, followed by Cisco with 15.1%.
- Meanwhile, Nokia and Ericsson held 11.4% and 9.6%,
- Providers shares followed by ZTE that accounted for 5.9%, NEC with 3.2%, and Motorola Solutions, with 2.6%.
Networking-Related Outages Statistics
- Configuration and change management failures are the top cause of network problems, reported by 49% of respondents, as mentioned in scoop.market.us.
- Failures from third-party providers come next at 39%, while firmware or software errors are noted by 31%.
- Around 26% of network issues are caused by natural disasters or line breaks, while 24% result from congestion problems.
- Routing errors or corrupted firewall rules affect 17% of cases, and cyber-attacks such as DDoS attacks impact 16%.
- Additionally, 9% of respondents reported no hardware-related failures, 7% reported uncertain cause, and 1% unspecified reasons.
Recent Developments
- In March 2024, Nokia introduced the Network Services Platform (NSP) to provide communication providers with more flexible and scalable NaaS solutions.
- In the same year (August), Cisco acquired Acacia Communications, which is termed a top provider of optical interconnect technology.
- By December, Juniper Networks had already partnered with Microsoft to bring Contrail Service Orchestration to Azure, improving customer NaaS experiences.
- As of February 2025, IBM expanded its IBM Cloud Pak for Networking.
Conclusion
The Network as a Service (NaaS) market is expanding rapidly as businesses increasingly seek networking solutions that are flexible, scalable, and cost-effective. In recent years, adoption of NaaS has been rising among both large enterprises and smaller firms aiming to streamline operations.
This service is linked up with advanced technologies such as AI-powered network assurance, private 5G slicing, and the integration of SD-WAN with SASE, making it a key driver of global digital transformation. All the above statistical analyses will guide you in understanding the topic effectively.
Sources
FAQ.
| Pros | Cons |
| ● Flexible
● Scalable ● Cost-efficient ● Enable faster deployment ● Easy management ● Supports digital transformation |
● Security compliance risks ● Dependence on service providers ● Possible connectivity issues |
NaaS is generally secure as it offers encryption, improved monitoring, and threat detection, but risks depend on the provider’s practices.
Globally, NaaS is used by large, medium-sized and small enterprises, startup businesses, and other service providers.

Maitrayee Dey has a background in Electrical Engineering and has worked in various technical roles before transitioning to writing. Specializing in technology and Artificial Intelligence, she has served as an Academic Research Analyst and Freelance Writer, particularly focusing on education and healthcare in Australia. Maitrayee's lifelong passions for writing and painting led her to pursue a full-time writing career. She is also the creator of a cooking YouTube channel, where she shares her culinary adventures. At Smartphone Thoughts, Maitrayee brings her expertise in technology to provide in-depth smartphone reviews and app-related statistics, making complex topics easy to understand for all readers.