Social Media Addiction Statistics By Gender, Region and Facts
Updated · Dec 08, 2025

Table of Contents
- Introduction
- Editor’s Choice
- Social Media Usage By Gender
- Social Media Usage By Region
- Social Media Usage By Age
- Social Media Penetration By Countries
- Users Reporting Social Media Addiction
- Most Used Social Media Platforms
- Average Number of Social Media Accounts
- Negative Effects of Social Media Posts
- Average Time Spent on Social Media
- Teens Who Are Constantly Online
- Social Media Addiction By Gender
- Mobile Users Share Daily Internet Time
- Internet Time of Smartphone Users By Gender
- Web Traffic Shared By The Device
- Media Medium For News
- Social Media as a News Source By Country
- Social Media Platforms Used For News
- Conclusion
Introduction
Social Media Addiction: Social media has become integral to modern life, fundamentally changing how we communicate, consume information, and spend time online. By learning about Social Media Addiction Statistics, we can get a compelling picture of its growing influence and impact across different demographics and regions.
The data reveals significant insights into how social media is reshaping our digital landscape, from addiction patterns to usage behaviors. Likewise, it will help us understand the increasing role of social media as a news source and its varying impact across different age groups and geographical regions, providing valuable insights into the changing dynamics in the digital age.
Editor’s Choice
- TikTok users spend an average of 12 hours and 11 minutes on the platform, making it the most time-consuming social media app.
- In 2023, 46% of teens report being “almost constantly” online, significantly increasing from 24% in 2014-15.
- Female users show higher addiction rates, with 45% being either somewhat or completely addicted to social media, compared to 33% of males.
- The UAE leads global social media penetration at 115%, indicating multiple account ownership per user.
- Mobile devices account for 59.72% of all internet traffic, showcasing mobile social media usage dominance.
- Facebook is the most popular platform, with 3,049 million users globally.
- Social media accounts per person have nearly doubled from 4.3 in 2013 to 8.5 in 2018.
- 70% of users with low social-emotional well-being report feeling excluded when using social media.
- South Asia has the highest male social media usage, at 73%, while North America leads females, at 54%.
- 82% of users rely on online channels for news consumption, showing equal usage between males and females.
- Pinterest shows the strongest gender divide, with 78% female and 22% male users.
- The share of daily internet time spent on mobile devices increased from 52% in Q2 2020 to 55.5% in Q1 2022.
- Among young users (18-29), 84% are active social media users, the highest among all age groups.
- Facebook leads as a news source, with 37% of users getting their news through the platform.
- Kenya shows the highest social media usage for news at 82% of its social media users.
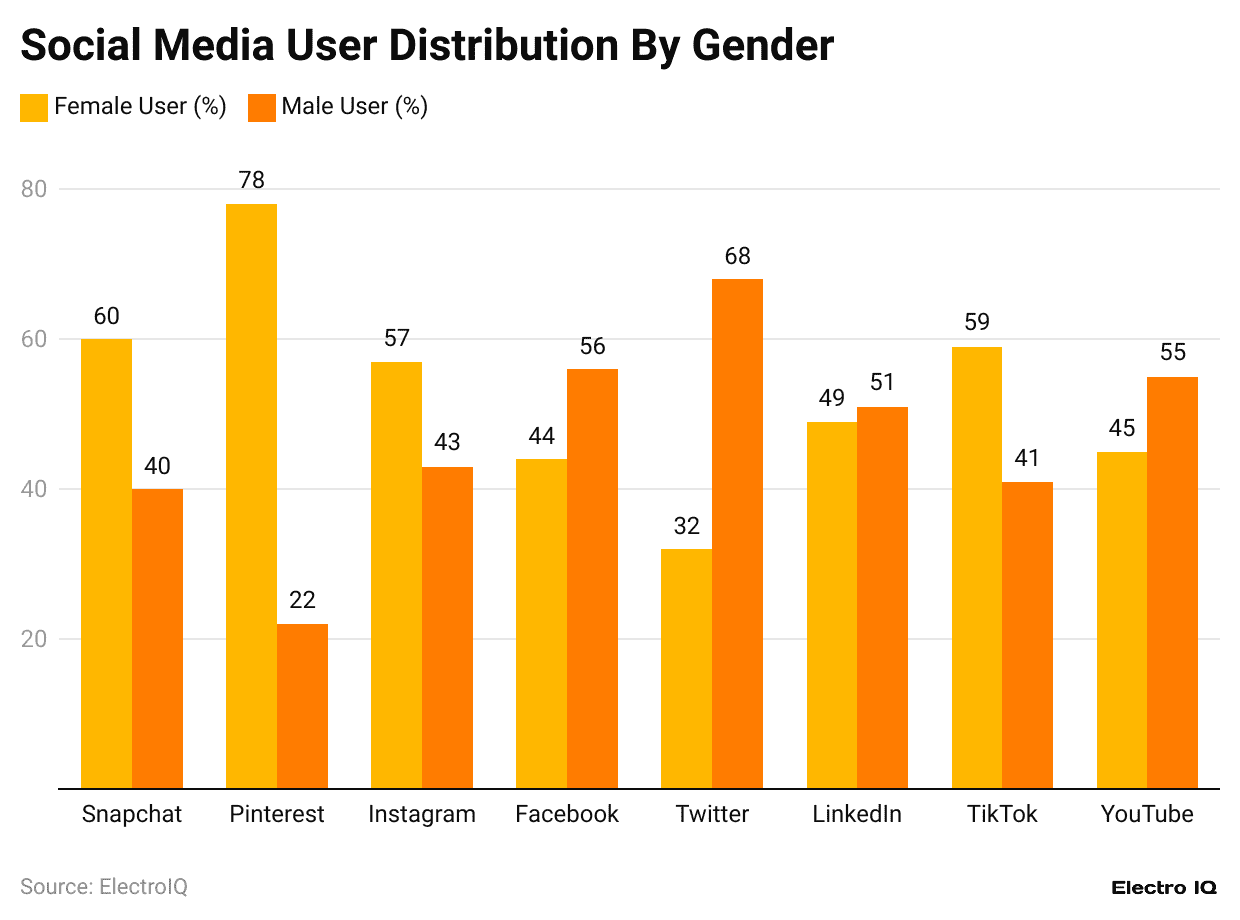
Social Media Usage By Gender
(Reference: searchlogistics.com)
- Social Media Addiction Statistics show that Pinterest is the most popular social media platform among female users, with 78% of the audience using it.
- Twitter is the most popular social media platform among males, as 68% of respondents use it.
- Twitter is the least popular social media platform among females and is used by only 32%.
- Pinterest is the least popular social media platform for males, with only 22% of male users.
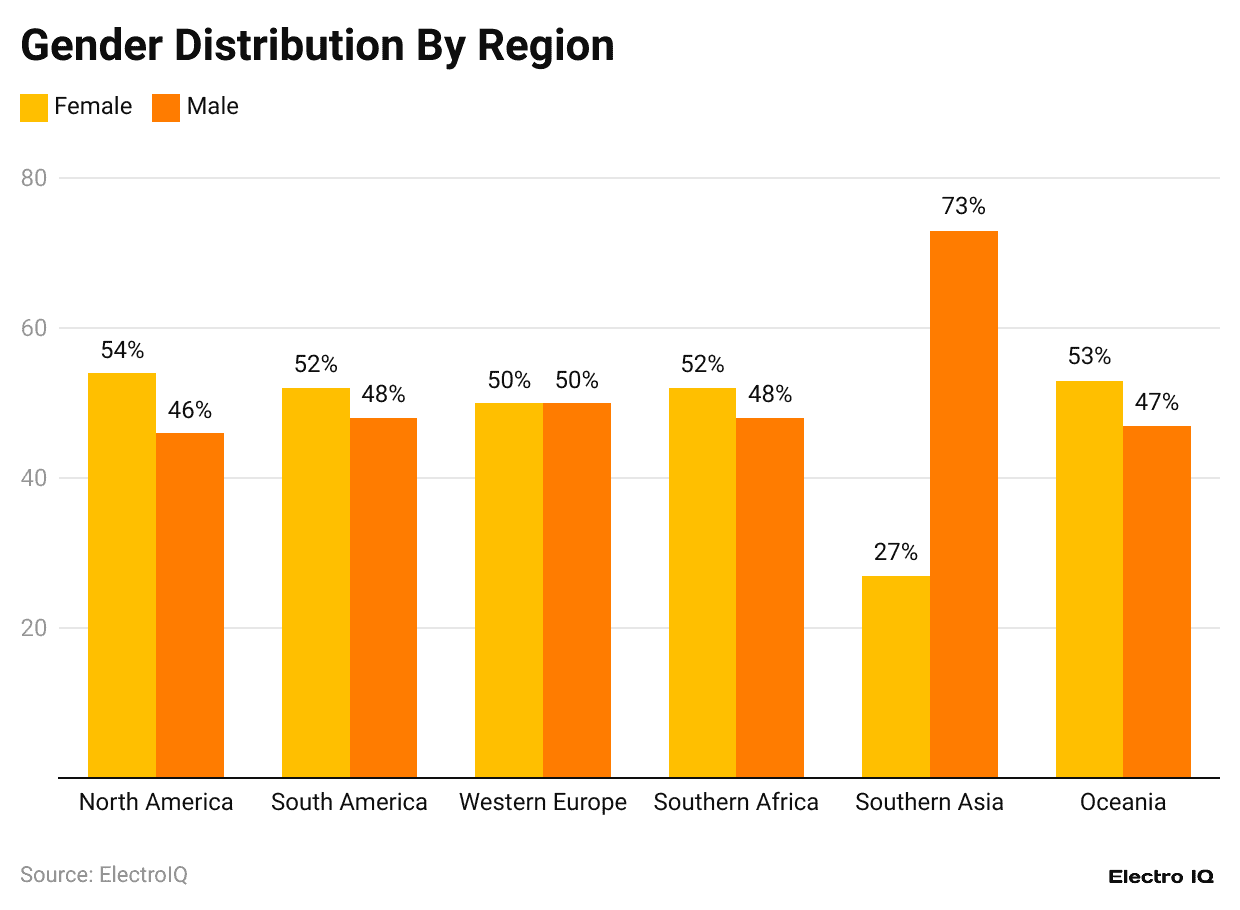
Social Media Usage By Region
(Reference: searchlogistics.com)
- Social Media Addiction Statistics show that South Asia has the highest proportion of the male population using social media as per 73% of respondents.
- Among female audiences, North America has the highest proportion of social media users as per 54% of respondents.
- South Asia has the lowest proportion of females using social media, with 27% of respondents.
- North America comprises the lowest proportion of social media users, with 46% of respondents.
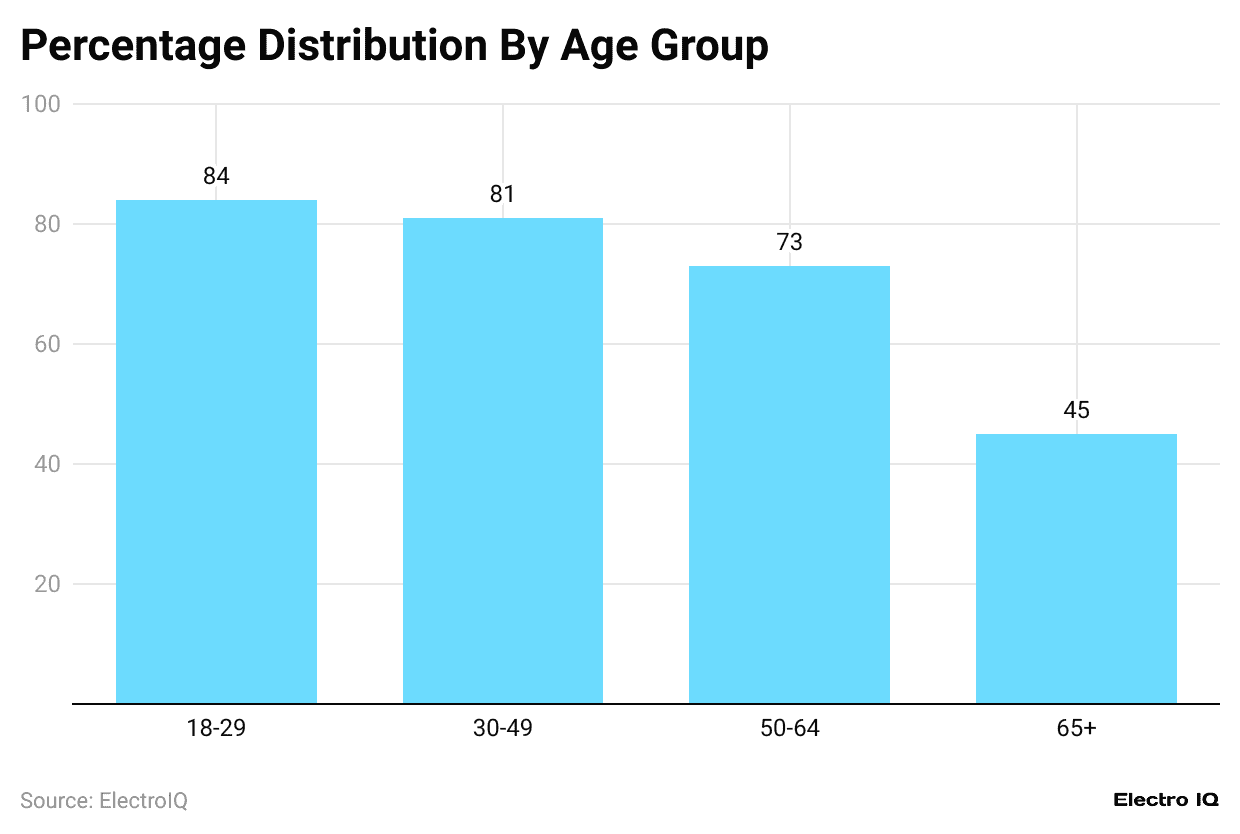
Social Media Usage By Age
(Reference: searchlogistics.com)
- Social Media Addiction Statistics show that adults aged 18-29 have the highest usage of social media as per 84% of respondents.
- Adults aged 30-49 have the second-highest usage, with 81% of respondents.
- Adults aged 50-64 have the third-highest usage, with 73% of respondents.
- Adults aged 65+ have the lowest usage, with 45% of respondents.
Social Media Penetration By Countries
(Reference: statista.com)
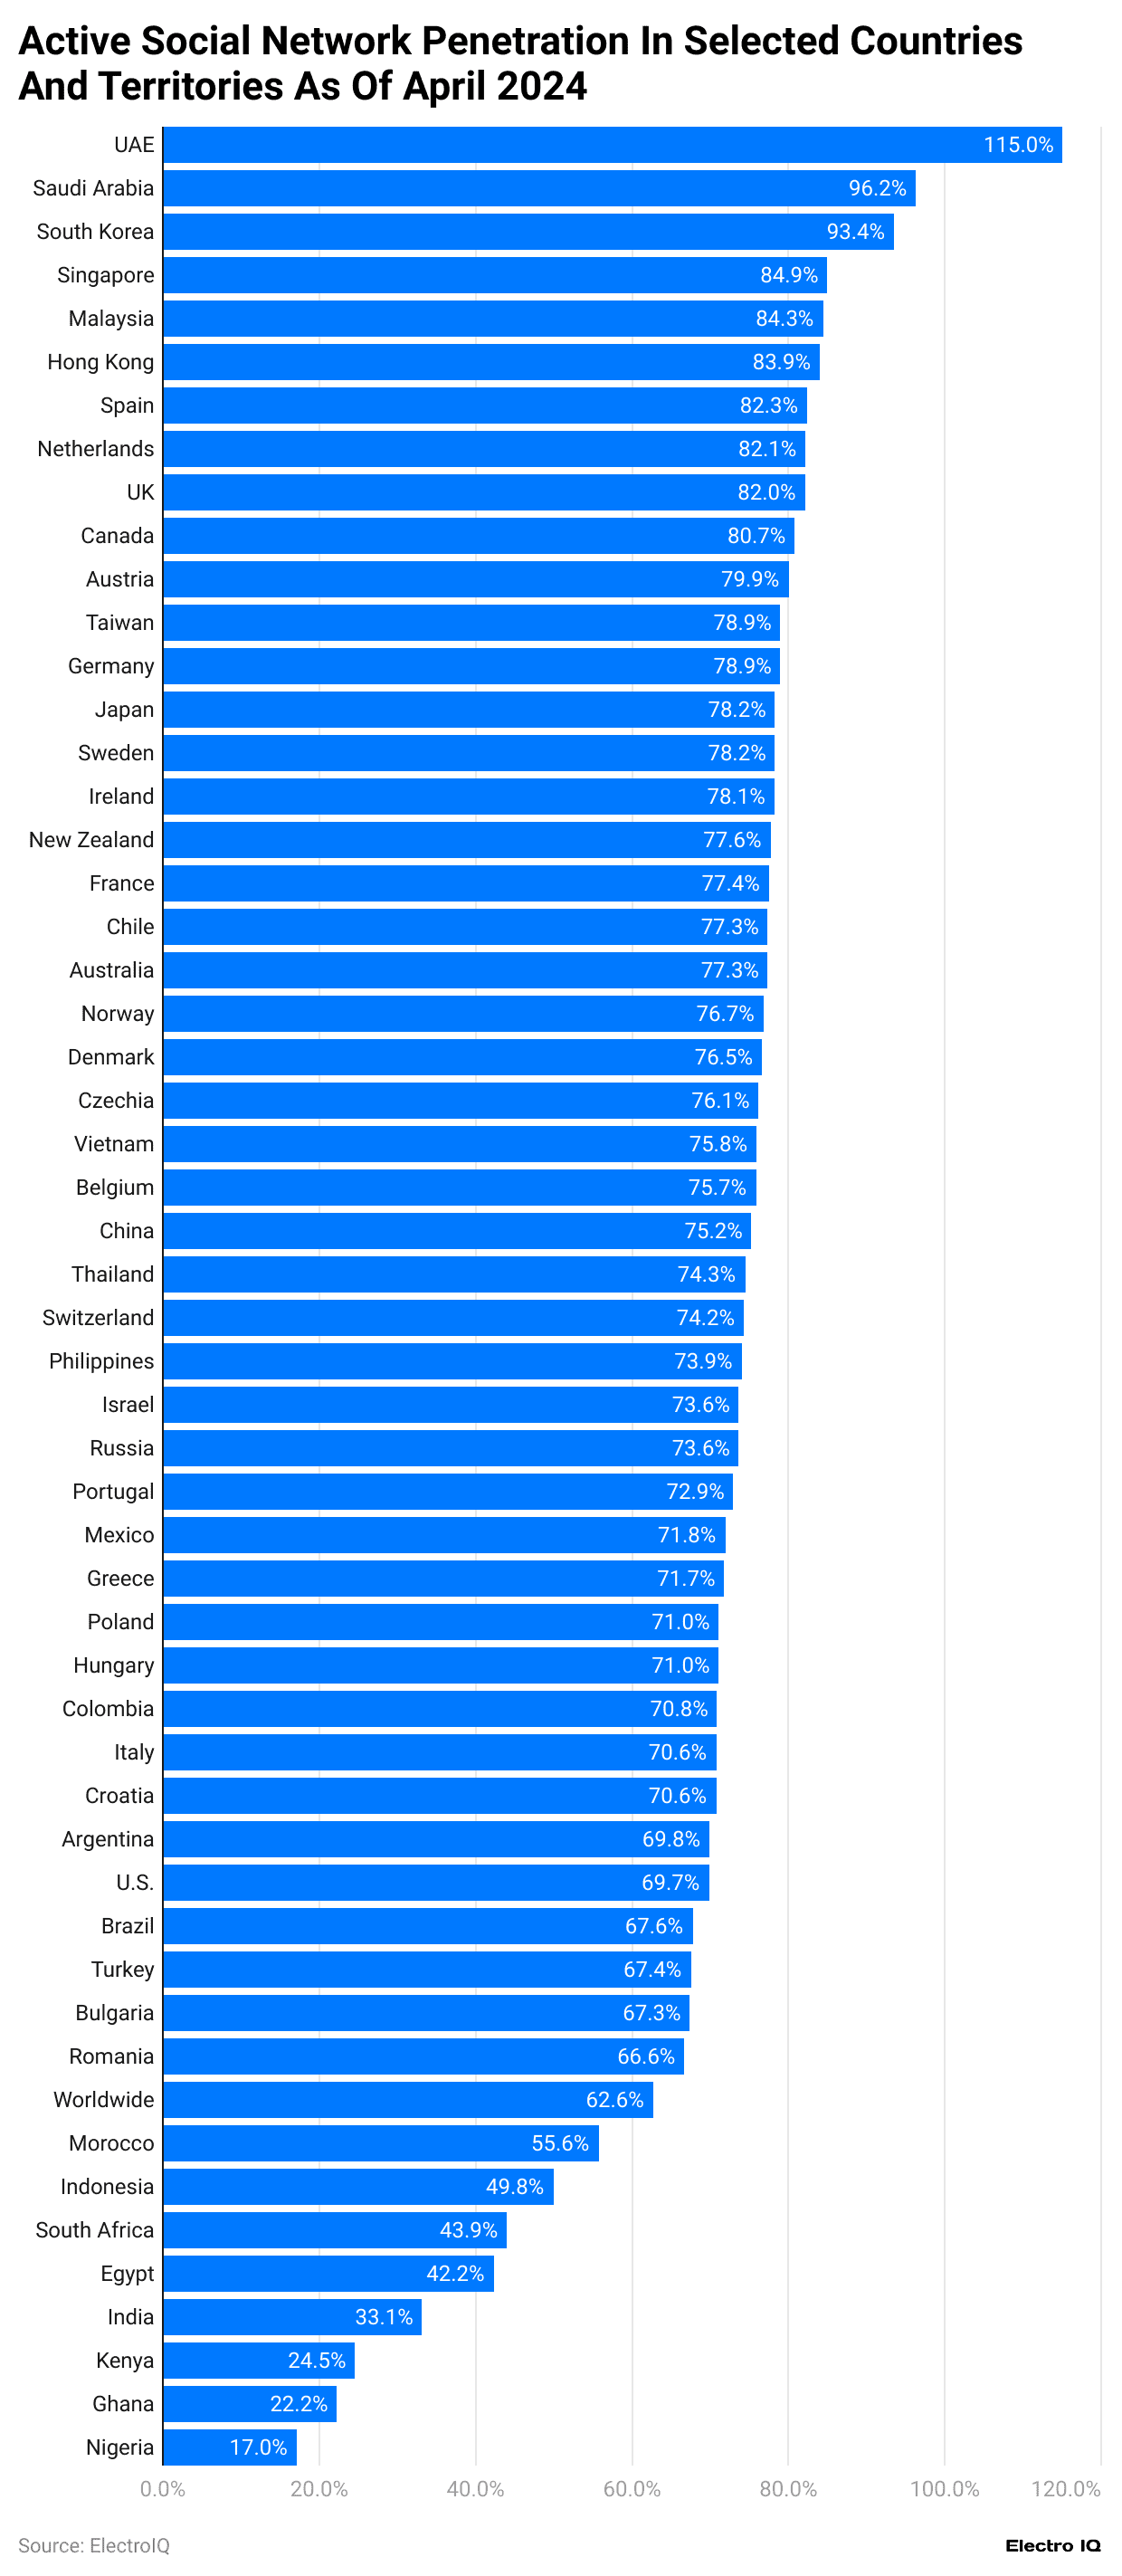
- Social Media Addiction Statistics show that the UAE has the highest penetration, with 115%.
- Saudi Arabia has 2nd highest social media penetration, with 96.2%.
- South Korea has the third-highest social media penetration, with 93.4%.
- Singapore has the fourth-highest social media penetration, with 84.9%.
- Malaysia has the fifth-highest social media penetration, with 84.3%.
Users Reporting Social Media Addiction
(Reference: statista.com)
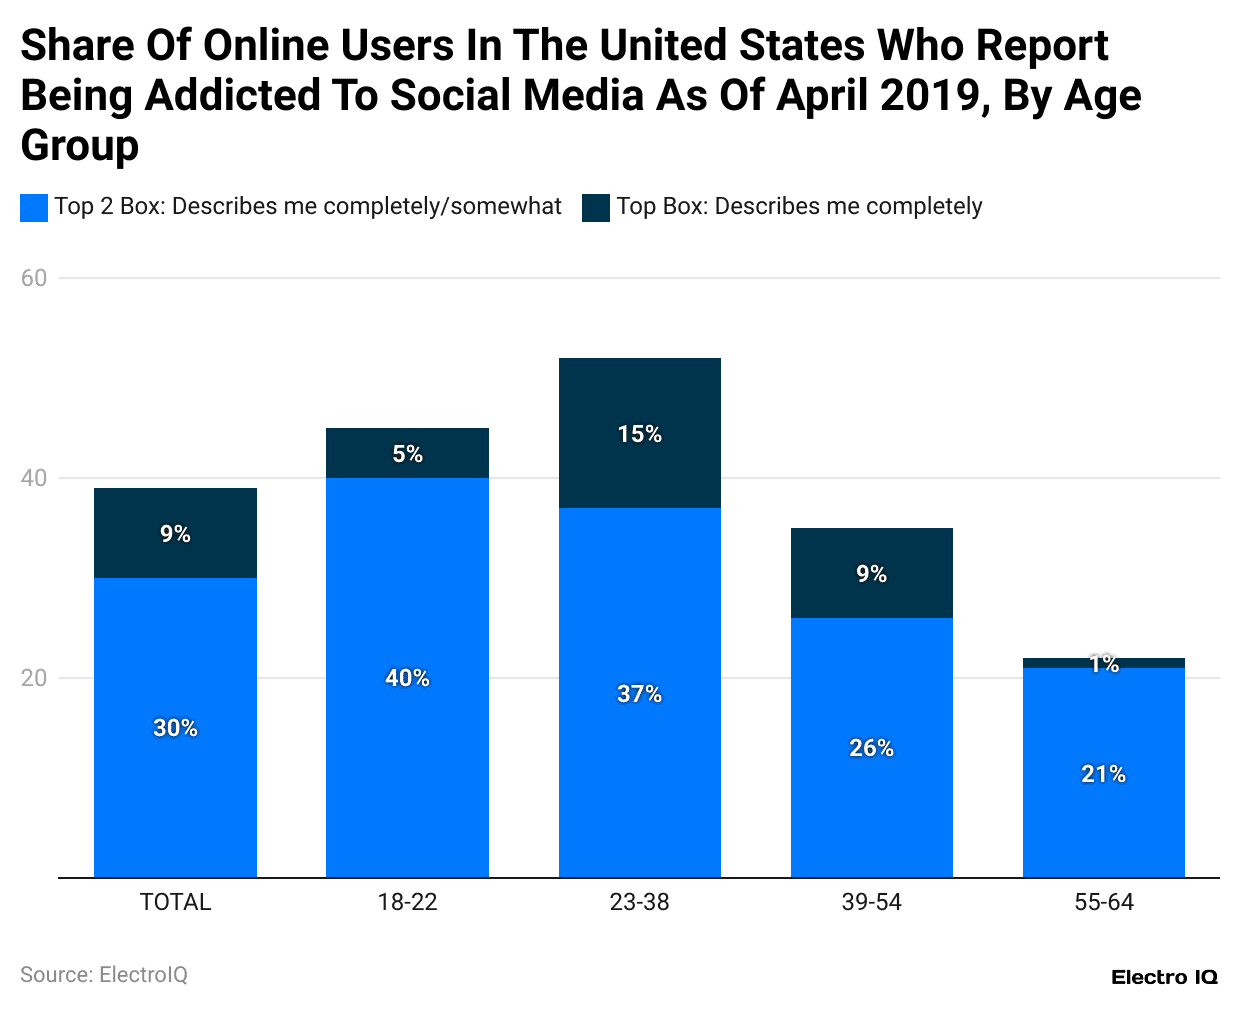
- Social Media Addiction Statistics show that among all users, 30% of respondents have reported somewhat being addicted to social media. In comparison, 9% of respondents have reported being addicted to social media.
- Among social media users aged 23 – 38, 37% of users reported that they are somewhat addicted to social media, and 15% of respondents are addicted to social media.
- Among users aged 18-22, 5% of respondents identified themselves as addicted to social media, while 40% reported being somewhat addicted.
- Among users aged 39-54, 9% of respondents identified themselves as addicted to social media, while 26% reported being somewhat addicted.
- Among users aged 55-64, 1% of respondents identified themselves as addicted to social media, while 21% reported being somewhat addicted.
Most Used Social Media Platforms
(Reference: searchlogistics.com)
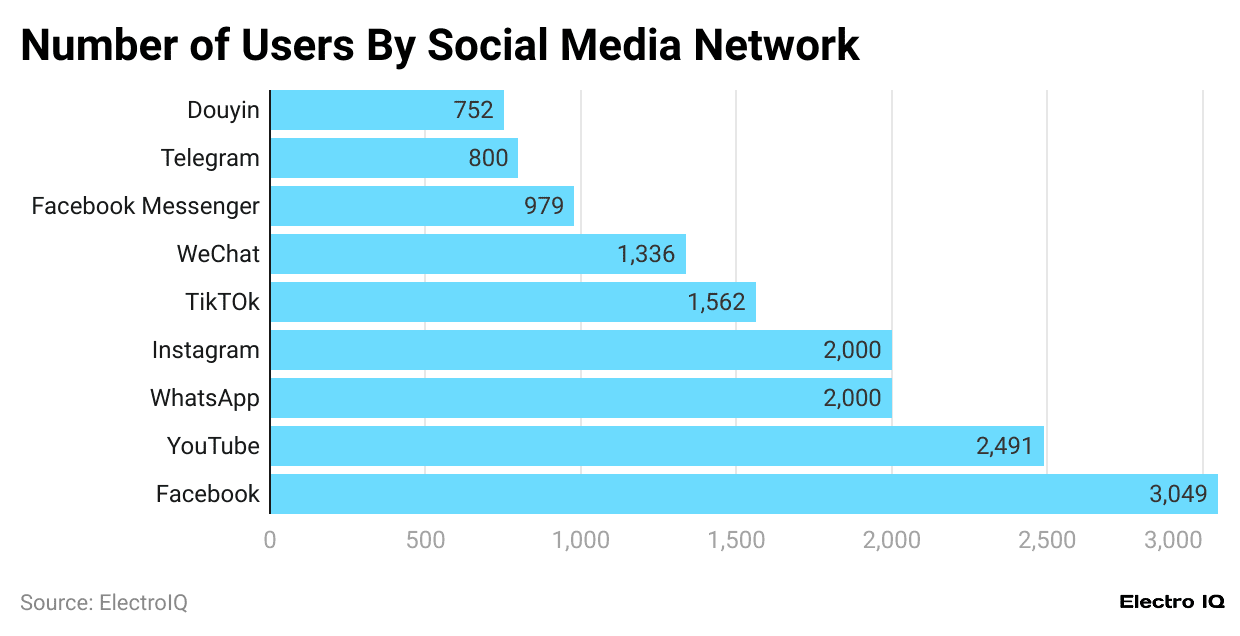
- Social Media Addiction Statistics show that Facebook has the highest number of social media users, with 3049 million.
- YouTube has 2nd highest number of social media users, with 2491 million.
- WhatsApp and Instagram share the third-highest social media users, each with 2000 million.
- TikTok has the fourth-highest number of social media users, with 1562 million.
- WeChat has the fifth-highest number of social media users, with 1336 million.
Average Number of Social Media Accounts
(Reference: searchlogistics.com)
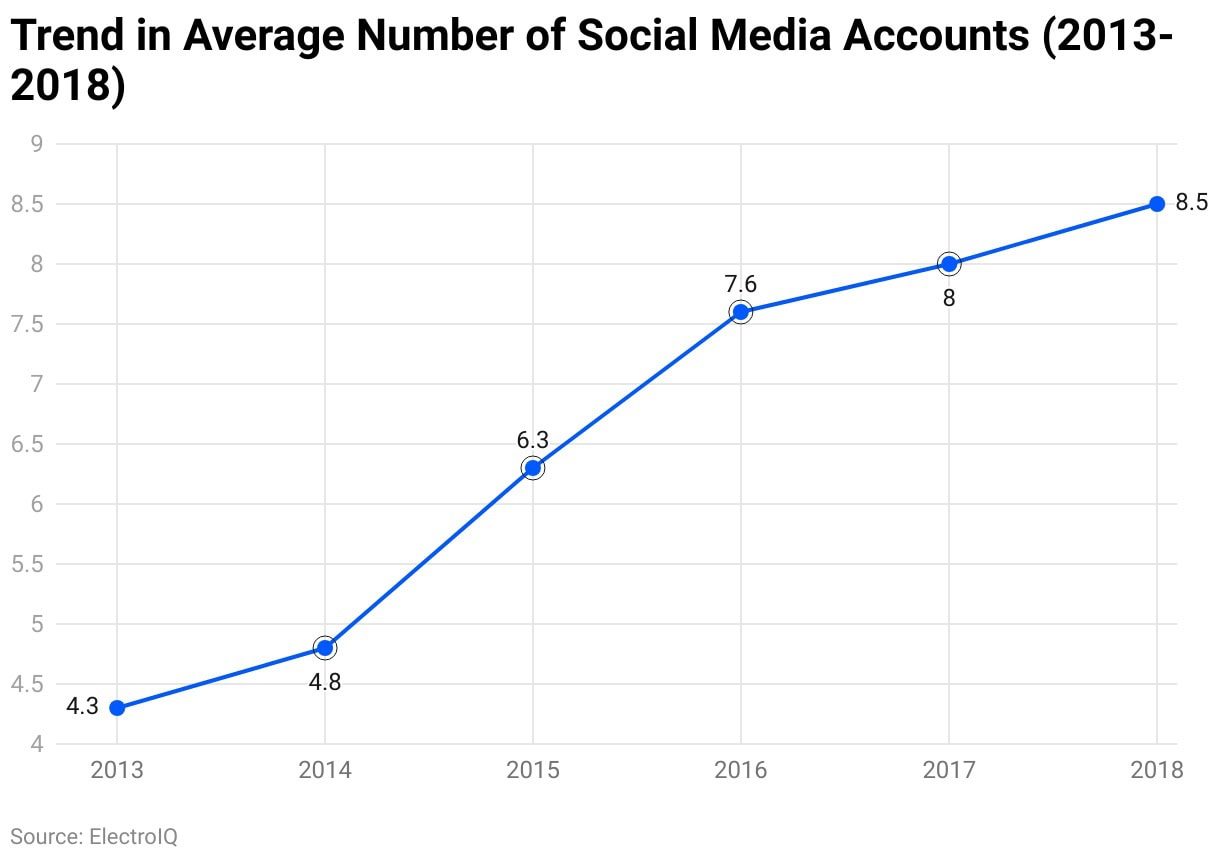
- Social Media Addiction Statistics show that the average number of social media accounts have been increasing consistently over time.
- In 2013, there were 4.3 social media accounts on average.
- As of 2018, the social media accounts, on average, were 8.5, showcasing the rising popularity of social media accounts.
Negative Effects of Social Media Posts
(Reference: statista.com)
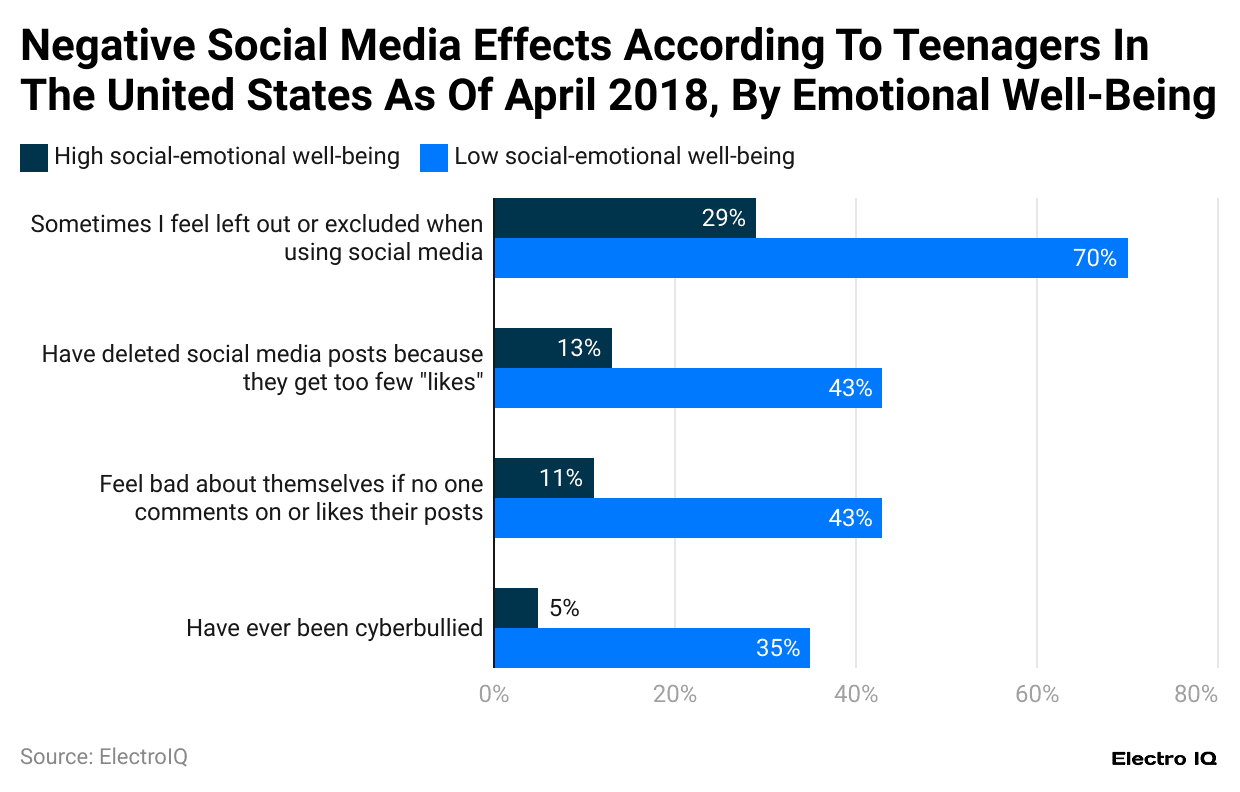
- Social Media Addiction Statistics show that 70% of users have low social-emotional well-being, and 29% of users have high social-emotional well-being on being left out or excluded when using social media.
- 43% of users have low social-emotional well-being, and 13% of users have high social-emotional well-being on deleting social media posts because they get too few “likes.”
- 43% of users have low social-emotional well-being, and 11% have high social-emotional well-being when they feel bad about themselves if no one comments or likes their posts.
- 35% of users have low social-emotional well-being, and 5% of users have high social-emotional well-being after having been cyberbullied.
Average Time Spent on Social Media
(Source: oxfordmail.co.uk)
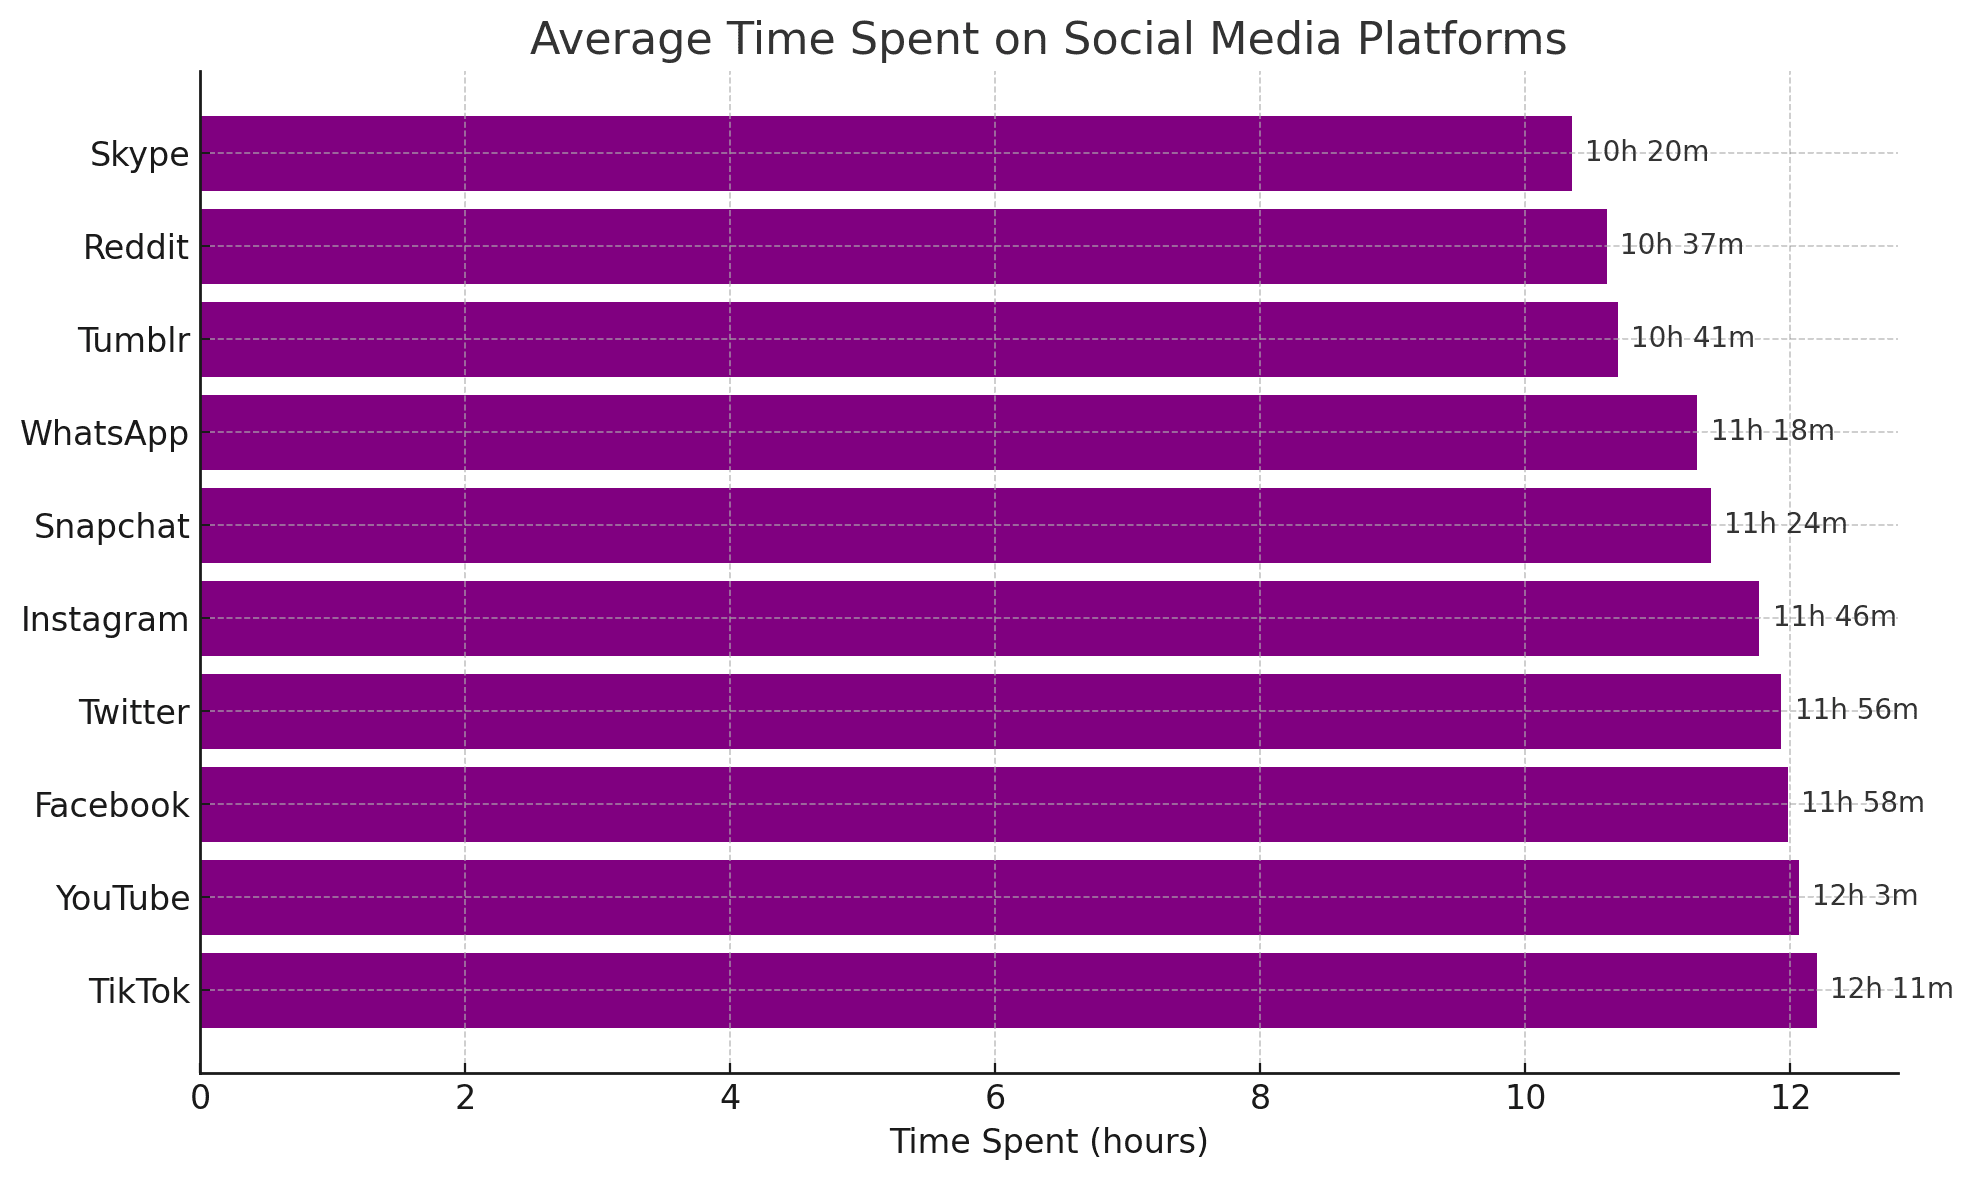
- Social Media Addiction Statistics show that TikTok users spend the most time on social media, on average, 12 hours and 11 minutes.
- YouTube has the second-highest average time spent on social media, with 12 hours and 3 minutes.
- Facebook has the third-highest average time spent on social media, with 11 hours and 59 minutes.
- Twitter has the fourth-highest average time spent on social media, with 11 hours and 56 minutes.
- Instagram has the fifth-highest average time spent on social media, with 11 hours and 46 minutes.
Teens Who Are Constantly Online
(Source: lanierlawfirm.com)
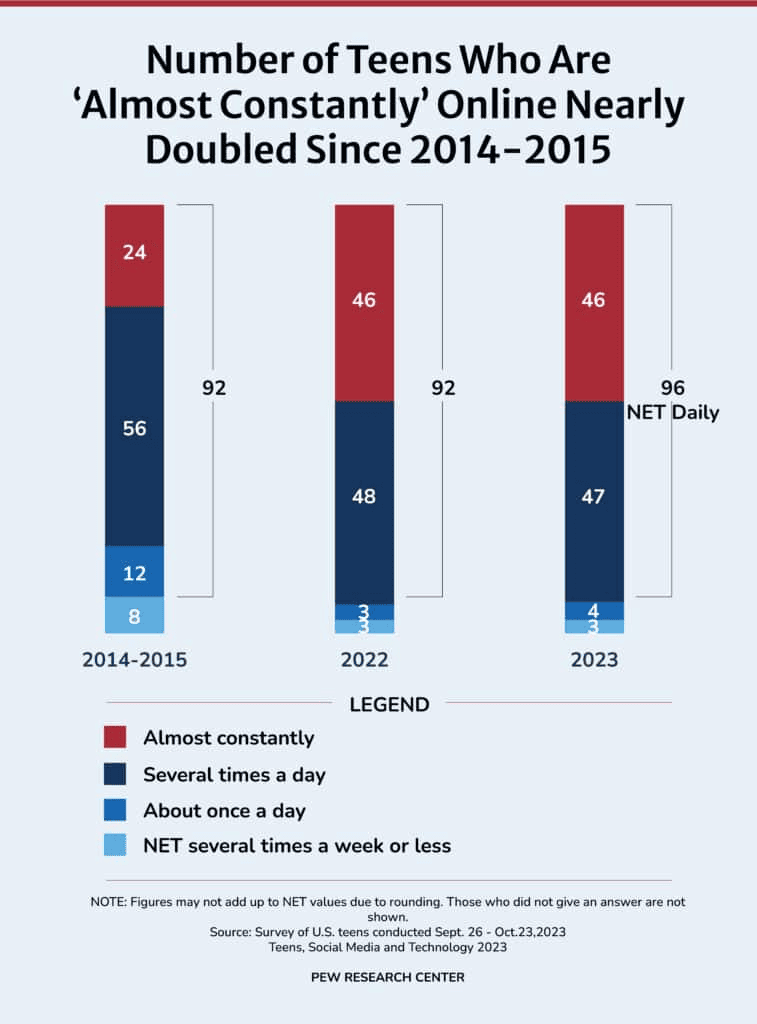
- Social Media Addiction Statistics show that the online presence of teenagers on social media is increasing consistently over time.
- In 2014-15, 56% of users used social media several times a day, 1and 24% of users used social media almost constantly, 12% of respondents used social media about once a day, and 8% used social media several times a week.
- In 2022, 48% of users used social media several times a day, 46% used social media almost constantly, 3% used social media about once a day, and 3% used social media several times a week.
- In 2023, 47% of users used social media several times a day, 46% used it almost constantly, 4% used it about once a day, and 4% used it several times a week.
Social Media Addiction By Gender
(Reference: statista.com)
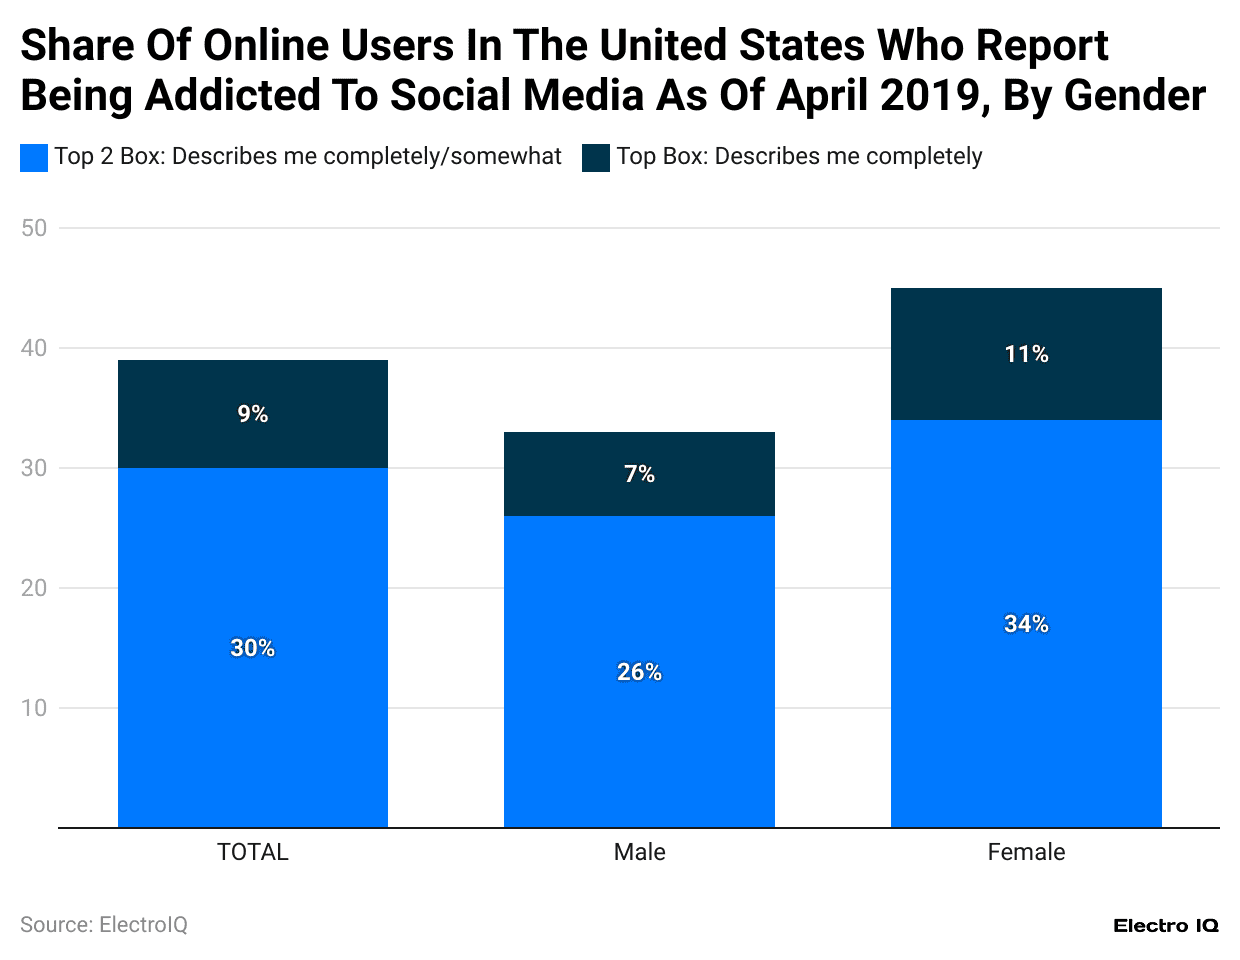
- Social Media Addiction Statistics show that among all genders, 30% of users are somewhat addicted to social media, and 9% of users are completely addicted to social media.
- Among males, 26% of users are somewhat addicted to social media, and 7% of users are completely addicted to social media.
- Among females, 34% of users are somewhat addicted to social media, and 11% of users are completely addicted to social media.
(Source: datareportal.com)
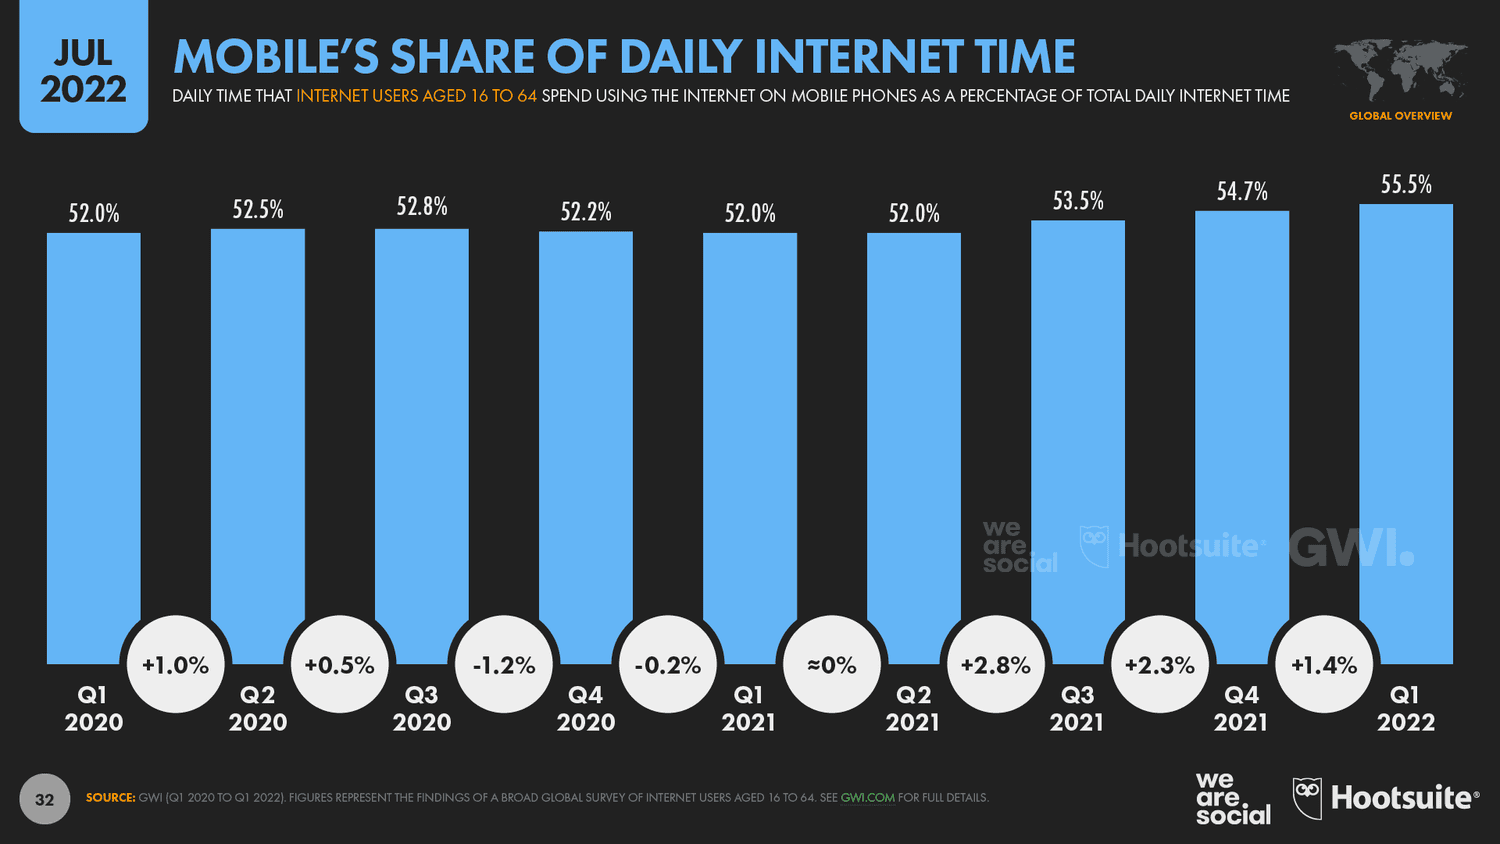
- Social Media Addiction Statistics show that mobile share of daily internet time has increased consistently.
- In Q1 2020, the mobile share of internet time was 52%.
- As of Q1 2022, the mobile share of internet time was 55.5%
Internet Time of Smartphone Users By Gender
(Source: datareportal.com)
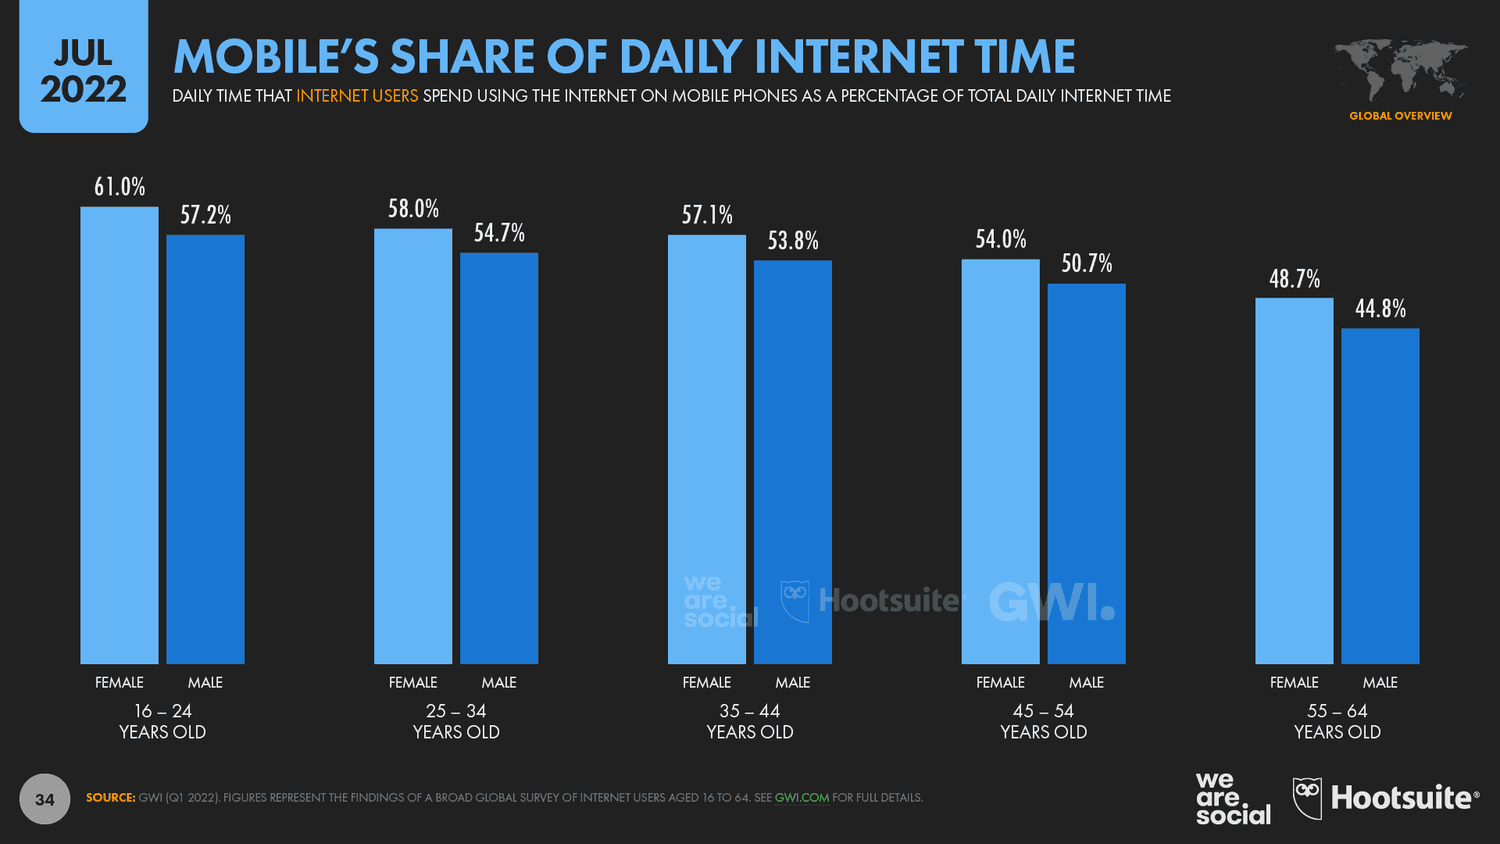
- Social Media Addiction Statistics show that among mobile phone users aged 16 -24 years, 61% of users are female, while 57.2% of users are male.
- Among mobile phone users aged 25-34, 58% are female, while 54.7% are male.
- Among mobile phone users aged 35-44, 57.1% are female, while 53.8% are male.
- Among mobile phone users aged 45-54, 54% are female, while 50.7% are male.
- Among mobile phone users aged 55-64, 48.7% are female, while 44.8% are male.
(Source: datareportal.com)
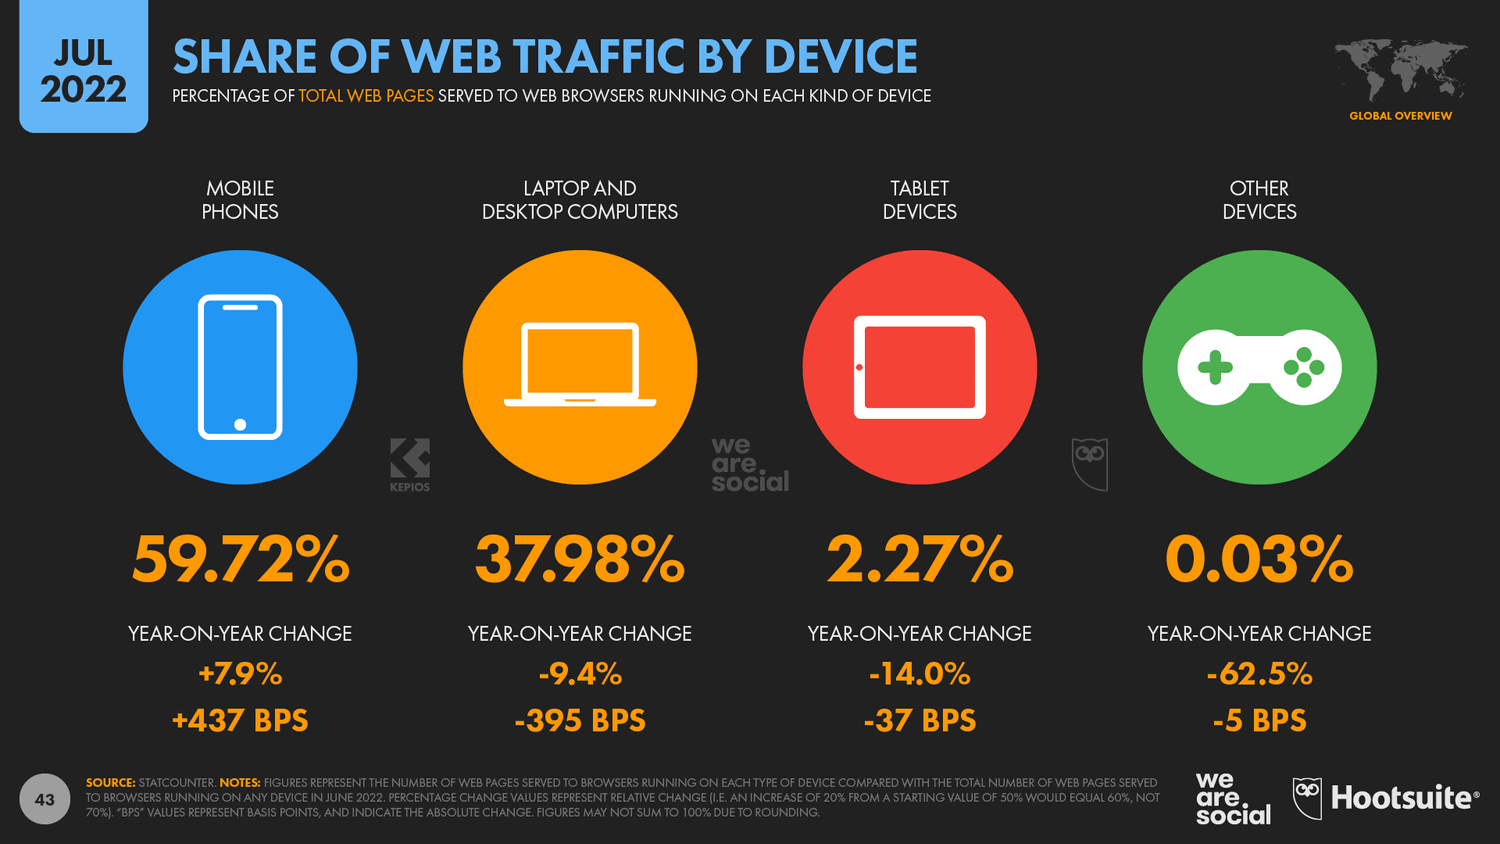
- Social Media Addiction Statistics show that mobile phone users make up 59.72% of all internet traffic.
- Laptop and desktop computer users account for 37.98% of all internet traffic.
- Tablet device users account for 2.27% of all internet traffic.
- Other device users account for 0.03% of all internet traffic.
Media Medium For News
(Source: datareportal.com)
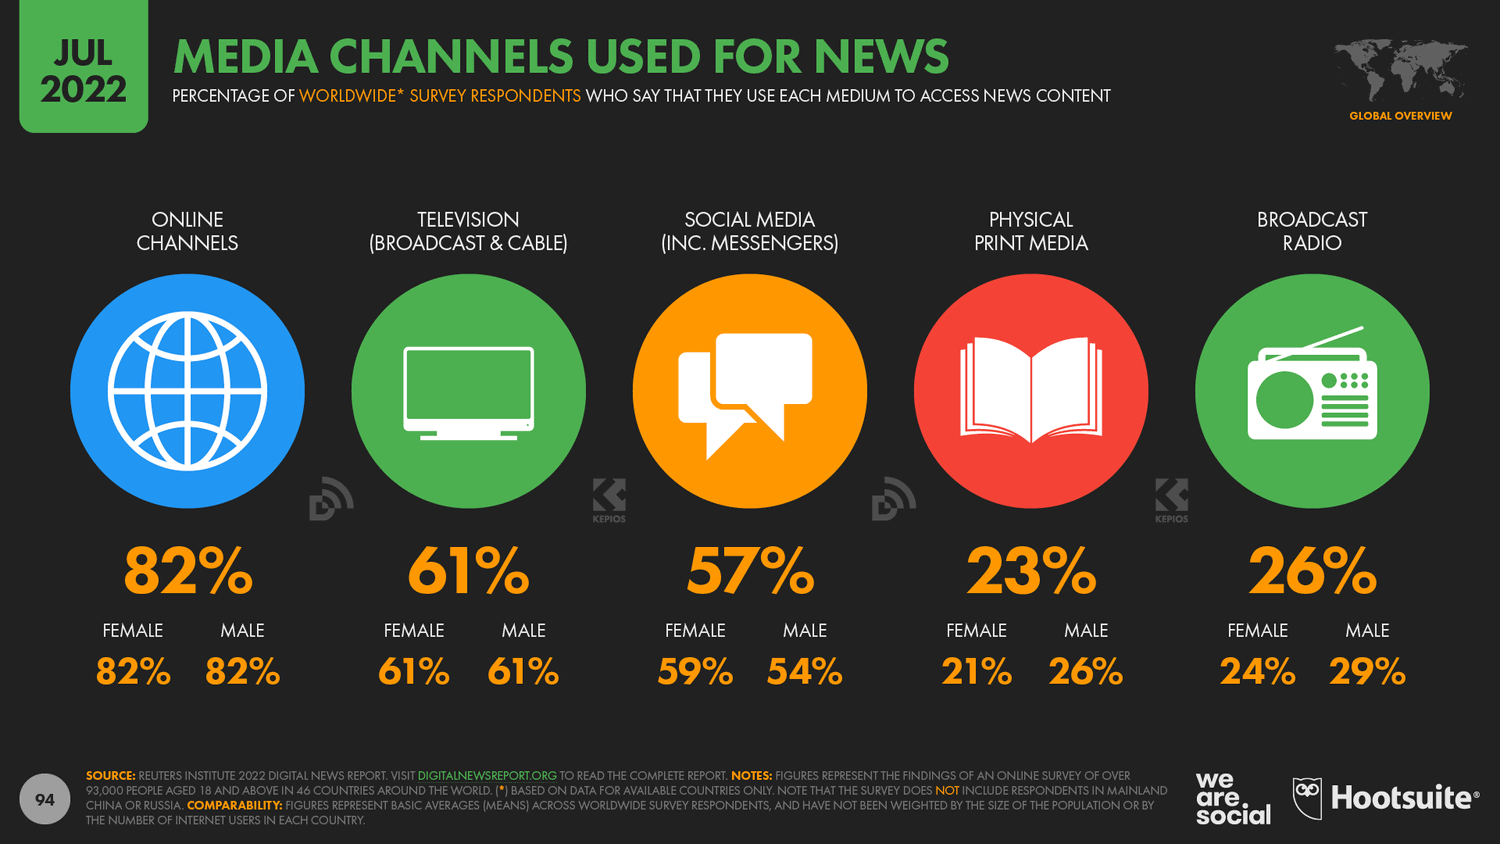
- Social Media Addiction Statistics show that 82% of users use online channels for news, which comprise 82% male and 82% female.
- 61% of users use television for news, comprising 61% male and 61% female.
- 57% of users use social media (including messengers) for news, 54% of whom are male and 59% female.
- 26% of users use broadcast radio for news, comprising 29% male and 24% female.
- 23% of users use physical print media for news, comprising 21% male and 26% female.
Social Media as a News Source By Country
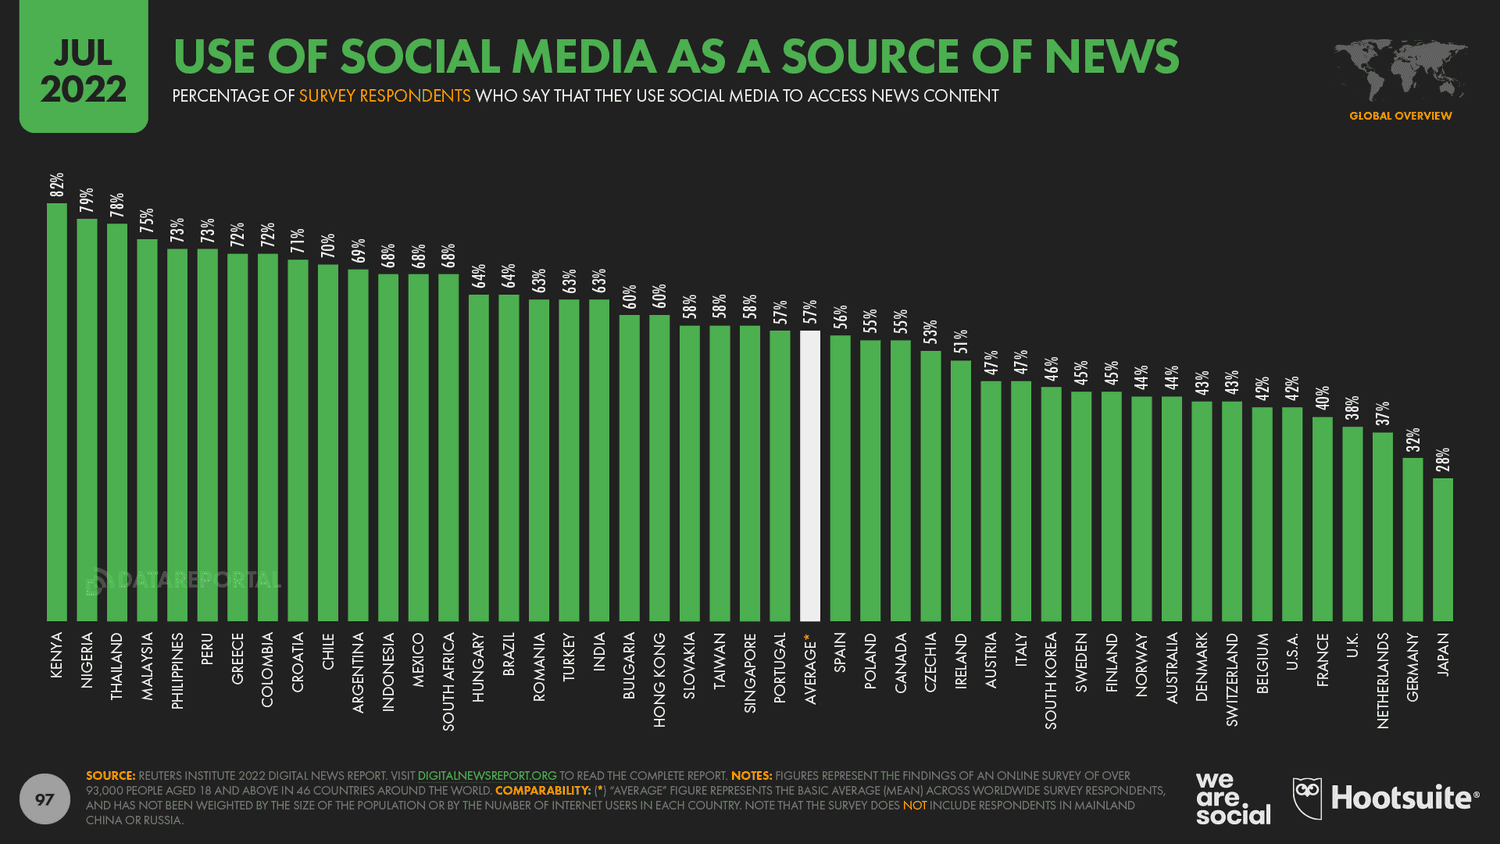
(Source: datareportal.com)
- Social Media Addiction Statistics show that globally, 57% of social media users use it as a news source.
- Globally, 82% of social media users in Kenya use it as a news source.
- In Nigeria, 77% of social media users use it as a news source.
- In South Africa, 66% of social media users use it as a news source.
- In the United States, 48% of social media users use it as a news source.
- In Japan, 28% of social media users use it as a news source.
Social Media Platforms Used For News
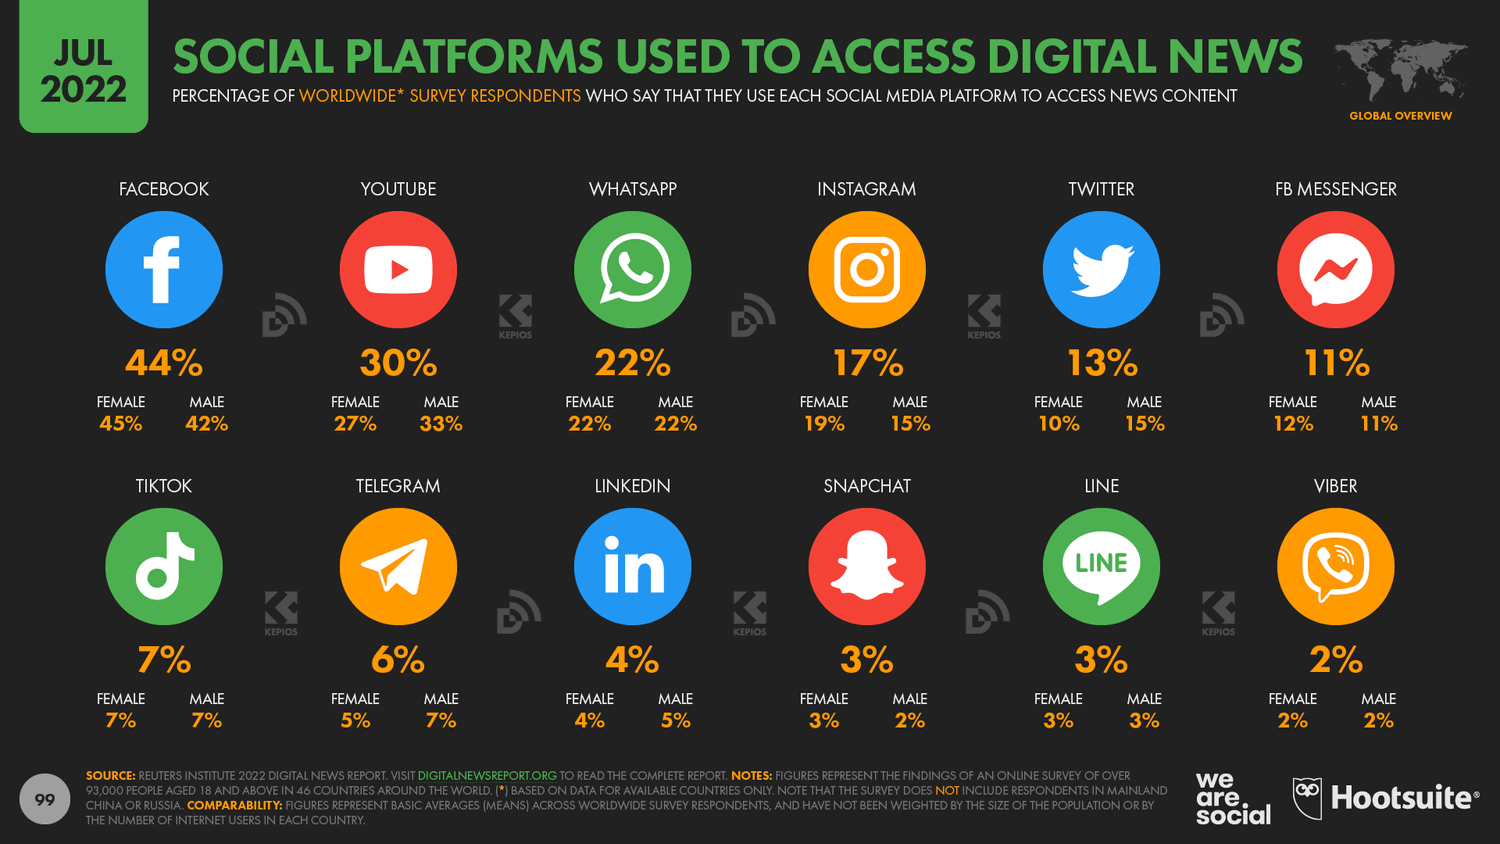
(Source: datareportal.com)
- Social Media Addiction Statistics show that Facebook is the leading social media platform for news, with 37% of users, 38% of females, and 36% of males.
- YouTube is the second most popular social media platform for news, with 31% of users, 27% of females, and 35% of males.
- WhatsApp is the third most popular social media platform for news, with 21% of users, 21% of females, and 21% of males.
- Instagram is the fourth most popular social media platform for news, with 18% of users, 20% of females, and 16% of males.
- TikTok is the fifth most popular social media platform for news, with 13% of users, 14% of females, and 12% of males.
- X (formerly Twitter) is the sixth most popular social media platform for news, with 10% of users, 8% of females, and 12% of males.
Conclusion
The Social Media Addiction Statistics reveals several significant trends and patterns highlighting the evolving digital landscape. Social media has become deeply embedded in daily life, with platforms like Facebook maintaining dominance while newer platforms like TikTok command unprecedented user engagement. The stark contrast in usage patterns across demographics is particularly noteworthy, with younger generations showing significantly higher engagement and addiction rates.
It also indicates concerns about social media’s impact on mental health and well-being, particularly among younger users. As social media evolves, understanding these patterns becomes crucial for developing healthier digital habits and more effective platform policies.
Sources
FAQ.
Facebook leads with 3,049 million users, followed by YouTube with 2,491 million users.
TikTok users spend an average of 12 hours and 11 minutes on the platform, making it the most time-consuming social media platform.
As of 2023, 46% of teens report being “almost constantly” online, with an additional 47% using social media several times daily.
The UAE leads with 115% social media penetration, indicating multiple account ownership per user.
The average number of social media accounts per person increased from 4.3 in 2013 to 8.5 in 2018.
Adults aged 18-29 show the highest usage at 84%, followed by those aged 30-49 at 81%.
Females show higher addiction rates, with 45% being either somewhat or completely addicted, compared to 33% of males.
Mobile devices account for 59.72% of all internet traffic.
Pinterest is most popular among female users, with 78% of its audience being female.
Globally, 57% of social media users use these platforms as a news source.

Maitrayee Dey has a background in Electrical Engineering and has worked in various technical roles before transitioning to writing. Specializing in technology and Artificial Intelligence, she has served as an Academic Research Analyst and Freelance Writer, particularly focusing on education and healthcare in Australia. Maitrayee's lifelong passions for writing and painting led her to pursue a full-time writing career. She is also the creator of a cooking YouTube channel, where she shares her culinary adventures. At Smartphone Thoughts, Maitrayee brings her expertise in technology to provide in-depth smartphone reviews and app-related statistics, making complex topics easy to understand for all readers.


